

Tumor necrosis factor alpha and lipopolysaccharides synergistic effects on T-cell immunoglobulin and mucin domain 3 regulation in dendritic cells
⁎Corresponding author.
-
Received: ,
Accepted: ,
This article was originally published by Elsevier and was migrated to Scientific Scholar after the change of Publisher.
Peer review under responsibility of King Saud University.
Abstract
Background and objectives
Mature dendritic cells (DCs) are essential inducers of anti-tumor immunity. However, the inflammatory tumor microenvironment (TME) develops tumor associated DCs (TADCs) that adopt different immunosuppressive mechanisms. T-cell immunoglobulin and mucin domain 3 receptor (TIM-3) is an immune checkpoint that suppresses anti-tumor immunity and accelerates T-cell exhaustion which is expressed on IFN-γ-producing T cells, macrophages, and dendritic cells. Administering TIM-3 blockade in vivo can enhance anti-tumor immunity and inhibit tumor growth. TIM-3 expression can be induced on natural killer cells (NKs) in vitro by tumor necrosis factor alpha (TNF-α). Therefore, this study aims to investigate whether TNF-α can induce the expression of TIM-3 and its ligand galectin-9 (Gal-9) on DCs in vitro.
Materials and methods
DCs were produced from peripheral blood mononuclear cells (PBMCs) of healthy donors by 800 U/ml rh IL-4 and 500 U/ml rh GM-CSF in the presence or absence of 1 µg/ml lipopolysaccharide (LPS) and/or 5 ng/ml rh TNF-α.
Results
Phenotypic analysis showed that treating cells with LPS induced the expression of DC markers (MHC class I & II), maturation markers (CD83), costimulatory markers (CD80, CD86) and reduced monocyte markers (CD14). Similar results were observed in the presence of TNF-α alone or in combination with LPS. Interestingly, LPS-treated and TNF-α-treated cells lack TIM-3 expression compared to untreated cells as 90% of these untreated cells were TIM-3 positive, with no differences in the expression of Gal-9 in all treated and untreated cells.
Interpretation and conclusion
These results revealed that TNF-α and LPS either alone or combined induced the maturation of DCs in vitro and that the absence of both caused DCs to maintain an immature state and induced the expression of TIM-3. This finding indicates that TNF-α is unable to induce TIM-3 on mature DCs in vitro.
Keywords
Dendritic cells (DCs)
Tumor associated dendritic cells (TADCs)
T-cell immunoglobulin and mucin domain-3 (TIM-3)
Tumor necrosis factor alpha (TNF-α)
Tumor microenvironment (TME)

1 Introduction
Immune-based treatment is a pioneering method that has been recently used to improve the human anti-tumor immune responses, able to eliminate tumor cells and suppress tumor progression (Zhang and Zhang, 2020). The immune system can sense tumor neoantigens and initiate anti-tumor responses. However, some tumors have the ability to possess immune cell functions, so they do not produce inhibitory ligands and form immune checkpoints on tumor-specific immune cells (Chen et al., 2021). This process can induce negative regulatory pathways enable tumors to escape the immunosurveillance.
Dendritic cells (DCs) are crucial to initiate anti-tumor immune responses, considered as messengers between innate and adaptive immunity, resulting in the stimulation of naïve T cells (Steinman and Cohn, 1973; Aldahlawi et al., 2020). DCs are a heterogeneous group of the most professional antigen presenting cells (APCs) (Balan et al., 2019). DCs can be categorized into immature (iDCs) and mature (mDCs) based on the existence of co-stimulation and maturation markers (Wang et al., 2020). While mDCs are capable of expressing costimulatory and maturation markers such as HLA-DR, CD86, CD80, CD54, and CD83 when examined phenotypically, iDCs can be identified by downregulating these molecules (Morrissey et al., 2020). During immune responses, iDCs respond to a variety of inflammatory mediators, including bacterial lipopolysaccharides (LPS), which are then altered into mDCs able to activate T cells (Morrissey et al., 2020). In addition, the tumor microenvironment (TME) is involved in the upregulation of numerous cell surface molecular via DCs, relocation to lymph nodes, and displaying antigens through the major histocompatibility complex (MHC) (Embgenbroich and Burgdorf, 2018). MHC proteins found on DC surfaces present antigens to the adaptive immunity, which allows CD8+ and CD4+ T cells to recognize the presented antigens and initiate T-cell immunity (Morrissey et al., 2020; Fang et al., 2022). DCs can also be classified based on several factors, including key gene signatures and phenotypes, including essential transcription factors, Toll-like receptors (TLRs), and other molecules, such as chemokine receptors, C-type lectin receptors, and ontogeny (Balan et al., 2019; Rhodes et al., 2019). DCs are categorized primarily as steady-state DCs, Langerhans cell LCs and inflammatory DCs (Balan et al., 2019). However, TME is highly immunosuppressive and can develop tumor-associated dendritic cells (TADCs) (Laoui et al., 2016). Many different forms of cancer, including colorectal, breast, gastric bladder, ovarian, neck, head, renal, and lung cancer, can be influenced by the high numbers of TADCs, which have been correlated with poor prognosis of cancer (Janco et al., 2015; Karthaus et al., 2012). Moreover, various immunosuppressive molecules expressed on DCs affect T-cell infiltration into the tumor, including programmed cell death-1 (PD-1), cytotoxic T-lymphocyte-linked protein 4 (CTLA-4), and T-cell immunoglobulin and mucin domain 3 (TIM-3) (Janco et al., 2015; Saleh et al., 2019). The existence of such molecules can influence the effectiveness of several cancer treatments, such as immunotherapies, including DC vaccinations (Morrissey et al., 2020; Seidel et al., 2018).
TIM-3 has been detected on the surface of both immune and tumor cells (Ocaña-Guzman et al., 2016). It was first discovered as a cell surface molecule on T helper cells (CD4+) and T cytotoxic cells (CD8+) (Sakuishi et al., 2011). Human tumors have been reported to induce the secretion of TIM-3 on DCs as a result of multiple immunosuppressive factors, such as interleukin 10 (IL-10), vascular endothelial growth factor A (VEGF-A), transforming growth factor beta 1 (TGF-β1), arginase, and indoleamine 2,3-dioxygenase (IDO) (Janco et al., 2015; Miyashiro et al., 2022). Thus, TIM-3 is another target that could be used in cancer treatment. Interfering with TIM-3 pathways can result in the induction of anti-tumor immunity. Moreover, TIM-3 ligand galectin-9 (Gal-9) interacts with PD-1 and TIM-3 to control T-cell death through the activation of immune responses or the induction of apoptosis (Ndhlovu et al., 2012; Liu et al., 2016). It was also suggested that TIM-3 provokes human natural killer (NK) cells to bolster the secretion of interferon gamma (IFN-γ) in response to galectin-9 (Gleason et al., 2012; Zheng et al., 2019). Other studies have found that TIM-3+ NK cells in cancer generate diminished amounts of IFN-γ, which are functionally exhausted (Zheng et al., 2019). To date, the effect of TIM-3 and its ligand Gal-9 on DCs is still under investigation. Recently, a study showed that TIM-3 expression can be induced on NK cells in vitro via the addition of tumor necrosis factor alpha (TNF-α) through the nuclear factor kappa B (NF-κB) signaling pathway, which provokes dysfunction in targeted cells (Zheng et al., 2019). Therefore, this study aims to investigate the ability of TNF-α to induce the expression of TIM-3 and its ligand galectin-9 (Gal-9) on DCs in vitro.
2 Materials and methods
2.1 Blood sample collection
Blood samples were collected from healthy adult individuals, females, and males after signing a consent form. The ethical approval number (HA-02-J003) was obtained from King Fahad Medical Research Center. All blood sample procedures were handled following ethical standards.
2.2 DC preparation and LPS- and/or TNF-α treatment
DCs were generated as described in (Romani et al., 1996). Fresh blood samples (typically 50 ml) were collected from healthy volunteers into ACD-A vacutainer tubes containing dextrose trisodium citrate and citric acid (DB Vacutainer®, Canada). Blood samples were mixed with Hanks’ balanced salt solution (HBSS: UFC Biotech, KSA) at a 1:1 ratio. Diluted blood was then used to isolate peripheral blood mononuclear cells (PBMCs) in which 25 ml of diluted blood was added to 10 ml of Lymphocyte Separation Medium (Sigma–Aldrich®, UK) to obtain density gradient centrifugation at room temperature (RT) for 30 min at 400xg without breakage. The buffy coat layer was transferred by a sterilized transfer Pasteur pipette (Fisherbrand, USA) into new tubes and washed with HBSS and then centrifuged at 1600 rpm for 10 min. at 4 °C. For optimal lysis of RBCs, the collected pellet was treated with 25 ml of RBCs lysis buffer and incubated for 10 min. at RT. PBMCs were washed with HBSS and resuspended in RPMI 1640 medium (UFC Biotech, KSA) supplemented with 10% fetal bovine serum (FBS), 1% penicillin–streptomycin (PS) (Gibco Life Technologies, USA), and L-glutamine and distributed into 6 well plate (Falcon®, USA) Monocyte cells were allowed to adhere for 2 h in 5% CO₂ at 37 °C. For DC differentiation, the cells were cultured with 100 ng/ml rh GM-CSF and 50 ng/ml rh IL-4 (R&D Systems, UK). On day seven, iDCs were cultured for 48 h with 1 µg/mL LPS (Sigma–Aldrich®, USA) in the absence or presence of 5 ng/ml rh TNF-α (R&D, USA).
2.3 Microscopic analysis of DCs
Morphological changes were studied from day 1 to 9 of DC culturing using (400×) magnification via an inverted microscope (Nikon eclipse Ti-S, Tokyo, Japan).
2.4 Phenotypic analysis of DCs
DCs were collected at the end of the incubation period and treated first with an Fc blocker for 15 min. at RT. DCs were then incubated for 30 min. on ice and in the dark with human monoclonal antibodies (MoAbs) in different combinations: anti-CD11c-PE/FITC, anti-CD83-APC-Cy7, anti-CD80-FITC, anti-CD86-PE-Cy7, anti-CD14-APC-Cy7, anti-HLA-DQ-FITC, anti-HLA-E-PE-Cy7, anti-TIM-3-PE and anti-Gal-9-APC. MoAbs were purchased from (BioLegend®, San Diego, USA). Dead cells were excluded by staining with 7AAD. Unstained control and stained samples were run on BD FACSAria™ III flow Cytometry (Becton Dickinson, USA). FlowJoTM version 10 software (Becton Dickinson, USA) was used for single cell analysis.
2.5 Statistical analysis
Statistical analyses were performed using GraphPad Prism 9.2.0 (Dotmatics, UK). A paired T test was used to compare TIM-3 expression between untreated DCs and LPS-treated DCs. In addition, one-way ANOVA was used to compare TIM-3 expression between the different DC treatments.
3 Results
3.1 Morphological analysis of LPS- and/or TNF-α-treated DCs
Cell morphology was monitored from day 1 until day 7 (Fig. 1A). While the cells appeared as a single cell separated and scattered on day 1, after the addition of 800 U/ml rh IL-4 and 500 U/ml rh GM-CSF, they started to aggregate from day 2 onward. Cells were refed on day 4 or treated with 1 µg/ml lipopolysaccharide (LPS) and/or 5 ng/ml rhTNF-α on day 7 for 48 h. Fig. 1B shows the different morphology of cells on day 9 without LPS or TNF-α (top left), treated with 1 µg/mL LPS alone (top right), treated with 5 ng/ml TNF-α alone (bottom left), and treated with both LPS and TNF-α (bottom right). The morphology of DCs was observed by using an inverted microscope. The results showed that iDCs appeared semi-rounded and irregular in shape with short cytoplasmic projections and that the cells were desegregated (Fig. 1B: Top left). Contrary to iDCs, mature dendritic cells (mDCs) appeared as typical mature DC shapes and were found to be aggregated in clusters (arrow in Fig. 1B: top right), elongated (arrow in Fig. 1B: bottom left), more irregularly shaped with long cytoplasmic projections and an increased number of dendrites (arrow in Fig. 1B: bottom right). This finding indicates that treating cells with LPS and/or TNF-α resulted in cell morphology that resembled mature DCs, as evidenced by the irregular, elongated, and aggregated clusters, unlike the untreated cells, which presented rounded cells with short cytoplasmic projection as an immature cell morphology.
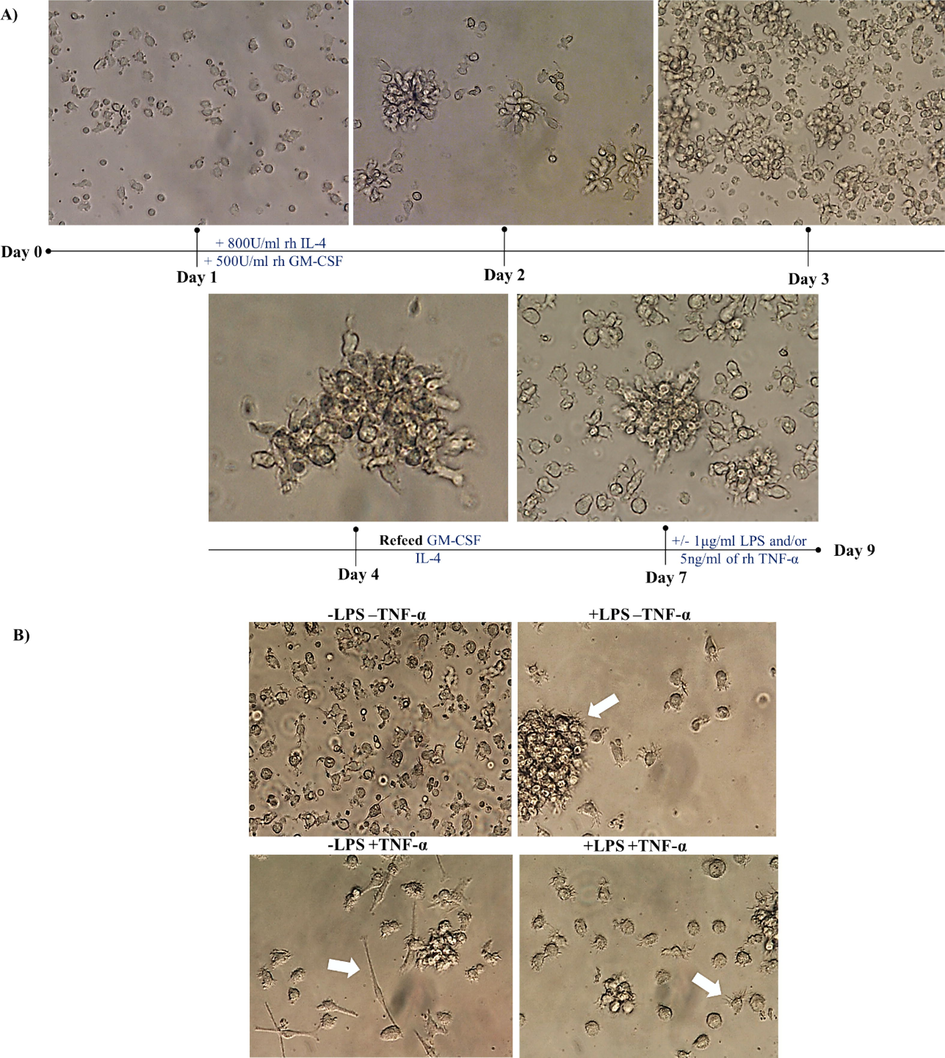
- Morphological analysis of dendritic cells in the presence or absence of 1 µg/ml LPS and/or 5 ng/ml TNF-α. (A) Represents cell monitoring and feeding from day 1 to day 7. On day 7, cells were cultured in the presence and absence of 1 µg/ml LPS and/or 5 ng/ml TNF-α. (B) Shows microscopic images of cells on day 9 after left without treatment (top left), treated with 1 µg/ml LPS (top right), treated with 5 ng/ml TNF-α (bottom left), treated with both (bottom right). Data are representative of 7 separate experiments. Photographed by inverted microscope (with magnifications of 400×). Immunology unit, KFMRC, KAU.
3.2 Phenotypic analysis of LPS- and/or TNF-α-treated DCs
To examine whether treating the cells with 1 µg/ml LPS and/or 5 ng/ml TNF-α resulted in mDC, phenotypic characteristics via flow cytometry were used following the gating strategy shown in Fig. 2A. To obtain reliable staining data, an Fc blocker was added prior to staining with fluorescently labeled antibodies to prevent nonspecific binding. The cells, singlets, and live/dead staining were gated to exclude false positive results from dead cells. Then, the stopping gate was set at CD11c as a marker for DCs. DCs were analyzed for surface expression of antigen presenting markers (MHC class I & II), maturation markers (CD83), costimulatory markers (CD80, CD86) and monocyte markers (CD14). The results in Fig. 2B show that MHC class I & II, CD83, CD80 and CD86 were upregulated in LPS- and/or TNF-α-treated DCs compared to untreated DCs. In addition, CD14 is downregulated in LPS- and/or TNF-α-treated DCs, unlike imDCs, which still express CD14. This finding indicates that LPS and/or TNF-α induce the maturation of DCs.
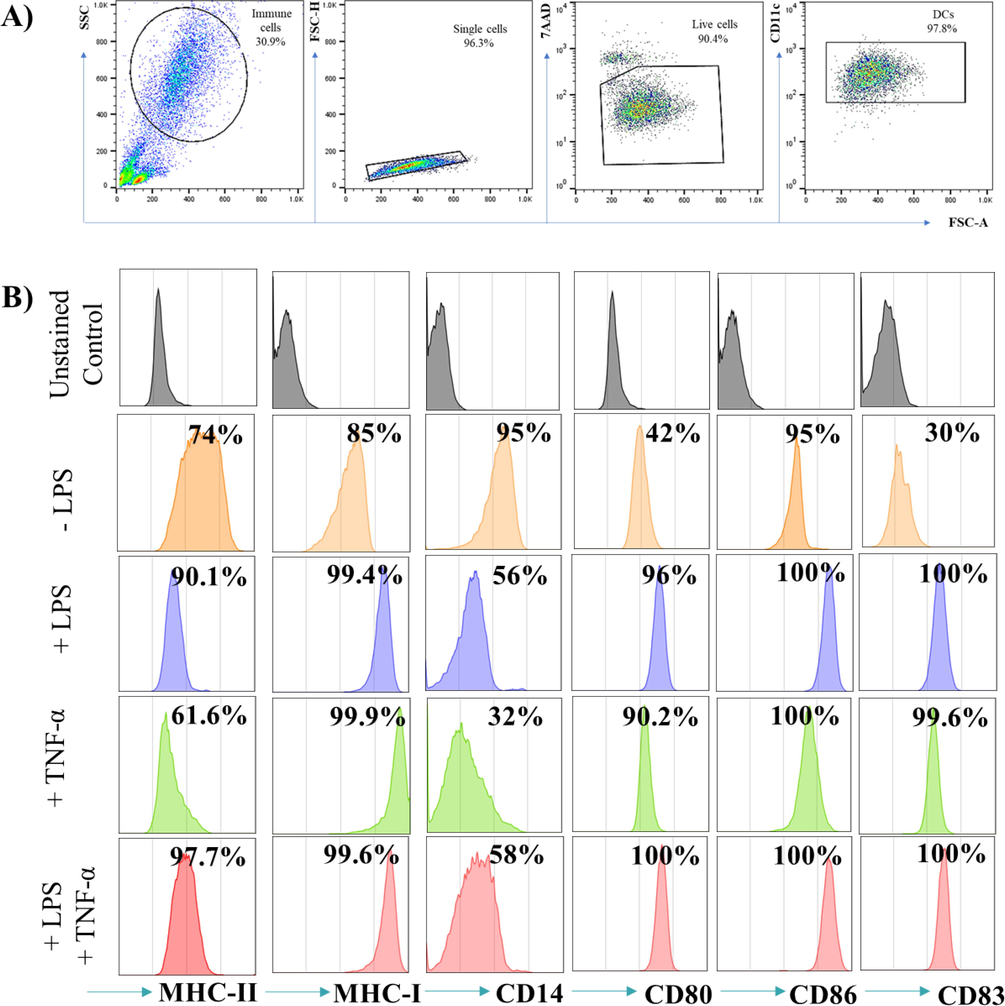
- Phenotypic analysis of LPS- and/or TNF-α- treated DCs. (A) Represents the gating strategies used to collect the cells where the stopping gate are set on CD11c positive cells. (B) Shows histograms of CD markers in which the grey histograms are the unstained control and the orange, blue, green and red histograms indicate -LPS, +LPS, +TNF-α and +LPS and TNF-α- treated DCs respectively. DCs were either left untreated, or stimulated with 1 µg/ml LPS and or 5 ng/ml TNF-α for 48 hrs. The data are representative of 4 separate experiments.
3.3 Expression of TIM-3 and Gal-9 on LPS- and/or TNF-α-treated DCs
TNF-α can induce the expression of TIM-3 on NK cells in vitro (Zheng et al., 2019). To examine whether TNF-α can induce the expression of TIM-3 on DCs in vitro, DCs were treated with LPS and/or TNF-α in the last 48 h of culture. Interestingly, TIM-3 expression levels in the untreated cells were increased significantly (P value <0.0001) compared with LPS-treated DCs cells. Moreover, 90% of these untreated cells were TIM-3 positive (Fig. 3A, C), whereas there were no discrepancies in the expression of Gal-9 in all treated and untreated DCs cells (Fig. 3B).
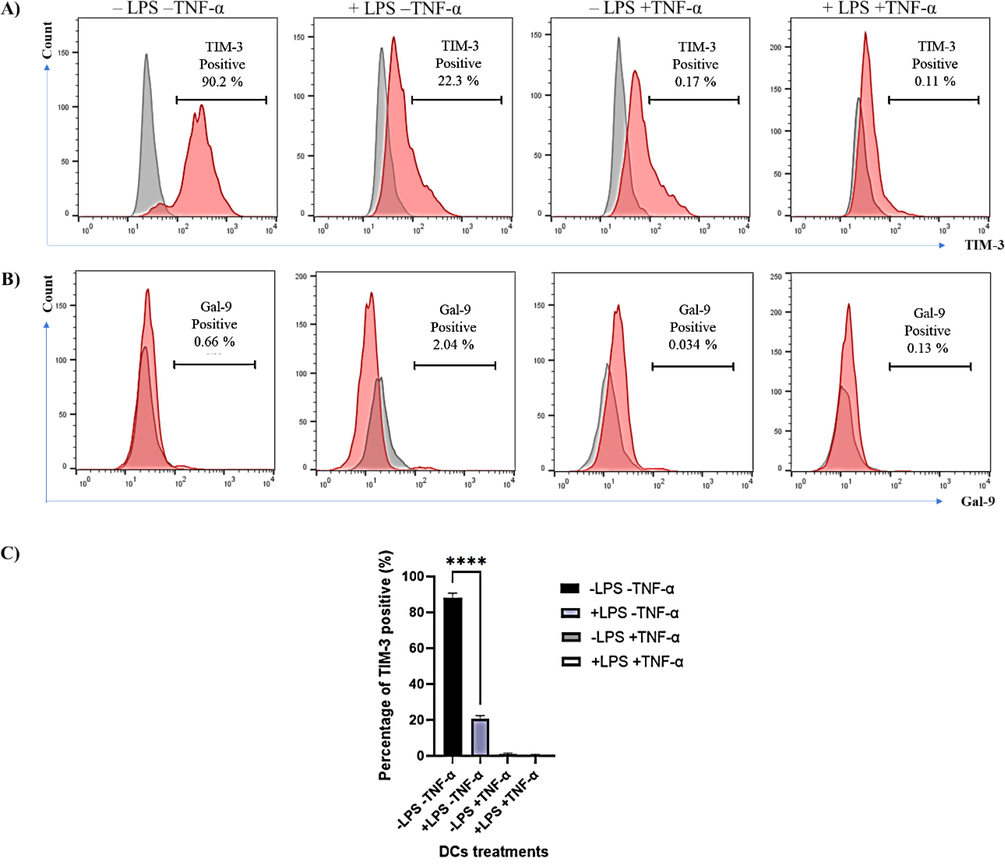
- Expression of TIM-3 and Gal-9 on LPS- and/or TNF-α- treated DCs. (A) Shows representative experiment on the expression of TIM-3 on untreated DCs, +LPS, +TNF-α and +LPS and +TNF-α. (B) Represents the expression of Gal-9 on the same untreated and LPS and/or TNF-α DCs. Red histograms show stained cells, whereas grey histograms represent unstained control. Data are representative of 3 separate experiments. (C) Shows the combined results of the three experiments. Statistical analysis using paired t-test to compare untreated DCs with LPS-treated DCs. **** indicates significant levels of P value <0.0001.
4 Discussion
DCs have a vital role in priming anti-tumor T-cell immunity; thus, they are considered a potential therapeutic target for cancer immunotherapy (Kwiecień et al., 2021). Mature DCs present tumor antigens on their surface and initiate anti-tumor immune responses to activate CD8+ and CD4+ T cells (Zhang et al., 2020). Mature DCs characterized by the expression of CD83 as a consequence of the addition of LPS in vitro (Morrissey et al., 2020). In contrast, CD14 expression is linked to immature DCs (Aldahlawi et al., 2020). Human leukocyte antigen DR (HLA-DR), CD80, and CD86 surface markers are also increased on the surface of DCs to guarantee that DCs can produce an efficient T-cell response (Morrissey et al., 2020). The same observations are reported in our study in which challenging DCs with LPS increased the expression of CD80, CD83, and CD86 along with HLA-DR and maintained CD14 in lower expression levels. The induction of mature DCs in vitro relies on the treatment concentrations and the exposure time of the LPS. This indicates that mature DCs can be induced in vitro. However, within the TME, DC differentiation can be controlled, and their longevity and function are affected by TME factors and different TME cell types (Kwiecień et al., 2021). In addition, the activation and maturation of DCs can also be influenced by the local TME via the inhibition of the anti-tumor response (Kwiecień et al., 2021; Peng et al., 2021).
Immune checkpoints contain inhibitory and stimulatory receptors that regulate immune tolerance and immune responses against tumors. One of the inhibitory checkpoints is TIM-3. The expression levels of TIM-3 are associated with CD8+ T-cell exhaustion (Kwiecień et al., 2021; Jin et al., 2010; Jones et al., 2008; Golden-Mason et al., 2009). Recently, it was found that TIM-3 is also considered an exhaustion marker in CD8+ T cells of COVID-19 patients (Shahbazi et al., 2021). Another study found that TIM-3 inhibitory effect on anti-tumor immunity is related to its effects on the NLR family pyrin domain containing 3 (NLRP3) inflammasome activation in DCs rather than its effects on T cells (Smith et al., 2021; Dixon et al., 2021). NLRP3 is a multimeric protein complex that releases pro-inflammatory cytokines (Yang et al., 2019). Furthermore, co-expression of TIM-3 and PD-1 has been linked to functionally drained NK cells in colon cancer tissues (Zheng et al., 2019; Seo et al., 2017). Therefore, it is essential to study the effect of TIM-3 on DCs to determine its effect on T-cell anti-tumor immunity. It is also necessary to examine the immunosuppressive factors that can upregulate TIM-3 and its ligand Gal-9 on DCs.
Immune checkpoint inhibitors block checkpoint proteins from binding with their ligands, activating T cells to destroy tumor cells. The blockade of immune checkpoint receptors has massive potential to cure most cancer types, including lung, melanoma, Hodgkin’s lymphoma, and renal cancer (Monney et al., 2002). TIM-3 is a T-cell inhibitory receptor (Fourcade et al., 2010), which is coregulated and co-expressed with other immune checkpoint receptors such as PD-1 and Lag-3 on CD4+ and CD8+ T cells (Ngiow et al., 2011). TIM-3 expression was also detected on the exhausted CD8+ T cells in both solid and hematologic cancer (Stoitzner et al., 2008). However, the role of TIM-3 in leukemia is still unclear. Overexpression of TIM-3 in different cancer types is often associated with poor clinical outcomes and poor survival. A previous study has induced the expression of TIM-3 on NK cells in vitro by TNF-α. TNF-α is a member of the cytokine family with a multifunctional role and is considered an essential factor secreted by the tumor cells and the activated immune cells (Zheng et al., 2019). TNF-α can stimulate the expression of TIM-3 on NK cells by activating NF-κB cascade. The results indicated that TIM-3 expression on NK cells was blocked via an NF-κB inhibitor. This suggested that the expression of TIM-3 was mediated by NF-κB (Zheng et al., 2019). The NF-κB signaling pathways are important in the development of DC maturation (Chen et al., 2021; Poligone et al., 2002). In addition, TIM-3 signaling influences DC activation and maturation, as it blocks the NF-κB pathway (Maurya et al., 2014). Therefore, the inhibitory signaling of TIM-3 may correlate with DCs in their immature state, as shown in our results. TIM-3 expression was upregulated in the immature state of DCs when DCs were left without LPS and TNF-α treatment in vitro. Therefore, our study demonstrated that TNF-α could not promote TIM-3 expression on DCs in vitro. In addition, our data indicated that TNF-α acts synergistically with LPS to maintain the absence of TIM-3 expression on DCs. Several studies have linked overexpression of TIM-3 to a mature cell state instead (Xu et al., 2017). In our study, mature DCs lacked the expression of TIM-3 and could present antigens through MHC-I and MHC-II molecules capable of priming CD4+ and CD8+ T cells. In a tumor-free microenvironment, hemopoietic precursors produce progenitors, which differentiate into immature DCs. When a danger antigen signal is expressed, immature DCs undergo maturation to become able to produce specialized fighting antigens during the encounter. However, differentiation of DCs is often impaired within the TME, causing the increase of deficient immature DCs (Stoitzner et al., 2008). For instance, tumor-infiltrating DCs (TIDCs) were unable to produce tumor-derived antigens and have hindered capabilities to stimulating the proliferation of tumor-specific CD4+ and CD8+ T cells. In our study, we found that TIM-3 was expressed in immature DCs, indicating that immature DCs in tumors have limited antigen-presenting and inhibiting the priming of effective anti-tumor immunity via the upregulation of TIM-3. Therefore, the existence of DCs in a mature state not only maintains the primming of anti-tumor CD4+ and CD8+ T cells by tumor antigens presented by DCs, but also causes mature DCs not to present any inhibitory molecules such as TIM-3.
5 Conclusion
This study aims to examine whether TNF-α is able induce the expression of TIM-3 and its ligand Gal-9 on DCs in vitro. Results suggested that TNF-α and LPS either alone or in combination induced the maturation of DCs in vitro and that the absence of both caused DCs to maintain an immature state. This immature status of DCs provoked the expression of TIM-3 in vitro. The present finding indicates that TNF-α is unable to promote TIM-3 on DCs in vitro. Therefore, the role of TIM-3 on DCs as well as the factors that may upregulate it on DCs must be investigated further to improve the efficacy of DCs in anticancer treatments. This study has some limitations which include the different numbers of DCs generated from monocytes between experiments. This is due to individuals’ variation that is unavoidable. Without the induction of TIM-3 in DCs in vitro, it will be difficult to investigate the effect of TIM-3+DCs on CD8+ and CD4+ in vitro. Therefore, using genetically modified DCs that express TIM-3 will be a future direction. An interesting question to further be investigated is whether immunological or pharmacological therapy in cancer patients can modify the ratio of immunogenic versus regulatory DCs in the tumor microenvironment to enhance tumor-specific responses in cancer patients. Further work is needed to have a more in-depth insight into tumor biology and the role of DC repertoire at different time points in the tumor. Additionally, analysis of DCs and their correlation with immune responses can help explain these issues, which can lead to advanced and improved cancer immunotherapy approaches.
Acknowledgement
We would like to thank the Deanship of Scientific Research (DSR) at King Abdulaziz University (KAU) for funding this project under the grant number (G:481-247-1440). In addition, gratitude goes to the Department of Biological Sciences and the Immunology unit at King Fahad Medical Research Center of King Abdulaziz University for supporting this study and providing ethical approval to carry out experiments.
Declaration of Competing Interest
The authors declare that they have no known competing financial interests or personal relationships that could have appeared to influence the work reported in this paper.
References
- The efficacy of coriandrum sativum, anethum graveolens, and linum usitatissimum essential oil nanoemulsions on human dendritic cells. Int. J. Pharm. Res. Appl. Sci.. 2020;9:125-132.
- [Google Scholar]
- Immunosuppressive effect of Columbianadin on maturation, migration, allogenic T cell stimulation and phagocytosis capacity of TNF-α induced dendritic cells. J. Ethnopharmacol.. 2021;114918
- [Google Scholar]
- TIM-3 restrains anti-tumour immunity by regulating inflammasome activation. Nature 2021:1-6.
- [Google Scholar]
- Neoantigens and their potential applications in tumor immunotherapy. Oncol. Lett.. 2022;23:1-9.
- [Google Scholar]
- Fourcade, J., Sun, Z., Benallaoua, M., Guillaume, P., Luescher, I. F., Sander, C., Kirkwood, J.M., Kuchroo, V., Zarour, H.M.J.J.O.E.M., 2010. Upregulation of Tim-3 and PD-1 expression is associated with tumor antigen–specific CD8+ T cell dysfunction in melanoma patients. 207, 2175–2186.
- Tim-3 is an inducible human natural killer cell receptor that enhances interferon gamma production in response to galectin-9. Blood. 2012;119:3064-3072.
- [Google Scholar]
- Negative immune regulator Tim-3 is overexpressed on T cells in hepatitis C virus infection and its blockade rescues dysfunctional CD4+ and CD8+ T cells. J. Virol.. 2009;83(18):9122-9130.
- [Google Scholar]
- Tumor-infiltrating dendritic cells in cancer pathogenesis. J. Immunol.. 2015;194:2985-2991.
- [Google Scholar]
- Cooperation of Tim-3 and PD-1 in CD8 T-cell exhaustion during chronic viral infection. Proc. Natl. Acad. Sci.. 2010;107:14733-14738.
- [Google Scholar]
- Tim-3 expression defines a novel population of dysfunctional T cells with highly elevated frequencies in progressive HIV-1 infection. J. Exp. Med.. 2008;205:2763-2779.
- [Google Scholar]
- Deciphering the message broadcast by tumor-infiltrating dendritic cells. Am. J. Pathol.. 2012;181:733-742.
- [Google Scholar]
- Modulation of the immune response by heterogeneous monocytes and dendritic cells in lung cancer. World J. Clin. Oncol.. 2021;12:966.
- [Google Scholar]
- The tumour microenvironment harbours ontogenically distinct dendritic cell populations with opposing effects on tumour immunity. Nat. Commun.. 2016;7:1-17.
- [Google Scholar]
- Expression of the galectin-9-Tim-3 pathway in glioma tissues is associated with the clinical manifestations of glioma. Oncol. Lett.. 2016;11:1829-1834.
- [Google Scholar]
- Immunoregulation of dendritic cells by the receptor T cell Ig and mucin protein-3 via Bruton’s tyrosine kinase and c-Src. J. Immunol.. 2014;193(7):3417-3425.
- [Google Scholar]
- The role of tumor microenvironment in the pathogenesis of Sézary syndrome. Int. J. Mol. Sci.. 2022;23:936.
- [Google Scholar]
- Monney, L., Sabatos, C.A., Gaglia, J.L., Ryu, A., Waldner, H., Chernova, T., Manning, S., Greenfield, E.A., Coyle, A.J., Sobel, R.A.J.N., 2002. Th1-specific cell surface protein Tim-3 regulates macrophage activation and severity of an autoimmune disease. 415, 536–541.
- The tumour microenvironment of the upper and lower gastrointestinal tract differentially influences dendritic cell maturation. BMC Cancer. 2020;20:1-13.
- [Google Scholar]
- Tim-3 marks human natural killer cell maturation and suppresses cell-mediated cytotoxicity. Blood. 2012;119:3734-3743.
- [Google Scholar]
- Ngiow, S.F., Von Scheidt, B., Akiba, H., Yagita, H., Teng, M.W., Smyth, M.J.J.C.R., 2011. Anti-TIM3 antibody promotes T cell IFN-γ–mediated antitumor immunity and suppresses established tumors. 71, 3540–3551.
- Metabolism of dendritic cells in tumor microenvironment: for immunotherapy. Front. Immunol.. 2021;12:317.
- [Google Scholar]
- Elevated NF-κB activation in nonobese diabetic mouse dendritic cells results in enhanced APC function. J. Immunol.. 2002;168:188-196.
- [Google Scholar]
- Human dendritic cell subsets, ontogeny, and impact on HIV infection. Front. Immunol.. 2019;10:1088.
- [Google Scholar]
- Generation of mature dendritic cells from human blood An improved method with special regard to clinical applicability. J. Immunol. Methods. 1996;196:137-151.
- [Google Scholar]
- Emerging Tim-3 functions in antimicrobial and tumor immunity. Trends Immunol.. 2011;32:345-349.
- [Google Scholar]
- Breast cancer cells and PD-1/PD-L1 blockade upregulate the expression of PD-1, CTLA-4, TIM-3 and LAG-3 immune checkpoints in CD4+ T cells. Vaccines. 2019;7:149.
- [Google Scholar]
- Anti-PD-1 and anti-CTLA-4 therapies in cancer: mechanisms of action, efficacy, and limitations. Front. Oncol.. 2018;8:86.
- [Google Scholar]
- IL-21-mediated reversal of NK cell exhaustion facilitates anti-tumour immunity in MHC class I-deficient tumours. Nat. Commun.. 2017;8:1-14.
- [Google Scholar]
- Pronounce expression of Tim-3 and CD39 but not PD1 defines CD8 T cells in critical Covid-19 patients. Microb. Pathog.. 2021;153:104779
- [Google Scholar]
- Phosphatidylserine binding directly regulates TIM-3 function. Biochem. J.. 2021;478:3331-3349.
- [Google Scholar]
- Identification of a novel cell type in peripheral lymphoid organs of mice: I. Morphology, quantitation, tissue distribution. J. Exp. Med.. 1973;137:1142-1162.
- [Google Scholar]
- Inefficient presentation of tumor-derived antigen by tumor-infiltrating dendritic cells. Immunotherapy. 2008;57(11):1665-1673.
- [Google Scholar]
- Dendritic cell biology and its role in tumor immunotherapy. J. Hematol. Oncol.. 2020;13:1-18.
- [Google Scholar]
- Xu, L., Xu, J., Ma, S., Li, X., Zhu, M., Chen, S., Han, Y., Tang, X., Fu, Z., Qiu, H.J.O., 2017. High Tim-3 expression on AML blasts could enhance chemotherapy sensitivity. 8, 102088.
- Recent advances in the mechanisms of NLRP3 inflammasome activation and its inhibitors. Cell Death Dis.. 2019;10:1-11.
- [Google Scholar]
- miRNA-5119 regulates immune checkpoints in dendritic cells to enhance breast cancer immunotherapy. Cancer Immunol. Immunother.. 2020;69
- [Google Scholar]
- The history and advances in cancer immunotherapy: understanding the characteristics of tumor-infiltrating immune cells and their therapeutic implications. Cell. Mol. Immunol.. 2020;17:807-821.
- [Google Scholar]
- TNF-α-induced Tim-3 expression marks the dysfunction of infiltrating natural killer cells in human esophageal cancer. J. Trans. Med.. 2019;17:1-12.
- [Google Scholar]


