

Translate this page into:
Transportation of micro-polar fluid by dilating peristaltic waves
⁎Corresponding author. skpandey.apm@itbhu.ac.in (Sanjay Kumar Pandey),
-
Received: ,
Accepted: ,
This article was originally published by Elsevier and was migrated to Scientific Scholar after the change of Publisher.
Peer review under responsibility of King Saud University.
Abstract
In this paper, we analytically investigate axi-symmetric flow of a micro-polar fluid induced by peristaltic waves with progressively dilating amplitude. By means of mathematical formulation we examine its impact on swallowing of single food bolus through oesophagus. Liquid crystals, blood, some edible solutions resemble micro-polar property. Engineering applications using polymer solutions, colloidal solutions, drilling fluids in oil industries etc. may be better understood by this investigation. Long wavelength and low Reynolds number approximations are employed to get rid of non-linear convective terms and minimise curvature effects of the wall. It is inferred that increasing coupling number and amplitude dilation parameter enhance the pressure inside the tube, while micro-polar parameter is responsible for reducing the pressure along the axis of the tube. Local wall shear stress too increases with amplitude dilation parameter. The study suggests that achalasia patients should avoid the consuption of micro-polar fluids. It is also concluded that reflux action weakens with dilation of wave amplitude for micro-polar flows.
Keywords
Peristalsis
Oesophagus
Micro-polar fluid
Wave dilation parameter
Coupling number
Micro-polar parameter

1 Introduction
Combination of periodically alternating contractions and relaxations of muscles responsible for most of the physiological flows is peristalsis. This combination forms a transverse and progressive wave. This mechanism has several engineering applications. Several innovators, across various fields, are developing peristaltic machines that can move in cylindrical tubes to locate ruptures at the joints of gas and water pipelines and those caused by cracks. Many such machines are being designed to serve industries for sanitary fluid transport, blood pumps in heart/lung machines, transport of corrosive fluids without contacting machinery components. Studies are also focused on realization of machines that can pass through intestines and blood vessels. Peristalsis, observed in earthworms and nematodes, induces shape variation and a shift in the center of gravity. This causes extensional waves to propagate and thus progress without injury to the vulnerable inner walls of blood vessels. This moving mechanism together with catheters can reach a diseased site by itself (Nakazato et al., 2010).
Eringen (1966) formulated the effects of individual particles such as micro-rotation in flow, which are concentrated suspension of non-deformable neutrally buoyant rigid particles in a viscous medium. Micro polar fluids contain micro constituents which can undergo rotation. Rotation of micro constituents can affect the hydrodynamics of flow and make the fluid distinctly non-Newtonian. Physically, micro polar fluids represent fluids consisting of rigid, spherical or randomly oriented particles with ignored deformation suspended in a viscous medium (Lukaszewicz, 1999). Liquid crystals, blood, some edible solutions resemble micro-polar property. Engineering applications using polymer solutions, colloidal solutions, drilling fluids in oil industries etc. may be better understood by this investigation (Pandey and Tripathi, 2011a).
Devi and Devanathan (1975) studied peristaltic transport of micro-polar fluids in a cylindrical tube with a sinusoidal wave of small amplitude. Philip and Chandra (1995) explored peristaltic transport of a simple micro-polar fluid which accounts for micro-rotation and micro-stretching of the particles contained in a small volume element using long wave length approximations. Srinivasacharaya et al. (2003) examined different micro-polar properties on pressure across one wavelength and also on trapping; Hayat et al. (2007) investigated the effects of different wave forms; Muthu et al. (2005, 2008a, b) studied wall properties in channels and tubes respectively whereas Hayat and Ali (2008) investigated effects of an endoscope. The same authors (Ali and Hayat, 2008) studied the effects of asymmetricity of wave propagation of channel while Mekheimer and Elmaboud (2008) studied the flow in an annulus. Asghar et al. (2018) used micro-polar fluid to characterize the rheology of a thin layer of slime and its dominant micro-rotation effects. Recently some interesting papers dealing with the flow of micro-organisms such as bacteria and cilia driven flows under different conditions have been published (Ali et al., 2016; Asghar et al., 2017, 2018, 2019a; Asghar and Ali, 2019; Asghar et al., 2019b; Ali et al., 2019a; Asghar et al., 2019c; Ali et al., 2019b; Javid et al., 2019; Asghar et al., 2020a, b, c).
Unlike aforementioned authors, Pandey and Tripathi (2011a) investigated flow of a micro-polar fluid in a finite tube with the consideration that peristaltic waves do not move beyond the stationary boundary of the tube to match such a flow in oesophagus. Such a wave propagation was designed by Misra and Pandey (2001).
Pandey et al. (2017) concluded in their investigation that the wave amplitude does not remain constant during the wave propagation in a peristaltic motion when anything swallows in the oesophagus. The conclusion was derived in order to model the experimental reports of Kahrilas et al. (1995) who had located a higher pressure zone in the distal part of the oesophagus in normal as well as pathological state. Pandey and Tiwari (2017) further investigated swallowing of fluids that match the properties of Casson fluid, due to peristaltic waves of dilating amplitude.
In light of the observation of dilating peristaltic waves by Pandey et al. (2017) in oesophagus which validates experimental investigation, peristaltic swallowing of micro-polar fluids (Pandey and Tripathi, 2011a) requires a revisit of investigation. Particularly the impact of dilation of wave amplitude on the non-dimensional parameters such as coupling number and micro-polar parameter may be worth reporting.
2 Formulation of the problem
We consider the flow of micro-polar fluid in a tube of length of caused by continuous contraction waves that propagate along the walls of the tube (cf. Fig. 1), which are given by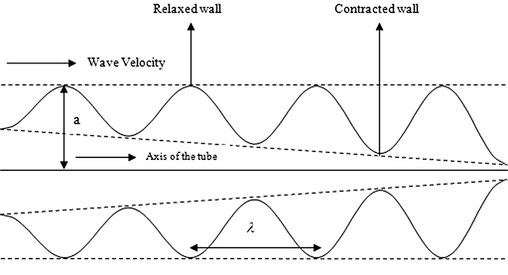
Schematic diagram of oesophagus (based on Eq. (16)) represents the propagation of a progressive wave, where , , denote respectively the wave number, the Reynolds number and the volume flow rate.
The governing equations of the flow of micro-polar fluid in the absence of body forces and body couple are given by
For details of the equations for micro-polar fluids, please see Asghar et al. (2018).
The following dimensionless parameters are introduced for the subsequent analysis:
Introduction of the dimensionless parameters gets Eqs. (2)–(5) transformed to
Employing the long wavelength and low Reynolds number approximations, the dimensionless Eqs. (8)–(11) reduce to
Similarly the wall Eq. (1), under non-dimensionalisation reduce to
The following are the boundary conditions imposed on the governing equations:
3 Solution of the problem
Integration of Eq. (13), once with respect to, yields
Further, integrating Eq. (15) twice with respect to and also using Eq. (19), we obtain non-homogeneous Bessel equation in the cylindrical coordinates as
The general solution of above equation is as follow:
Then applying the fourth boundary condition of Eq. (17), and the boundary conditions (18), Eqs. (19) and (20) become
And further integrating Eq. (21) and applying the no-slip condition of Eq. (17), the axial velocity is found as
The radial velocity is derived from Eq. (15), by substituting from Eq. (23) and integrating it once with respect to. The regularity condition, given in Eq. (17), determines the constant term and gives the radial velocity as
In order to get pressure gradient, we apply the radial velocity of the wall, given in Eq. (17), on Eq. (24). This gives
Integrating this, with respect to , yields the pressure gradient as
Integrating it once again from to , the pressure is obtained as
Substituting in Eq. (27), the pressure between the inlet and the outlet of the tube, is obtained as
The volume flow rate is defined as, yields, on performing the integration, the following:
The time-averaged volume flow rate is obtained by averaging the volume flow rate for one time period. This gives
The time-averaged volume flow rate may be given in terms of the flow rate in the wave frame, and also in the laboratory frame, as
This helps us express the pressure gradient in terms of the time-averaged volume flow rate. With some manipulations Eqs. (30) and (32) give
which yields, on integration, pressure difference in terms of the time-averaged volume flow rate as
for , which gives
Finally, the local wall shear stress is defined as
Which, by virtue of Eq. (21), takes the form
and further reduces, in view Eq. (26), to
4 Reflux limit
Reflux is an important phenomenon of peristaltic movement and refers to the presence of fluid particles that move, on the average, in a direction opposite to the net flow in the close vicinity of the wall (Shapiro et al., 1969).
For the axi-symmetric case, the dimensional form of the stream function in the wave frame is defined as
Using the following transformations between the wave and the laboratory frames, defined as
Stream function at the wall, is solved from Eq. (39) by substituting. A simplification yields
Reflux flow rate, associated with a particle at the position is given by
which, on averaging over one cycle, gives
Moreover, in order to evaluate the reflux limit, is expanded in a power series, in terms of a small parameter about the wall, where is subjected to the reflux condition
The coefficient of the first two terms in the expansion of is obtained only for small values of . Substituting the expansion into equations (39), and using equations (40), we get
Then integrating Eq. (41) with respect to and using Eqs. (42)–(45), we obtain the reflux limit (i.e. The occurrence of the reflux) as
5 Results and discussion
In order to explore the effects of various parameters such as coupling number, micro-polar parameter, wave amplitude dilation parameter and the wall shear stress on swallowing of micro-polar fluid, we plot graphs for local pressure distribution along the axis. In order to examine the contribution exclusively of peristalsis, pressure of zero magnitude is prescribed at the two ends of the oesophagus, which makes . At a particular time, only one bolus moves in the oesophagus, which is easily experienced when a non-Newtonian fluid swallows. Therefore, for analysis, we consider a single bolus swallowing in the tube which has the capacity to accommodate three boluses at a time, so far our discussion is concerned.
The fundamental motive is to study the local pressure distribution along the axis when a bolus travels down the oesophagus towards the cardiac sphincter. Since the mathematical model involves expressions that cannot be integrated by classical methods, the only way out is to go for numerical evaluation. Moreover, the values of all the non-dimensional parameters are merely suitable assumptions to facilitate qualitative investigation.
5.1 Effect of dilating wave amplitude on pressure
The bolus is supposed to be already there in the tube at. Dashed line symmetric about the axis of the tube are drawn to indicate the position of the bolus in the direction left to right. Fall of pressure from the left towards right paves way for the bolus to move in the tube. Different inclinations of the pressure curve indicate different pressure gradients of the corresponding part of the bolus. Its gradual rise from the head of the bolus to the end of the tube is the revelation that the motion is under control; the bolus is never let move freely.
The effect of dilating wave amplitude on the flow dynamics is plotted in Fig. 2. We fix the various parameters as, and let vary. Fall and rise of pressure throughout the length of the tube from to in the plots is observed to be dependent on the wave amplitude, corresponding to the constant amplitude (Fig. 2). Variation between the maximum and the minimum pressures becomes larger when the wave-amplitude dilates, e.g., when, (Fig. 2). An observation of Fig. 2(a-f) reveals that pressure gradients, corresponding to and, are larger in magnitude in the lower oesophageal part than that in the upper oesophageal part and also, if we measure the magnitude, the pressure rises more in the lower part of the oesophagus. It conforms the experimental observations of high pressure zone in the lower oesophageal part even when the fluid transported is of micro-polar nature (Kahrilas et al., 1995).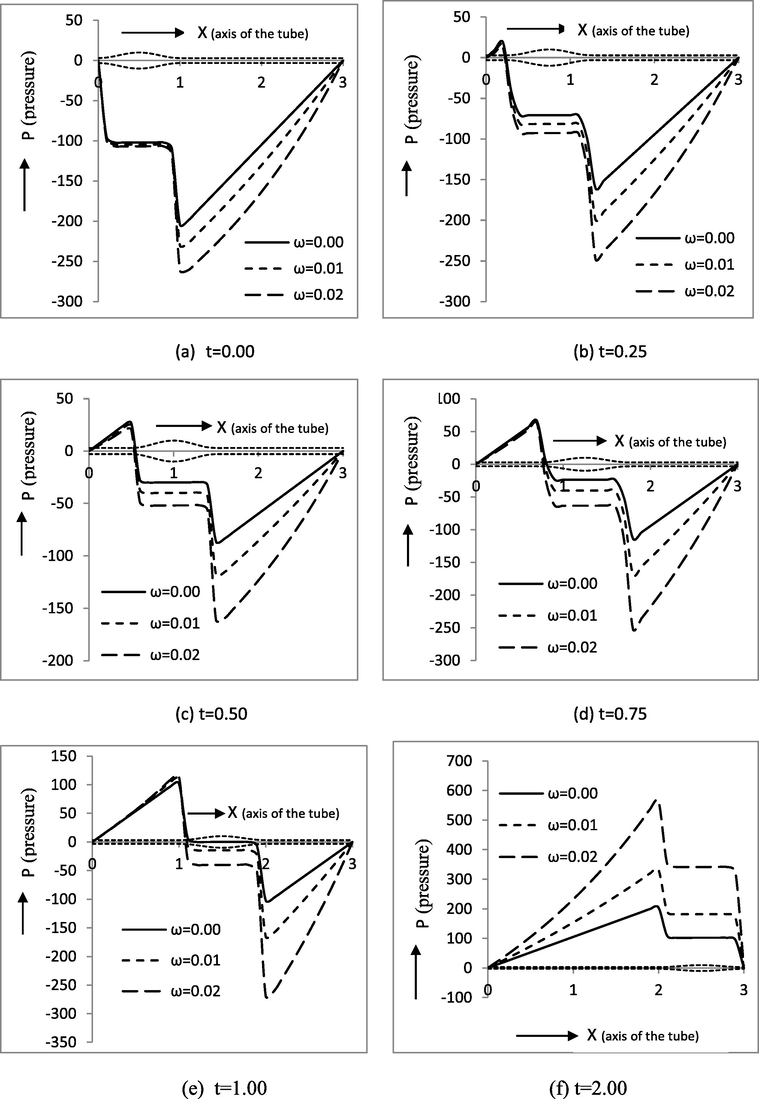
Pressure distribution along axial distance at different time instants showing the effect of dilation parameter. Other parameters are taken as.
5.2 Effect of coupling number on pressure
Plots in Fig. 3 depict the impact of the coupling effect parameter, a measure of particle coupling with its surroundings, on pressure distribution along the axis of the tube. We set the various parameters as, and let vary in the range 0–0.75.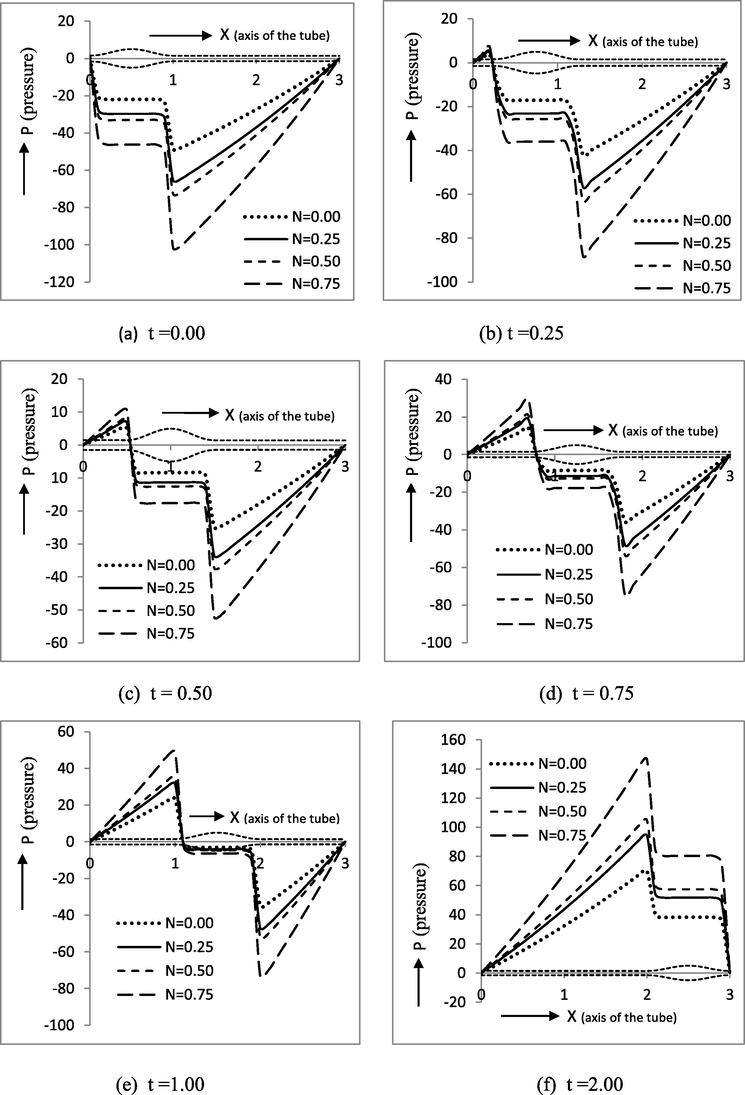
Pressure distribution along axial distance at different time instants showing the effect of coupling number. Other parameters are set as .
It is observed that pressure gradient as well as pressure along the length of the oesophagus increases as the coupling effect parameter increases throughout the length of the tube. This may be physically interpreted as that internal rotation of the fluid particles increases pressure; and finally the fluid reduces to Newtonian, i.e. as , pressure is minimum. This leads to the conclusion that physically the oesophagus has to make additional efforts to swallow a micro-polar fluid. Similar is the observation for all values of ranging from , i.e., throughout swallowing. Temporal effects are similar to those observed for other fluids such as Newtonian, power-law, visco-elastic, visco-plastic and magneto hydrodynamic fluids (Misra and Pandey, 2001; Pandey and Tripathi, 2010). Figures, together with captions, provide the details (cf. Fig. 3). Achalasia causes inadequate lower oesophageal sphincter relaxation; as a consequence of which oesophageal clearance is delayed. A possible treatment of patients with inadequate lower oesophageal sphincter relaxation is through drugs or by operation (Spechler and Castell, 2001). Thus, this problem will be more acute if the fluid is micro-polar.
5.3 Effect of micro-polar parameter on pressure
Our next analyse the role of the other micro-polar parameter by setting other parameters, and vary in the range 1.0–5.0. It is noticed that the pressure along the entire length of the tube decreases as increases. Hence, this parameter has an opposite effect vis-à-vis coupling number (cf. Fig. 3). Since no value of can lead to Newtonian nature, no comparison can be made with Newtonian fluids. In fact, the micro-polar fluid has a complicated characteristic that is built up by the combined effects of several parameters. This may be recorded that once vanishes, no longer exits (cf. Fig. 4 ).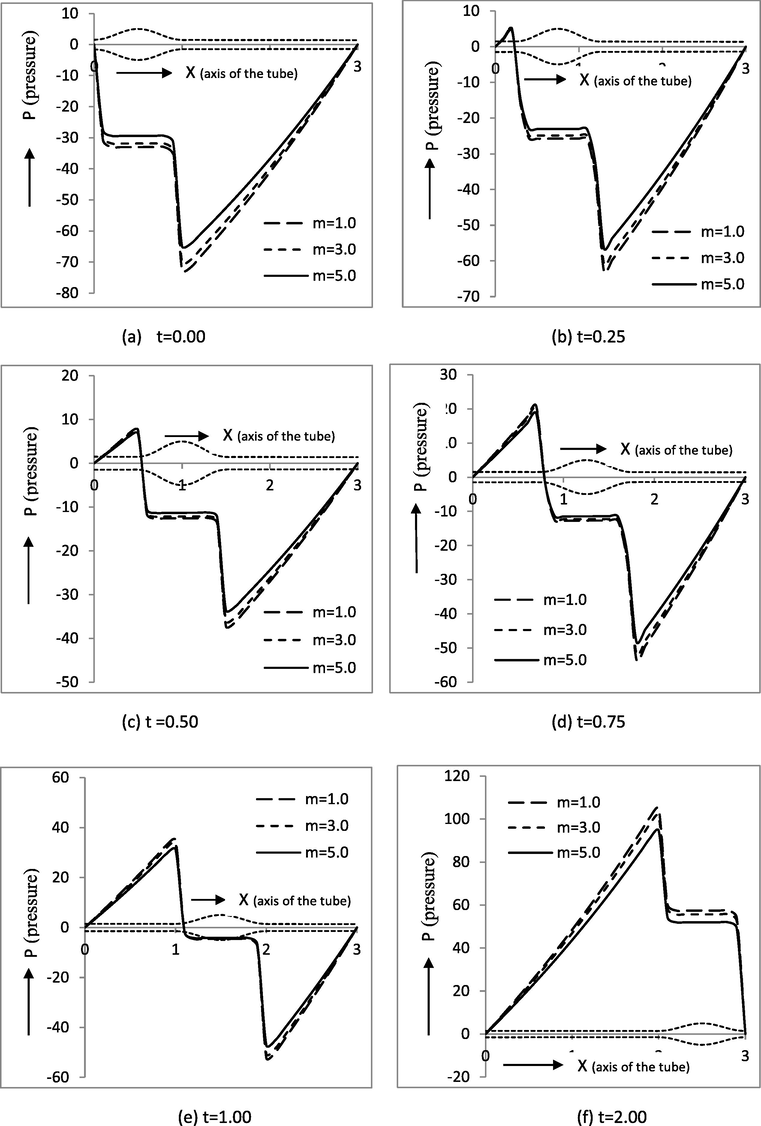
Pressure distribution along axial distance at different time instants showing the effect of micro polar parameter. Other parameters are taken as.
5.4 Effect of dilating wave amplitude on wall shear stress
Fig. 5 depict the temporal effects of dilating wave amplitude on wall shear stress along the length of the tube for distinct values of. It is observed that the local wall shear stress increases with the dilating wave amplitude . We found that the bolus felt more stress, more than double, at instead of. Therefore, in the lower part of the oesophagus, bolus will experience higher pressure to transport the bolus in the human oesophagus. Due to the high stress, the size of bolus looks shrunk in the lower part of the human oesophagus (Kahrilas et al., 1995).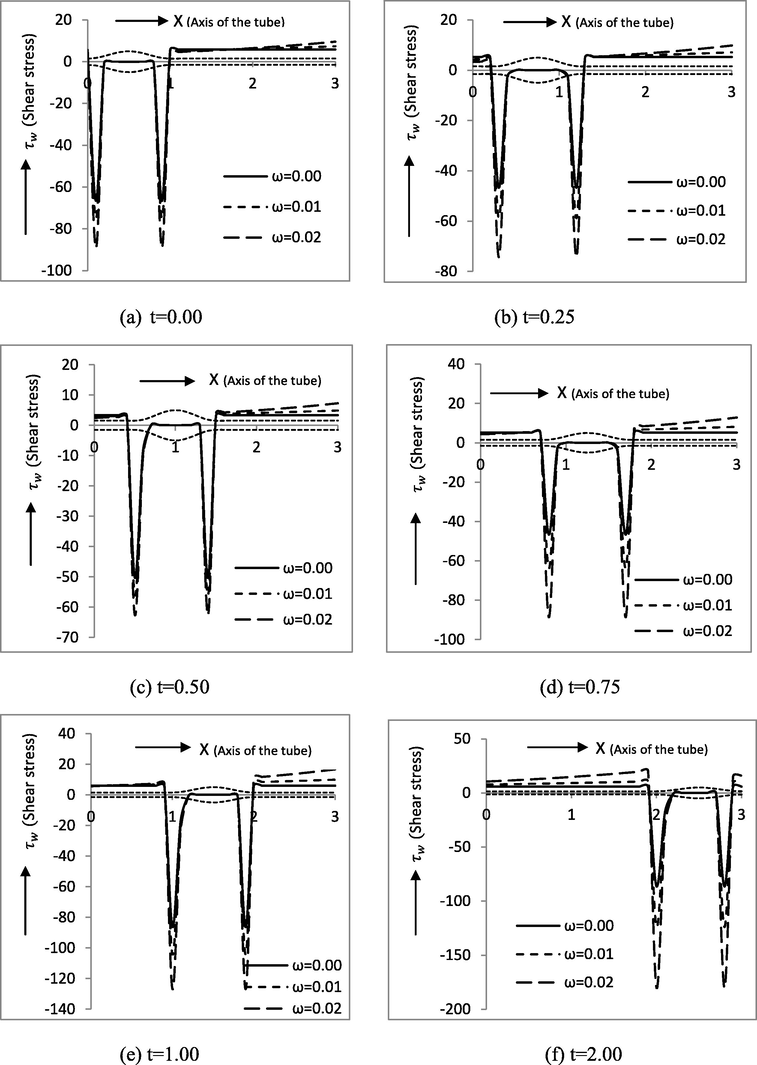
Wall shear stress distribution along axial distance at different time instants showing the effect of dilation parameter. Other parameters are taken as.
6 Effect of dilating wave amplitude on reflux
Flow rate enhances when wave amplitude is increased. Shapiro et al. (1969) discovered retrograde motion corresponding to a given wave amplitude. Less flow rate across a cross section than that across a smaller area within the same cross section is an indication of retrograde motion. In such a case, some fluid flows in the opposite direction near the tubular wall. Consequently, the amount of flow diminishes. This is because close to the inner the periphery, flow is in the reverse direction diminishing the net flow as expected. The flow rate, beyond which there is no reflux, was termed as reflux limit. For small and large amplitudes, Shapiro et al. (1969) used different perturbation techniques to estimate the limits.
The analysis for large amplitude and high flow rates has been carried out. Pandey and Tripathi (2011b) observed that micro-polar fluids are more prone to reflux. The curves representing reflux limits for micro-polar fluids are higher compared to that of Newtonian fluid, for low flow rates. In order to examine the role of dilating amplitude, we fix the coupling number and micro-polar parameter as , and then vary the dilating parameter by plotting the time averaged flow rate against wave amplitude. The curves indicate that as the amplitude increases more flow rateis required for reflux to take place. We further observe that the curve corresponding to reflux limit rises as wave amplitude is augmented with the dilating parameter of higher magnitude (Fig. 6), clearly indicating that reflux actions weakens with dilating wave amplitude. Only higher flow rates may cause reflux. Thus, dilating wave amplitude saves flow from retrograde motion in the oesophagus.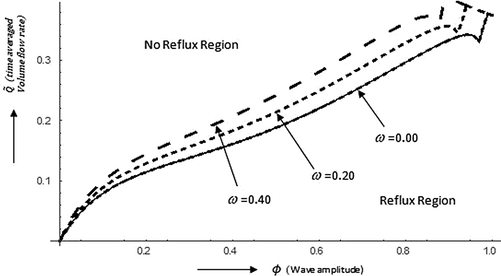
The diagram exhibits the relation between time averaged flow rate and wave amplitude showing the effect of dilation parameter on reflux limit. Other parameters are taken as .
7 Conclusion and physical interpretation
The objective of this analysis is to learn the effect of dilating wave amplitude on the non-Newtonian nature of fluid, which is swallowed in the oesophagus. Here, the non-Newtonian nature is characterized by the micro-polar parameter and coupling number. These characteristics give it the name micro-polar fluid. It is found that the presence of coupling number and micro-polar parameter requires more pressure to be exerted by the wall of the oesophagus on the fluid swallowing inside it. Dilating wave amplitude increases it further. This confirms the experimental observations (Kahrilas et al., 1995) of high pressure zone in the lower part of the oesophagus.
The micro-polar and Newtonian fluids have qualitatively similar pressure distributions; but differences in magnitudes are very much significant. The acknowledgment is that coupling number and dilation parameter increase pressure along the entire length of the oesophagus, while the other micro-polar parameter decreases it.
It is observed that for exponentially increasing wave-amplitude, pressure increases along the entire length of the oesophagus; and finally towards the end of the oesophageal flow, it is at the peak. It is found that the pressure distribution is dependent on the position of the wave that propagates in the oesophagus. The local rate of change in the pressure difference is much greater when the wave originates at the inlet and terminates at the outlet of the oesophagus than when the wave lies midway. This may be associated to the fact that the pumping action does not take place along the entire length of the oesophagus uniformly. The rate of change is higher in the proximity of the inlet and the outlet. This present investigation prohibits feeding of micro-polar fluids to the patients suffering from achalasia.
It is also concluded that for the non-Newtonian micro-polar fluids, reflux is less probable with increasing amplitude and further augmented by the dilation parameter.
Acknowledgement
The second author, Subhash Chandra, is grateful to University Grants Commission (UGC), New Delhi, India for awarding Senior Research Fellowship under the SRF schemes (grant ref. No. 17-06/2012(i) EU-V with Sr. No. 2061241060) during this investigation.
Declaration of Competing Interest
The authors declare that they have no known competing financial interests or personal relationships that could have appeared to influence the work reported in this paper.
References
- Peristaltic pumping with long wavelengths at low Reynolds number. J. Fluid Mech.. 1969;35:669-675.
- [Google Scholar]
- Peristaltic transport of a simple micro fluid. Proc. Nat. Acad. Sci. India. 1995;65(A):63-74.
- [Google Scholar]
- Peristaltic transport of a micro-polar fluid in a tube. Acta Mech.. 2003;161:165-178.
- [Google Scholar]
- Peristaltic motion of micro-polar fluid. Proc. Indian Acad. Sci.. 1975;81(A):149-163.
- [Google Scholar]
- Micropolar Fluids Theory and Applications. New York: Springer Science+Business Media; 1999.
- A mathematical model for oesophageal swallowing of a food-bolus. Math. Comput. Modell.. 2001;33(8-9):997-1009.
- [Google Scholar]
- Rheological and magnetic effects on a fluid flow in a curved channel with different peristaltic wave profiles. J. Braz. Soc. Mech. Sci. Eng.. 2019;41(11)
- [CrossRef] [Google Scholar]
- The influence of a micropolar fluid on peristaltic transport in an annulus: application of the clot model. Appl. Bionics Biomech.. 2008;5(1):13-23.
- [Google Scholar]
- Peristaltic flow of a micropolar fluid in an asymmetric channel. Comput. Math. Appl.. 2008;55(4):589-608.
- [Google Scholar]
- Bacterial gliding fluid dynamics on a layer of non-Newtonian slime: perturbation and numerical study. J. Theor. Biol.. 2016;397:22-32.
- [Google Scholar]
- A hybrid numerical study of bacteria gliding on a shear rate-dependent slime. Phys. A. 2019;535:122435.
- [CrossRef] [Google Scholar]
- Biological interactions between Carreau fluid and microswimmers in a complex wavy canal with MHD effects. J. Braz. Soc. Mech. Sci. Eng.. 2019;41(10)
- [CrossRef] [Google Scholar]
- On the influence of wall properties in the peristaltic motion of micropolar fluid. ANZIAM J.. 2003;45(2):245-260.
- [Google Scholar]
- Peristaltic motion of micropolar fluid in circular cylindrical tubes: effect of wall properties. Appl. Math. Model.. 2008;32(10):2019-2033.
- [Google Scholar]
- A study of micropolar fluid in an annular tube with application to blood flow. J. Mech. Med. Biol.. 2008;08(04):561-576.
- [Google Scholar]
- Attenuation of oesophageal shortening during peristalsis. Gastroenterology. 1995;109:1818.
- [Google Scholar]
- Peristaltic flow characteristics of Maxwell and magneto hydrodynamic fluids in finite channels: models for oesophageal swallowing. J. Biol. Syst.. 2010;18:621-647.
- [Google Scholar]
- A mathematical model for peristaltic transport of micro-polar fluids. Appl. Bionics Biomechanics. 2011;8(3-4):279-293.
- [Google Scholar]
- Unsteady peristaltic flow of micro-polar fluid in a finite channel. Z. Naturforsch. A. 2011;66a:181.
- [CrossRef] [Google Scholar]
- Variation of pressure from cervical to distal end of oesophagus during swallowing: study of a mathematical model. Math. Biosci.. 2017;288:149-158.
- [Google Scholar]
- Swallowing of Casson fluid in oesophagus under the influence of peristaltic waves of varying amplitude. Int. J. Biomath.. 2017;10(02):1750017.
- [CrossRef] [Google Scholar]
- Peristaltic flow of a micro-polar fluid in channel with different wave forms. Phys. Lett. A. 2007;370:331-334.
- [Google Scholar]
- Effects of an endoscope on peristaltic flow of a micropolar fluid. Math. Comput. Modell.. 2008;48(5-6):721-733.
- [Google Scholar]
- Development of an in-pipe micro mobile robot using peristalsis motion. J. Mech. Sci. Technol. 2010;24(1):51-54.
- [Google Scholar]
- Interaction of gliding motion of bacteria with rheological properties of the slime. Math. Biosci.. 2017;290:31-40.
- [Google Scholar]
- Mechanical effects of complex rheological liquid on a microorganism propelling through a rigid cervical canal: swimming at low Reynolds number. J. Braz. Soc. Mech. Sci. & Eng.. 2018;40(475):1-16.
- [Google Scholar]
- Analytical and numerical study of creeping flow generated by active spermatozoa bounded within a declined passive tract. Eur. Phys. J. Plus. 2019;134(1)
- [CrossRef] [Google Scholar]
- A mathematical model of the locomotion of bacteria near an inclined solid substrate: effects of different waveforms and rheological properties of couple-stress slime. Can. J. Phys.. 2019;97(5):537-547.
- [Google Scholar]
- Magnetic microswimmers propelling through biorheological liquid bounded within an active channel. J. Magn. Magn. Mater.. 2019;486:165283.
- [CrossRef] [Google Scholar]
- A mathematical framework for peristaltic flow analysis of non-Newtonian Sisko fluid in an undulating porous curved channel with heat and mass transfer effects. Comput. Methods Programs Biomed.. 2019;182:105040.
- [CrossRef] [Google Scholar]
- An implicit finite difference analysis of magnetic swimmers propelling through non-Newtonian liquid in a complex wavy channel. Comput. Math. Appl.. 2020;79(8):2189-2202.
- [Google Scholar]
- Cilia-driven fluid flow in a curved channel: effects of complex wave and porous medium. Fluid Dyn. Res.. 2020;52(1):1-21.
- [Google Scholar]
- Bio-inspired propulsion of micro-swimmers within a passive cervix filled with couple stress mucus. Comput. Methods Programs Biomed.. 2020;189:105313.
- [CrossRef] [Google Scholar]


