

Translate this page into:
Trace identification of endocrine-disrupting bisphenol A in drinking water by solid-phase extraction and ultra-performance liquid chromatography-tandem mass spectrometry
⁎Corresponding author. mrkhan@ksu.edu.sa (Mohammad Rizwan Khan)
-
Received: ,
Accepted: ,
This article was originally published by Elsevier and was migrated to Scientific Scholar after the change of Publisher.
Peer review under responsibility of King Saud University.
Abstract

Abstract
Bisphenol A (BPA) has been recognized as an endocrine disruptor, found in numerous products for instance water bottles, food cans and baby bottles. In this investigation, an improved method based on solid-phase extraction (SPE) and ultra-performance liquid chromatography-tandem mass spectrometry (UPLC-MS/MS) was optimized for the extraction and identification of BPA in polyethylene terephthalate (PET) and glass bottled drinking water samples of diverse trademarks and origin. The extraction of BPA was carried out using Bond-Elut-C18 SPE cartridge without any further purification of the sample extracts. Under the most favorable extraction parameters, the system has revealed excellent linearity with correlation coefficient (R2 > 0.999), limit of detection (0.01 µg/L), limit of quantification (0.04 µg/L) and precision in terms of intra- and inter-day, providing relative standard deviation (RSD%) values <1% (n = 5) and <3% (n = 5), respectively. The optimized system was applied for the analysis of BPA in drinking water samples, which showed that PET bottled samples contain lower amounts of BPA ranged from 0.29 µg/L to 24.88 µg/L, whereas glass bottled samples contain higher amounts of BPA ranged from 4.34 µg/L to 41.19 µg/L. The adequate recovery values were obtained between 96.81% and 99.77% in both type of samples.
Keywords
Bisphenol A
Drinking water
Polyethylene terephthalate bottle
Glass bottle
SPE
UPLC-MS/MS

1 Introduction
Owing to the human activities, many chemicals are introduced into the surroundings everyday which can disorder human endocrine system (Rubin, 2011; Kabir et al., 2015; Murphy et al., 2019). The implications of such distraction can be very much intense due to vital role that hormones show in regulatory human growth. As hormones disturb the cell and reproduction growth, and most likely modify the threat of the initiation of cancer formation (Rubin, 2011; Kabir et al., 2015). Among those chemicals, BPA has been recognized as a potential endocrine disruptor (Rubin, 2011). BPA is industrialized compound, applied for the manufacturing of polycarbonate plastic, polymers and epoxy resins for coatings in pipes and food tin cans (Liu et al., 2019; Peng et al, 2019; Wu et al., 2019; Gallart-Ayala et al., 2011). The consumption of polluted foodstuff including drinks are the main pathway of the BPA exposure to human beings (Nomiri et al., 2019). The maximum amounts of BPA have conjugated to produce two types of compounds for instance BPA-sulfates and BPA-glucuronides which are frequently excreted through urine (Nomiri et al., 2019). BPA exposure to human beings has extensive sort of adversative health problems (Johanna, 2013) and in the meantime it is the matter of great concern (Moghadam et al., 2015; Le et al., 2008). BPA has also recognized to disorders cell differentiation and distract the cellular antioxidant mechanisms (Kotchkiss et al., 2008). Besides, BPA has also identified to have lipophilic characteristics and thus has ability to accumulate in the fat supplies (Vandenberg et al., 2007). In association to the woman pregnancy and their reproductive fitness, the occurrence of BPA has been associated with many symptoms including miscarriages, preeclampsia, reduced gestation size, child anthropometric measures at delivery (Pinney et al., 2017; Kolatorova et al., 2017). Due to its destructive effects, BPA has been forbidden in baby feeding bottles in many countries including European Union, Canada and Denmark (European Union (EU), Directive 2002/72/EC). The European Food Safety Authority Agency of the EU has suggested to limit the concentration up to 50 µg/kg in the materials come into contact with food products (European Food Safety Authority (EFSA), 2015). Later on, EFSA has again investigated the BPA toxicity problems and exposure, and reduce the suggested ingestion to 4 μg/kg. Investigations have reported the presence of BPA in biological, environmental and food samples for instance plasma and urine (González et al., 2019), fat and blood (Wang et al., 2015), sewage sludge and wastewater (Banihashemi and Droste, 2013), indoor dust (Jingchuan et al., 2016), sediments (Liao et al., 2012), soft drinks and canned foods (Peng et al., 2019).
Due to low level of BPA occurrence in water samples, SPE technique has been widely applied for the extraction and clean-up purposes (Van Leeuwen et al., 2009). Several other methods for instance immunoaffinity column (Wang et al., 2017), fluorimetric (Lim et al., 2018), excitation-emission matrix fluorescence (Chen et al., 2019), solid-phase microextraction (SPME) (Polo et al., 2006) and QuEChERS (Dualde et al., 2019) have also been stated for the extraction of BPA from different matrices. Usually, in combination with SPE or SPME, the liquid chromatography-mass spectrometry (LC-MS) (Van Leeuwen et al., 2009; Wang et al., 2017; Lim et al., 2018; Chen et al., 2019; Polo et al., 2006) and gas chromatography-mass spectrometry (GC–MS) systems are frequently applied for the study of bisphenol A in such type of matrices (Fromme et al., 2002; Zafra et al., 2003). The LC–MS has been widely applied as an alternative method in current years for the determination of BPA (Gallart-Ayala et al., 2010a, 2010b) in various samples. Among these applied extraction methods, usually they are either used in mixed mode or required high consumables, organic solvents and lengthy steps. Concerning the ecological fate and the changing actions of BPA, it is indispensable to develop a faster, simple and common analytical technique for water samples. The objective of the present investigation was to develop a rapid, sensitive and selective analytical technique (SPE and UPLC–MS/MS) for the analysis of BPA in PET and glass bottled drinking water samples. Method performance in terms of linearity, sensitivity, precision, selectivity and recovery values were evaluated. Finally, the develop method was effectively applied to the analysis of BPA in real water samples which was found to be economical, faster and low organic solvent consumption and can be applied for the routine analysis of BPA in drinking water samples.
2 Materials and methods
2.1 Materials
Bisphenol A (purity, ≥99%), formic acid (purity, ≥95%) and solvents (methanol, acetonitrile, ethyl acetate and dichloromethane) were either reagent or LC–MS grade, purchased from Sigma-Aldrich (Missouri, USA). Ammonia solution (25%) and sodium hydroxide were obtained from Panreac Química (Barcelona, Spain) and BDH Laboratory Supplies (Poole, UK), respectively.
For SPE method, Bond Elut C18 (500 mg, 3 mL) (Agilent Technologies, Santa Clara, USA), Oasis® Max 3 cc (60 mg) and Oasis® HLB 3 cc (60 mg) (Waters Corporation, Milford, USA) extraction cartridges were obtained. The extraction column (Extrelut NT20) were achieved from Merck (Darmstadt, Germany). The cartridge connecter parts and stopcocks were supplied from Varian (Harbor City, USA).
The ultrapure water was obtained from Milli–Q water purification system (model advantage A10, Millipore Corporation, Bedford, USA). Sample pH was measured using pH meter model Orion 2 star (Thermo Scientific, Singapore). The sample extraction and evaporation were carried out by vacuum manifolds Visiprep™ and Visidry™ (Supelco, Gland, Switzerland). Sample mixing was performed using vortex mixer Stuart™ model SA8 (Fisher Scientific, Göteborg, Sweden). The standards and samples filtration were performed on mini centrifuge (Cole Parmer, Seoul South Korea) using ultrafree® centrifugal polyvinylidene fluoride (PVDF) filters of pore size 0.22 µm (Millipore Corporation, Billerica, USA).
BPA stock solution (100 µg/mL) was prepared in methanol and water (50:50, v/v), used for dilutions of additional standard solutions. To establish the linearity and preparation of calibration curve of the system, eight individual standard solution of BPA at concentrations range (1, 5, 10, 20, 40, 60, 80, and 100 µg/L) were prepared by weight to volume.
3 Samples
PET and glass bottled water samples of diverse trademarks and origin were purchased from local markets, Riyadh, Saudi Arabia. They were purchased between the periods of September and October 2018. To avoid any microbial contagion, the samples were immediately refrigerated at 4 °C and investigated within a week time.
4 Sample preparation
The preparation of samples was performed in consideration with safety measures to reduce sample adulteration. Materials including glassware and plastics were cleaned with methanol and MilliQ water to evade any sample contamination through BPA. With the aim of BPA extraction from water samples, the subsequent SPE technique was applied. The refrigerated water sample was taken out to attain the room temperature, after that the 50 mL sample was taken out in a clean glass beaker. After that, the sample was placed to an empty extraction column (Extrelut NT20) linked to SPE cartridge Bond Elut C18 (500 mg, 3 mL), which was previously preconditioned with MilliQ water (5 mL) and methanol (5 mL). The water samples were passed through Bond Elut C18 at precise flow speed of 1 mL/min. Once the water samples was completely eluted, the Bond Elut C18 column was washed with 10 mL of aqueous and organic mixture solution (methanol 50%/water 50%, v/v) followed by drying under vacuum for 5 min. The adsorbed BPA was eluted from column using 6 mL mixture of methanol (98%) and ammonia (2%). The eluted extract was dried using nitrogen gas of high purity followed by dissolvation with a 1 mL mixture of methanol (50%) and water (50%). The sample was vortexed and filtered through PVDF filters of pore size 0.22 µm and then moved to chromatographic vials for UPLC-MS/MS analysis.
To assess the BPA concentration, quantitative analysis method based on standard addition technique was applied which reduces the matrix influences that obstruct with compound measurement signals. This is carried out with two unspiked (0 levels) and three spiked levels (50%, 100% and 500%) of the samples. The recovery values were assessed from the slope of the linear regression acquired between the precise added BPA concentration and the determined BPA concentration. In addition, after every sample analysis, a quality control and blank samples were also analyzed to be promise that samples adulteration did not take place and the sensitivity of the MS detection was stable throughout the instrumental investigation. Entire samples were examined in triplicates.
5 Uplc–Ms/Ms
Sample analysis was carried out on a Waters Acquity® ultra-performance liquid chromatographic (UPLC) system (Milford, USA), attached to an electrospray ionization (ESI) source and a triple quadrupole mass spectrometer (MS/MS) (Waters, Micromass, Milford, USA).
The chromatographic separation was performed on a reversed phase Waters Acquity® BEH C18 column (Milford, USA) of particle size 1.7 µm and dimension 5 cm × 0.21 cm i.d. The ideal BPA separation was carried out using mobile phase in isocratic elution method. The mobile phase consists of methanol (80%) and water (20%) at flow speed of 200 µL/min., and the column was installed at room temperature. The sample was injected at volume of 5 µL, and analyzed for 2 min. At every ten sample analysis, the column was cleaned with water (50%) and methanol (50%) mixture.
The mass spectrometric system was functioned in negative ESI mode and data attainment was accomplished in Multiple Reaction Monitoring (MRM) method. The ion transmission of MS/MS and their fragmentation conditions were studied through the infusion of BPA standard solution (10 µg/mL) in combined mode. The main analyte BPA was studied as a precursor ion [M−H]− (m/z: 227.29) and two product ion transitions (m/z: 133.14) and (m/z: 212.12). The most intense ion was used as quantification whereas other one used as confirmation purposes. The system was operated under the subsequent precise parameters: voltages (capillary, 3.5 kV and cone, 25 V), temperatures (source, 120 °C and desolvation, 350 °C), and gases (desolvation 600 L/h and cone, 60 L/h). For cone gas nitrogen of high purity was used, achieved from nitrogen generator (Peak Scientific, model NM30LA, Inchinann, UK), however for collision gas, high purity argon of was used, attained from Speciality Gas Centre (Jeddah, Saudi Arabia). The system vacuum was produced by a rotary pump, model SOGEVAC SV40BI (Oerlikon, Paris, France). The MRM parameters applied with MS/MS system has been illustrated in Table 1. During analysis, the BPA data was attained through Waters MassLynx V4.1 program (Milford, USA).
Analyte
Precursor ion (m/z)
Quantification
Confirmationb
Product ion (m/z)
Collision energy (eV)
Product ion (m/z)
Collision energy (eV)
BPA
227.29
133.14
30
212.12
26
6 Method validation and statistical studies
A complete method validation was carried out on the proposed technique established on the earlier guidelines (The Fitness for Purpose of Analytical Methods, 2014) and the European Commission creating methods and criteria for the methods validation to make certain the comparability and quality of outcomes produced by authorized analytical research centers (European Commission Decision (2002)/657/EC of 12 2002). Statistical study was performed by the analysis of variance (ANOVA) in excel, a statistical process applied to assessment variances between two or additional means. The obtained results are demonstrated as the mean ± standard deviation.
7 Results and discussion
7.1 Optimization of UPLC–MS/MS
Lately, liquid chromatography–tandem mass spectrometry (LC-MS/MS) has been known as one of the ultimate separation and detection system in environmental, food and pharmaceutical studies owing to its excellent sensitivity and selectivity for an extensive group of substances (Barceló and Petrovic, 2015; Malik et al., 2010). Based on similar principles, later on an ultra-fast separation technique UPLC has been invented which allows the faster analysis of smaller compounds proficiently (Swartz, 2005). Thus, the optimization of such type of rapid and high throughput system for the identification of BPA is of great prominence, nevertheless, BPA is present at very low level in the water samples. To achieve the finest Gaussian peak of BPA, primarily, a number of columns were applied which contain hydrophobic C18 and C8 stationary phases and hydrophilic amide group stationary phase (hydrophilic interaction liquid chromatography). About mobile phases, aqueous (water), organic (acetonitrile and methanol) or mixture of aqueous and organic were investigated in isocratic mode at flow speed between 100 µL/min and 500 µL/min. The influence of the organic acid (formic acid) modifier in mobile phase between 0.1% and 1% was also studied. The sample injection volume was 5 µL in all cases. From the investigated columns at different mobile phases, the C18 with mobile phase (methanol 80% and water 20%) at flow speed of 200 µL/min has offered peak with excellent symmetry together with short BPA elution time (<1 min) despite putting on the lower flow rate of mobile phase. The applied column Acquity® BEH C18 containing low sized particle had offered great advantage of applying mobile phase flow rate from lower to the higher level, even column efficiency does not decrease at higher flow rate of the mobile phase. The optimized UPLC conditions has been described in previous section.
Nonetheless, the other columns (hydrophilic interaction liquid chromatography and C8) at varied mobile phases, revealed inadequate outcomes for example poor peak symmetry, longer BPA elution time and, peak split and tailing. In order to improve the peak quality, the formic acid as a modifier was also added in the mobile phase at different proportion (0.01–1%, v/v) but does not presented any further improvement in superiority of the peak. Thus, the column Acquity® BEH C18 was chosen for the analysis of real samples.
To acquire good ion signal of BPA, initially, the optimization of the mass spectrometric conditions was performed by the infusion of BPA standard solution in methanol (10 µg/mL). Under these circumstances, ionic evaporation effectiveness was low and poor responses were acquired. So as to resolve this problem, 0.01% of acetonitrile was added in combined infusion mode which favor the formation of precursor ions, and as a result rising the ion intensity of the studied compound. In previous study, the authors have used the acetonitrile while optimizing the MS system and showed that the acetonitrile favored the ionic evaporation by shrinking the surface tension of the ion droplet in the ESI source (Barceló-Barrachina et al., 2004). With the intention of BPA ion enhancement response, minimize the fragmentation of target ion and operational mobile phase desolvation, the ESI source conditions such as cone voltage (10–60 V), source temperature (80–120 °C), desolvation temperature (150–350 °C) capillary voltage (2.5–4.0 kV) and desolvation gas (200–700 L/h) were optimized. The ESI source has offered intense [M−H]− ion which relate to the deprotonation of BPA. The optimization of ESI source parameters revealed that the values at higher levels were not play any significant role, whereas, the cone voltage effect was found perceptible on the analysis of BPA. The MS system was initially operated in full scan mode to choose the utmost abundant BPA ion (m/z 227.29). The intensity of BPA ion was applied to improve the parameters involved in ion transmission and ionization. To attain the utmost abundant product ions, the collision energy between from 10 eV and 60 eV was studies, which correspond to two product ions (m/z: 133.14) and (m/z: 212.12). The MS/MS parameters and fragmentation arrangement of BPA were illustrated in Table 1 and Fig. 1, correspondingly.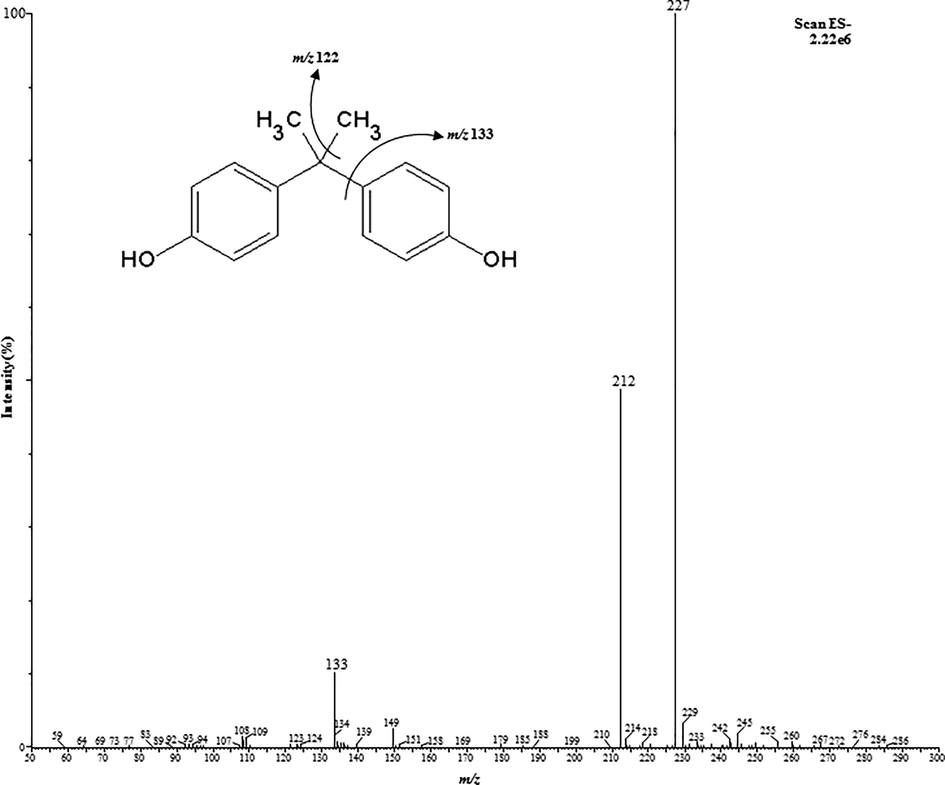
The MS/MS fragmentation arrangement of bisphenol A.
8 Optimization of SPE
Because of low level of BPA present in water samples, the development of an appropriate technique for its identification is of great challenge and needs very effective extraction and clean-up methods which can remove the intrusions possibly disturb BPA determination by mass spectrometric system. At first, the previously developed SPE method comprising extraction cartridges Oasis® Max (mixed-mode polymeric sorbent) and Oasis® HLB (polymeric reversed phase sorbent) was applied for the extraction of BPA from water samples (Yang et al., 2014; Swartz, 2005). Preliminary studies were carried out with an aliquots of ultrapure water (10 mL, free from BPA) fortified with known concentration of BPA (1 µg/mL). Under the applied SPE conditions (Yang et al., 2014), unexpectedly the sorbents and sample extracts were visually appearing as brown in color. Thereafter, the extract was evaporated, redissolved and filtrated and injected into the UPLC-MS/MS system. The achieved BPA chromatogram has been shown in Fig. 2 which showed lots of noise including tailing and asymmetrical in shape. Subsequently, in order to achieve the best BPA extraction and clean-up technique another polymeric materials were evaluated as sorbents for instance Bond Elut C18 (hydrophobic, bonded silica sorbent). A series of extractions using different extracting solvents and flow rates were performed by passing the ultrapure water sample (10 mL) spiked with same BPA concentration as used in above applied method, after extraction the sample extract including cartridges were found visually very unblemished and injected into UPLC-MS/MS system. The BPA chromatogram was found with no tailing and very symmetrical (Fig. 2).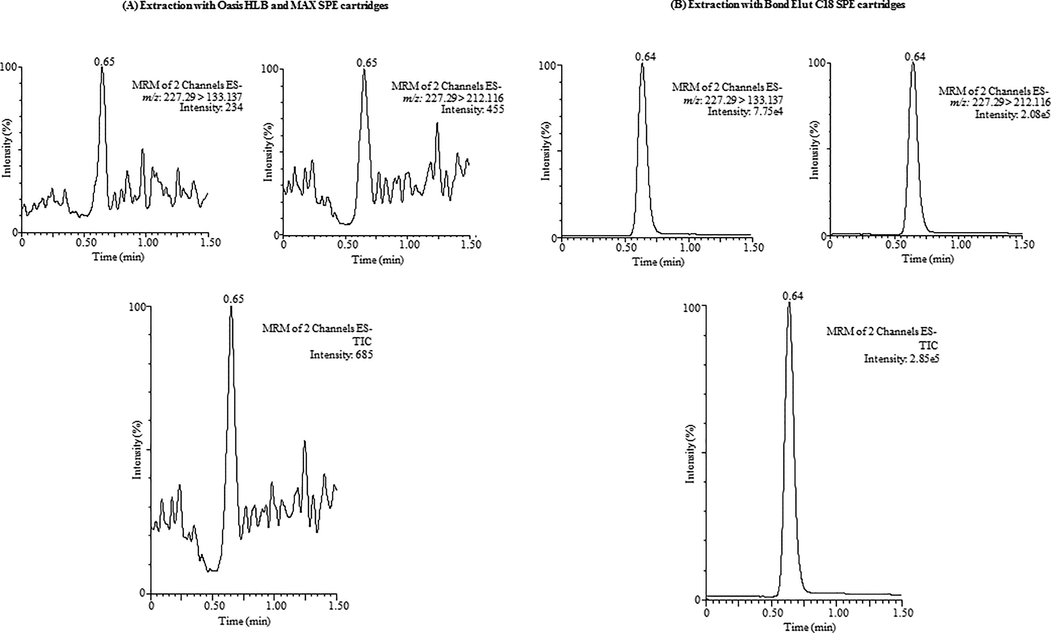
UPLC-MS/MS chromatogram of BPA obtained using (A) Oasis® Max (mixed-mode polymeric sorbent) and Oasis® HLB (polymeric reversed phase sorbent) cartridges and (B) Bond Elut C18 (hydrophobic, bonded silica sorbent) cartridge.
9 Performance of the method
The performance of analytical procedures was assessed in terms of linearity, limits of detection (LODs) and quantitation (LOQs), precision, selectivity and recovery values. The method linearity was established by means of seven BPA standard calibration solutions at concentration values between 1 µg/L and 100 µg/L, analysis was performed in triplicates. The calibration curves were prepared via plotting the area of BPA chromatogram versus respective amounts. The calibration curve was found to be linear in the established concentration values and the coefficient of determination (R2) was achieved higher than 0.999. The result has revealed the tremendous relationship between peak area and BPA levels.
The LOD value was assessed from Milli-Q water sample spiked at very low amount of BPA. LOD was estimated as the average amount of target analyte generating a signal-to-noise ratio of three (S/N = 3). Nevertheless, the LOQ value was evaluated in the similar manner considering a signal-to-noise ratio of ten (S/N = 10). The LOD and LOQ values were obtained 0.01 µg/L and 0.04 µg/L, respectively. The LOD value for BPA is found lower than those obtained in earlier study where the authors applied (LC-MS/MS) Yang et al., 2014.
The method precision was estimated under repeatability (run–to–run) and reproducibility (day–to–day) precision parameters, for run–to–run precision, five replicates of BPA standard (0.1 mg/L) were injected on the same day, however for day–to–day precision five replicates of the same BPA standard were injected over three following days. Run–to–run and day–to–day precisions were illustrated as percent relative standard deviation (RSD%) by calculating the BPA peak area values. Both, run–to–run and day–to–day precisions were found to be acceptable, presenting RSD values <1% and <3%, correspondingly. The acquired results have revealed that the method precision was adequate for the study of BPA in drinking water. The precision values in the present study was also found to be very smaller than those achieved in the previous investigation (Yang et al., 2014).
The selectivity of the system was evaluated by the study of routine blank samples (Milli-Q water, free from BPA), and diverse water samples fortified at 10 µg/L. The BPA peaks acquired for quantitative and qualitative MS/MS transitions which were verified for interferent peak eluting at the same retention time of the resultant target analyte. The obtained outcome demonstrated that no any interferents were detected at the same retention time of the studied compound in any of the MS/MS transitions.
To assess the recovery values of the procedure, each water samples were spiked with known BPA concentration (∼equivalent to the concentration obtained in each water samples) in triplicates prior to the SPE procedure. The recovery values were achieved from 96.81 to 99.77% depending upon the type of samples (Table 2). The standard deviation values were found lower than 0.5. The achieved outcomes showed that the peak of the studied compound was not affected by the sample matrix in such type of water samples, as an advantage the external calibration technique can also be applied for BPA quantitation in such type of samples. – not described; SD = standard deviation (n = 3); PET = polyethylene terephthalate.
Water sample
Source
Country of origin
Before BPA addition, (µg/L) ± SD
BPA added, (µg/L)
After BPA addition, (µg/L) ± SD
Recovery (%)
Type
Disinfection method
Sample 1
Spring
Bulgaria
11.08 ± 0.03
12
22.70 ± 0.12
98.35
PET
Ozonation
Sample 2
Spring
Turkey
11.66 ± 0.03
12
23.58 ± 0.12
98.66
PET
Ozonation
Sample 3
Spring
Lebanon
0.39 ± 0.01
0.5
0.86 ± 0.01
96.81
PET
Ozonation
Sample 4
–
Malaysia
2.16 ± 0.01
3
5.07 ± 0.03
98.21
PET
Ozonation
Sample 5
Spring
France
10.87 ± 0.03
11
21.57 ± 0.12
98.61
PET
–
Sample 6
Spring
Turkey
0.29 ± 0.01
0.3
0.57 ± 0.01
96.88
PET
Ozonation
Sample 7
Spring
Lebanon
12.41 ± 0.04
13
25.12 ± 0.04
98.86
PET
Ozonation
Sample 8
Spring
Italy
4.25 ± 0.02
5
9.08 ± 0.03
98.19
PET
Ozonation
Sample 9
Well water
Saudi Arabia
2.32 ± 0.02
3
5.22 ± 0.02
98.05
PET
Ozonation
Sample 10
Well water
Saudi Arabia
5.72 ± 0.02
6
11.51 ± 0.04
98.21
PET
–
Sample 11
Well water
Saudi Arabia
9.48 ± 0.03
10
19.20 ± 0.12
98.55
PET
Ozonation
Sample 12
Well water
Saudi Arabia
3.97 ± 0.02
4
7.83 ± 0.04
98.20
PET
Ozonation
Sample 13
Well water
Saudi Arabia
24.88 ± 0.14
25
49.37 ± 0.50
98.99
PET
Ozonation
Sample 14
Well water
Saudi Arabia
4.58 ± 0.02
5
9.40 ± 0.03
98.13
PET
Ozonation
Sample 15
Well water
Saudi Arabia
7.63 ± 0.04
8
15.45 ± 0.05
98.85
PET
Ozonation
Sample 16
–
Saudi Arabia
7.08 ± 0.04
8
14.84 ± 0.05
98.38
PET
–
Sample 17
Well water
Saudi Arabia
3.59 ± 0.01
4
7.45 ± 0.04
98.18
PET
Ozonation
Sample 18
Well water
Saudi Arabia
4.34 ± 0.02
5
9.19 ± 0.04
98.36
Glass
Ozonation
Sample 19
Spring
France
41.19 ± 0.30
42
83.00 ± 0.7
99.77
Glass
Ozonation
Sample 20
Spring
Germany
10.44 ± 0.03
11
21.18 ± 0.12
98.79
Glass
Ozonation
10 Application to water sample
To determine the applicability of the SPE and UPLC-MS/MS method, a total of twenty water samples obtained from local hypermarkets were studied. The water samples were of different trademarks and country of origin packaged in two types of materials comprising PET and glass bottles. Among the measured BPA amounts in water samples, the BPA was identified in all of the studied samples, results have been illustrated in Table 2. The amounts of BPA in PET bottled samples (1–17) were obtained between 0.29 µg/L and 24.88 µg/L, whereas glass bottled samples (18–20) contain BPA between 4.34 µg/L and 41.19 µg/L. In the present study, the results showed that the PET bottled samples containing lower amounts of BPA than the glass bottled samples. Nevertheless, many studies have shown that the PET bottled samples usually containing higher amounts of BPA (Yang et al., 2014). The BPA amounts obtained in glass bottled samples are unexpected, however, it could be assumed that the formation of BPA took place during the production of water samples, where the water passed through many channels which are possible made from PET materials. To our information, these outcomes establish the first data on the occurrence of BPA in both PET and glass bottled samples using SPE based on Bond Elut C18 and UPLC-MS/MS. The MRM chromatogram obtained for a PET bottled sample (sample 13) has been demonstrated in Fig. 3, where the amounts of BPA was detected at higher concentrations.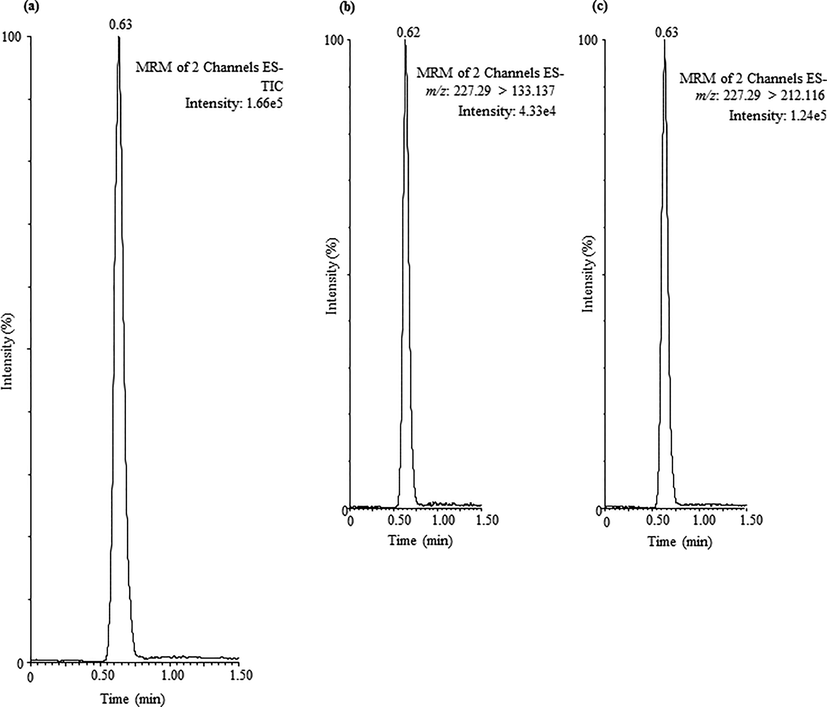
UPLC-MS/MS chromatogram of BPA achieved in PET bottled sample (sample 13).
11 Conclusions
SPE based on Bond Elut C18 has offered a highly selective extraction of the BPA in water samples without any further purification. The chromatographic separation of BPA was attained in <1 min and the method performance in terms of linearity, LODs and LOQs, precision, selectivity and recovery values were found to be acceptable. The optimized system was applied for the analysis of BPA in PET and glass bottled water samples, which revealed that the PET bottled samples contain lower BPA ranged from 0.29 µg/L to 24.88 µg/L, whereas glass bottled samples contain higher amounts of BPA ranged from 4.34 µg/L to 41.19 µg/L. The acceptable recovery values were achieved between 96.81% and 99.77% in both type of samples. The BPA in glass bottled samples were obtained relatively at higher levels than PET bottled samples, it was much unexpected, nevertheless it could be assumed that the formation of BPA took place during the production of water, where the water passed through many channels which are possible made from PET materials. Indeed, further research would be required to know the mechanism of BPA formation during water production in respective water companies. The outcomes demonstrate that the presented method is simple, fast and inexpensive as it requires a lesser amount of materials, and delivered benefits over traditional systems including laborious sample preparation procedures.
Acknowledgments
The authors extend their appreciation to the King Abdulaziz City for Science and Technology (KACST), Saudi Arabia, for funding the work through the Research Project No. 1-18-01-001-0046.
Declaration of Competing Interest
The authors declare that they have no known competing financial interests or personal relationships that could have appeared to influence the work reported in this paper.
References
- Trace level determination of bisphenol-A in wastewater and sewage sludge by high-performance liquid chromatography and U.V. detection. Water Qual. Res.. 2013;J.48:133-144.
- [Google Scholar]
- Advances in LC–MS/MS analysis of environmental and food samples. Anal. Bioanal. Chem.. 2015;407:4227-4228.
- [Google Scholar]
- Evaluation of different liquid chromatography–electrospray mass spectrometry systems for the analysis of heterocyclic amines. J. Chromatogr. A.. 2004;1023:67-78.
- [Google Scholar]
- Simultaneous and fast determination of bisphenol A and diphenyl carbonate in polycarbonate plastics by using excitation-emission matrix fluorescence couples with second-order calibration method. Spectrochim. Acta A. 2019;216:283-289.
- [Google Scholar]
- Determination of four parabens and bisphenols A, F and S in human breast milk using QuEChERS and liquid chromatography coupled to mass spectrometry. J. Chromatogr. B.. 2019;1114–1115:154-166.
- [Google Scholar]
- Implementing Council Directive 96/23/EC concerning the performance of analytical methods and the interpretation of results. Off. J. Euro Commun.. 2002;L221:8-36.
- [Google Scholar]
- European Food Safety Authority (EFSA), Report on the two-phase public consultation on the draft EFSA scientific opinion on bisphenol A (BPA). EFSA supporting publication 2015:EN-740.
- European Union, Amending Directive 2002/72/EC as regards the restriction of use of Bisphenol A in plastic infant feeding bottles, Commission directive2011/8/EU. Off. J. Euro. Union L 26/11, 2011.
- Occurrence of phthalates and bisphenol A and F in the environment. Water Res.. 2002;36:1429-1438.
- [Google Scholar]
- On-line solid phase extraction fast liquid chromatography-tandem mass spectrometry for the analysis of bisphenol A and its chlorinated derivatives in water samples. J. Chromatogr. A.. 2010;1217:3511-3518.
- [Google Scholar]
- Recent advances in mass spectrometry analysis of phenolic endocrine disruptors and related compounds. Mass. Spec. Rev.. 2010;29:776-805.
- [Google Scholar]
- Fast liquid chromatography-tandem mass spectrometry for the analysis of bisphenol A-diglycidyl ether, bisphenol F-diglycidyl ether and their derivatives in canned food and beverages. J. Chromatogr. A.. 2011;1218:1603-1610.
- [Google Scholar]
- Quantification of eight bisphenol analogues in blood and urine samples of workers in a hazardous waste incinerator. Environ. Res.. 2019;176:108576.
- [Google Scholar]
- Occurrence of bisphenols, bisphenol A diglycidyl ethers (BADGEs), and novolac glycidyl ethers (NOGEs) in indoor air from Albany, New York, USA, and its implications for inhalation exposure. Chemosphere. 2016;151:1-8.
- [Google Scholar]
- Bisphenol A and human health: a review of the literature. Reprod. Toxicol.. 2013;42:132-155.
- [Google Scholar]
- A review on endocrine disruptors and their possible impacts on human health. Environ. Toxicol. Pharmacol.. 2015;40:241-258.
- [Google Scholar]
- Prenatal exposure to bisphenols and parabens and impacts on human physiology. Physiol. Res.. 2017;66:S305-S315.
- [Google Scholar]
- Fifteen years after “Wingspread”–environmental endocrine disrupters and human and wildlife health: where we are today and where we need to go. Toxicol. Sci.. 2008;105:235-259.
- [Google Scholar]
- Bisphenol A is released from polycarbonate drinking bottles and mimics the neurotoxic actions of estrogen in developing cerebellar neurons. Toxicol. Lett.. 2008;176:149-156.
- [Google Scholar]
- Bisphenol analogues in sediments from industrialized areas in the United States, Japan, and Korea: spatial and temporal distributions. Environ. Sci. Technol.. 2012;46:11558-11565.
- [Google Scholar]
- Quantitative screening for endocrine-disrupting bisphenol A in consumer and household products using NanoAptamer assay. Chemosphere. 2018;211:72-80.
- [Google Scholar]
- The occurrence of bisphenol plasticizers in paired dust and urine samples and its association with oxidative stress. Chemosphere. 2019;216:472-478.
- [Google Scholar]
- Liquid chromatography–mass spectrometry in food safety. J. Chromatogr. A.. 2010;1217:4018-4040.
- [Google Scholar]
- Exposure assessment of Bisphenol A intake from polymeric baby bottles in formula-fed infants aged less than one year. Toxicol. Rep.. 2015;2:1273-1280.
- [Google Scholar]
- Exposure to bisphenol A and diabetes risk in Mexican women. Environ. Sci. Pollut. Res.. 2019;26:26332-26338.
- [Google Scholar]
- A mini review of bisphenol A (BPA) effects on cancer-related cellular signaling pathways. Environ. Sci. Pollut. Res.. 2019;26:8459-8467.
- [Google Scholar]
- Canned food intake and urinary bisphenol a concentrations: a randomized crossover intervention study. Environ. Sci. Pollut. Res. 2019
- [CrossRef] [Google Scholar]
- Second trimester amniotic fluid bisphenol A concentration is associated with decreased birth weight in term infants. Reprod. Toxicol.. 2017;67:1-9.
- [Google Scholar]
- Development of a solid-phase microextraction method for the analysis of phenolic flame retardants in water samples. J. Chromatogr. A. 2006;1124:11-21.
- [Google Scholar]
- Bisphenol A: an endocrine disruptor with widespread exposure and multiple effects. J. Steroid. Biochem. Mol. Biol.. 2011;127:27-34.
- [Google Scholar]
- UPLC™: an introduction and review. J. Liq. Chromatogr. Relat. Technol.. 2005;28:1253-1263.
- [Google Scholar]
- The Fitness for Purpose of Analytical Methods – A Laboratory Guide to Method Validation and Related Topics, 2nd ed., 2014, 978-91-87461-59-0. http://www.eurachem.org.
- BPA, BADGE and analogues: a new multi-analyte LC-ESI-MS/MS method for their determination and their in vitro (anti)estrogenic and (anti)androgenic properties. Chemosphere.. 2019;221:246-253.
- [Google Scholar]
- Widespread occurrence and accumulation of bisphenol A diglycidyl ether (BADGE), bisphenol F diglycidyl ether (BFDGE) and their derivatives in human blood and adipose fat. Environ. Sci. Technol.. 2015;49:3150-3157.
- [Google Scholar]
- Simultaneously determination of bisphenol A and its alternatives in sediment by ultrasound-assisted and solid phase extractions followed by derivatization using GC-MS. Chemosphere. 2017;169:709-715.
- [Google Scholar]
- Several environmental endocrine disruptors in beverages from South China: occurrence and human exposure. Environ. Sci. Pollut. Res.. 2019;26:5873-5884.
- [Google Scholar]
- Simultaneous determination of seven bisphenols in environmental water and solid samples by liquid chromatography–electrospray tandem mass spectrometry. J. Chromatogr. A.. 2014;1328:26-34.
- [Google Scholar]
- Gas chromatographic–mass spectrometric method for the determination of bisphenol A and its chlorinated derivatives in urban wastewater. Water Res.. 2003;37:735-742.
- [Google Scholar]


