

Translate this page into:
Towards understanding the extent of saltwater incursion into the coastal aquifers of Akwa Ibom State, Southern Nigeria using 2D ERT
⁎Corresponding author. ahmed.eldosouky@sci.suezuni.edu.eg (Ahmed M. Eldosouky)
-
Received: ,
Accepted: ,
This article was originally published by Elsevier and was migrated to Scientific Scholar after the change of Publisher.
Peer review under responsibility of King Saud University.
Abstract
The hydro-lithostratigraphic units of the coastal area of Akwa Ibom State, Southern Nigeria were investigated involving electrical resistivity tomography (ERT) and Wenner array. This procedure and electrode configuration were adopted because of their wide range of sensitivity and inherent characteristics to geological materials. This study is aimed at defining the extent of saltwater invasions into the coastal and inland aquifers. The investigated area is divided into three zones A (≤0 < 20 km), B (<20 < 40 km), and C (>40 km)) based on the distance from the survey locations to the shoreline. The saline aquifer of the control tomogram obtained at the shoreline (Ibeno Beach) is characterized by the electrical resistivity of 0.159–3.55 Ωm. Within Zone A, (Ukpenekang, Eastern Obolo, and Okoro Ette), the saline aquifer is defined by electrical resistivity values of 0.33–44.0 Ωm, 2.07–48.5 Ωm, and 8.0–60.0 Ωm respectively. In general, the Zone B saline aquifers are defined by electrical resistivity values of 0.602–64.5 Ωm. Furthermore, the third zone which is situated a distance >40 km from the shoreline, is described by relatively higher electrical resistivity values (38.9–3260 Ωm) and indicates a region free from saltwater incursions. Generally, the 2D ERT models showed that electrically resistivity values increase progressively inland.
Keywords
2D ERT
Wenner array
Aquifer
Saltwater
Coastal area
Southern Nigeria

1 Introduction
Generally, people dwell in coastal regions mainly for economic benefits from ports (Abdoulhalik et al., 2021), industries, tourism, and aquaculture (Gong et al., 2013). The demand for potable water by the increasing dwellers in coastal regions has put huge pressure on the fragile coastal aquifers. The upsurge in water exploitation from the boreholes has initiated a hydraulic gradient that caused the migration of seawater into coastal aquifers (Naderi et al., 2013). Furthermore, it has been reported that density variation between the less dense fresh water and denser saline could cause saltwater intrusions (Robinson et al., 2016). This has caused the abandonment of several boreholes in many coastal locations across the world, resulting in significant economic losses, especially given the near-exclusive reliance of households, agriculture, and industries in such zones on groundwater (Abdoulhalik et al., 2021).
To better understand the saltwater intrusion procedure, studies like laboratory-scale investigations, numerical, and analytical modelling studies (Felisa, et al., 2013; Goswami and Clement, 2007). Also, the development of a probabilistic numerical model to forecast the extent of saltwater incursion (Felisa et al., 2013), the hydraulic conductivity influence on the saltwater intrusion mechanism, and uncertainties of the spatial distribution of pumping rates, and proposal for a benchmark model for seawater intrusion problems (Goswami and Clement, 2007). Other studies involved colorimetric variations of phenolphthalein with respect to pH to image the dispersive region (Abarca and Clement, 2009), the critical pumping rate of a well (Abdoulhalik et al., 2020), transient experimental results for different homogeneous soils exhibiting various hydraulic conductivities (Robinson et al., 2016), fuzzy-synthetical evaluation approach (Liu et al., 2016), etc. In addition, a number of geological, geophysical, and geochemical methods have been used to study seawater incursions (Vu et al., 2021; Gopinath and Srinivasamoorthy, 2015).
Furthermore, monitoring wells can be used to determine the spread of saline water incursion within coastlines. Although, this method is quite expensive because of the high cost of drilling, and the difficulty involved in understanding the extent of intrusions due to the rapid variations of subsurface layer distributions. However, the electrical resistivity method which is often considered non-invasive, environmental-friendly (Ekwok et al., 2020; Akpan et al., 2014), couple with fast computer inversion software (Loke, 2000) can be used for this investigation. The electrical sounding procedure has been used for various environmental studies (Akpan et al., 2018; Akpan et al., 2016; Ekwok, 2012). Nonetheless, this method does not take into account horizontal variations in the subsurface resistivity (Loke, 1994). To address this challenge, the electrical resistivity tomography (ERT) which accounts for both horizontal and vertical variations in subsurface resistivity (Loke, 2000; Loke, 1994) was used for this research. ERT is not a substitute for monitoring wells, but it is the most practical economic compromise between obtaining very accurate results and keeping the survey costs down (Dahlin 1996). Also, it offers a fast way of constructing contiguous 2-D and 3-D imageries of the subsurface and determining in-situ bulk properties (Loke, 1994).
ERT has become a potent tool in investigating geology and related subsurface shallow structures for different engineering, archaeological (Tsokas et al., 2011) and environmental studies (Al-Amoush et al., 2017; Akpan et al., 2014). Previous reports have shown that Wenner and Wenner-Schlumberger configurations which are relatively sensitive to vertical variations in the substratum have strong signal strength (Loke, 2014). However, the dipole–dipole configuration is characterized by good horizontal data coverage and weak signal strength at a greater depth (Loke, 2014; Loke, 2000). A comprehensive review of the various characteristics of arrays can be obtained in Loke (2014), Dahlin and Zhou (2004), Loke (2000), Zhou and Dahlin (2003), Szalai and Szarka (2007a), Szalai and Szarka (2007b).
The object of this study is to determine the lateral and vertical extent of saline water incursion into adjoining aquifers and characterize the shallow litho-stratigraphic units of the coastal zone, and neighbouring areas in Akwa Ibom State, Southern Nigeria. The ERT and Wenner array were chosen because of their wide range of sensitivity and inherent characteristics to geological materials (Al-Amoush et al., 2017). Nonetheless, ERT data are sometimes associated with errors due to inherent uncertainties in the transformation of electrical resistivity data to their matching geologic models (Akpan et al., 2016; Ekwok, 2012). The uncertainties are usually resolved by correlating the ERT model with geologic information and well-log data (Ekwok et al., 2020).
2 Location and geologic setting of the study area
The study area covers nine out of thirty-one Local Government Areas of Akwa Ibom State, Southern Nigeria. The land area is about 6900 km2 and lies within the tropical climate region. It is geographically placed between longitude 4°32′E and 5°53′E and latitude 7°25′N and 8°25′N. It is surrounded on the east, west and south by Cross River, Abia and Rivers States, and the Atlantic Ocean, respectively. The ocean straddles Ikot Abasi through Oron and the southernmost tip of Cross River State covering a distance of ∼129 km.
Geologically, the area is underlain by late Tertiary and Holocene sedimentary Formations (Fig. 1). In the shore and estuaries of the Imo and Kwa Ibo Rivers, as well as along the flood plains of the creeks, there are deposits of recent alluvium and beach ridge sands (Akpabio and Ekanem, 2009). The deltaic plain sands and Benin Formation constitutes the main aquifer formations. The Benin Formation comprises largely porous sands and gravels of various grain sizes, intercalated with thin clay and shale beds resulting in the creation of a multi-aquifer system in the Niger Delta (Akpabio and Eyenaka, 2008).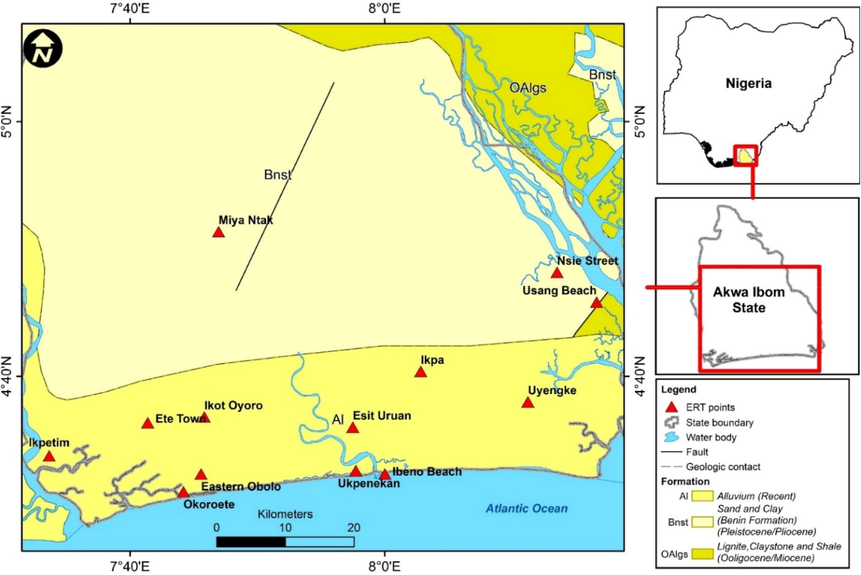
Geologic map of the study area showing ERT locations.
2.1 Field procedure and ERT data modeling
High-resolution imageries of the subsurface materials based on spatial resistivity distribution can be generated by applying the ERT (Perrone et al., 2004). This method has been employed in various complicated geo-environmental studies associated with hydrogeological, engineering, geothermal, seismotectonic, volcanic activities (Akpan et al., 2014). Two-dimensional ERT data were obtained along thirteen profiles (Fig. 1) using IGIS resistivity meter model SSR-MP-ATS. The data were collected involving the Wenner electrode array with the aim of ensuring that data acquired were of high signal-to-noise ratios (Akpan et al., 2014; Loke, 1999). Quality control measures such as wetting the planted electrodes to ensure good electrical contact with the ground, and the reciprocal error (e) method (Eq. (1)), with 5% maximum acceptable value were employed.
From the measured data, apparent resistivity values were transformed in pseudo-sections involving RES2DINV software (Loke and Barker, 1996), which characterize the subsurface resistivity distributions. The inversion process was centered on the smoothness controlled least-squares inversion that is frequently executed applying the Quasi-Newtonian optimization code (Akpan et al., 2014). This procedure creates smooth disparities in subsurface resistivity with depth (Akpan et al., 2014). The subsurface is partitioned into rectangular blocks, the number of which matches with the total number of ERT data points. The optimization routine adjusts the 2-D model by iteratively reducing the difference between the measured and computed apparent resistivity values. The RMS technique, in which 5% was set as the upper acceptable limit, was also used in measuring the difference between the measured and theoretical data.
3 Results
After iterations, the inverted resistivity tomograms of thirteen ERT profiles converged and produced root mean square error (RMSE in percent) that vary with respect to the measured data error (that is., <5%). All resistivity tomograms resolved the earth's structure to a depth of 26.2 m. The Ibeno Beach and Miya Ntak ERT profiles which serve as controls were sited at the shoreline and inland respectively. The investigated area is subdivided into zone A (≤0 < 20 km), B (<20 < 40 km), and C (>40 km). This division is based on the distance from the shoreline to the survey point.
3.1 Zone A tomogram results
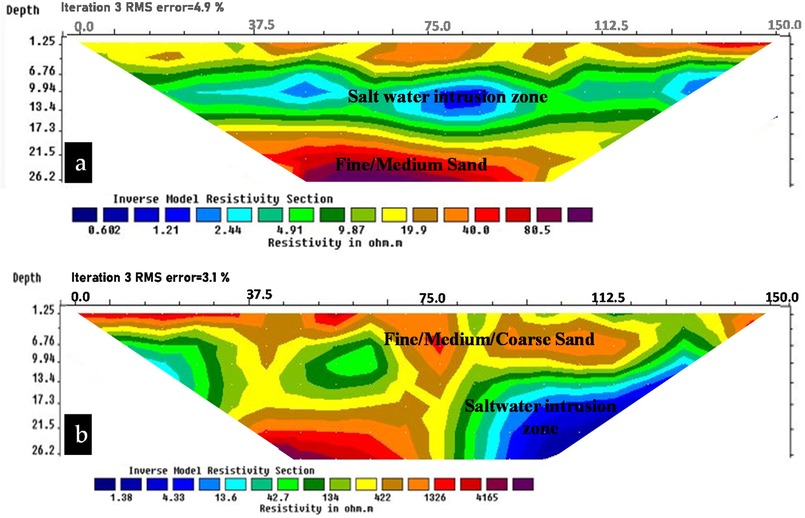
Zone A is composed of tomograms obtained from Ibeno Beach, Ukpenekang, Eastern Obolo and Okoro Ette. The Ibeno Beach tomogram (Fig. 2a) was obtained at the shoreline and serves as a guide in the interpretation of Zones A and B tomograms. The ERT profile which was situated parallel to the shoreline indicates that saltwater dominance in the aquifers starts from <2 m below the Earth’s surface. The fairly horizontal yellow colour band of the model indicates the borderline between the top alluvium sandy materials (10.5–30.9 Ωm) and the aquifer dominated by saline water (0.0159–3.55 Ωm). These resistivity values are considerably lower than the saltwater resistivity values reported by Okorie and Sofolabo (2017) and Oyeyemi et al., (2015). The Ukpenekang profile (Fig. 2b) was situated perpendicular to the shoreline and located about 0.5 km from Ibeno Beach. The top layer of the model dominated by alluvium sand materials is highly resistive (105–606 Ωm). The saltwater encroachment region with electrical resistivity that varies from 1.33 to 44.0 Ωm (characterized by blue-green colour) starts from a depth of about 13 m. The saltwater zone within Eastern Obolo (Fig. 3a) which is about 1.0 km from the Atlantic Ocean, is defined by a semioval-shaped region with electrical resistivity values that ranged from 2.07 to 48.5 Ωm. The depth of this zone correlates with Fig. 2b. The fourth tomogram (Fig. 3b) within Zone A indicates a high concentration of saltwater region similar to Fig. 2a. Although, the resistivity values (8.0–60.0 Ωm) of saltwater in this region (Fig. 3b) are slightly higher than that of Fig. 2a. This slight variation may be caused by the distance from the shoreline.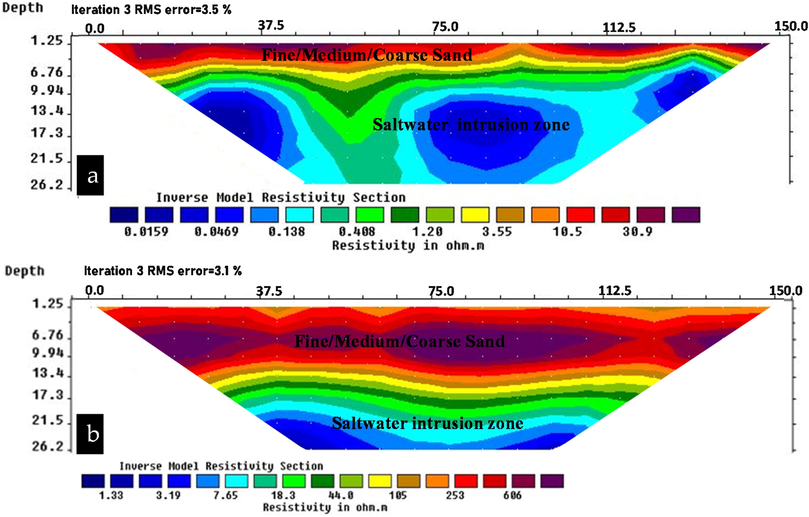
ERT tomograms obtained at (a) Ibeno Beach and (b) Ukpenekang.
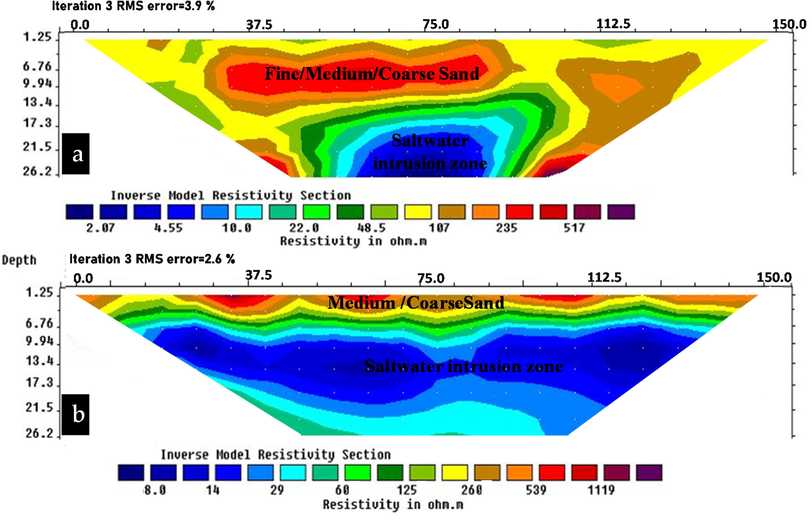
ERT tomograms obtained at (a) Eastern Obolo and (b) Okoro Ette.
3.2 Zone B tomogram results
2D models in Zone B were situated in Uyenghe, Ikpa, Esit Uruan, Ikot Oyoro, Ette Town, and Ikpetim. The 2D model from Uyenghe (Fig. 4a) showed a saltwater incursion zone (defined by electrical resistivity of 27.1–53.5 Ωm) occurring at a depth of about 25 m. Likewise, Fig. 4b revealed a saltwater zone characterized by electrical resistivity values of 36.3–62.5 Ωm occurring at a depth of about 21.5 m. Tomograms of Esit Uruan, Ikot Oyoro, and Ette Town (Figs. 5a-6a) showed saltwater incursion regions defined by electrical resistivity values that varied from 0.602 to 40.0 Ωm, 1.38–42.7 Ωm, 4.04–64.5 Ωm respectively. However, the 2D model obtained at Ikpetim shows no evidence of saline water encroachment. The relatively low resistivity values (1.98–105 Ωm) witnessed in the area (Fig. 6b) are suspected to be caused by the top-layer clay/shale materials. The underlying subsurface sandy materials have varied electrical resistivity values of 284–2072 Ωm that indicate freshwater zone dominated by medium/coarse-grained sands. Generally, the range of electrical resistivity values suspected to reflectedsaltwater-dominated aquifers correlate relatively well with previous findings in the coastal environments of Nigeria (Igboekwe et al., 2019; Okorie and Sofolabo, 2017; Atakpo, 2013).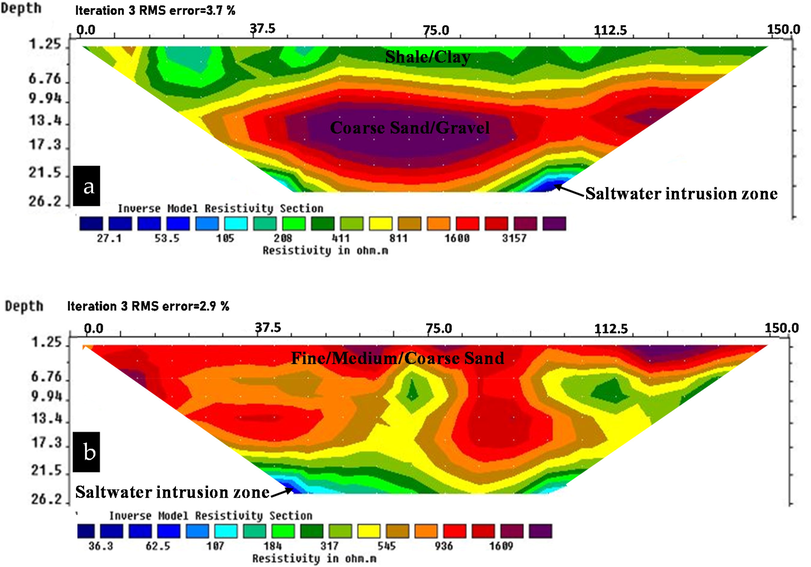
ERT tomograms obtained at (a) Uyenghe and (b) Ikpa.
ERT tomograms obtained (a) Esit Uruan and (b) Ikot Oyoro.
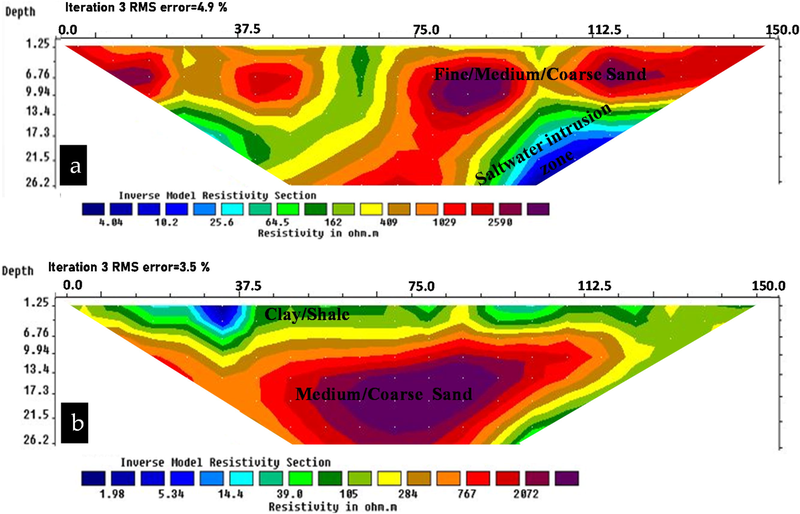
ERT tomograms obtained (a) Ette Town and (b) Ikpetim.
3.3 Zone C tomogram results
Using Beach (Fig. 7a) and Nsie ERT (Fig. 7b) profiles were located in the neighborhood of the creeks of Niger Delta, and of the Atlantic Ocean at a distance of about 43.5 km. The comparatively low resistivity values of 38.9–266 Ωm (Fig. 7a) and 115–491 Ωm (Fig. 7b) represent shale/clay layers that intercalated the various sands of different grain sizes in the subsurface. The tomogram acquired at Miya Ntak represents an inland ERT model that also served as a control during interpretation. Comparatively, the model (Fig. 8) showed a top layer that is characterized by relatively high resistivity values (550–2124 Ωm) caused by sandy/gravelly materials. This layer is underlain by a relatively low resistive (90–351 Ωm) silt/clay/shale bed that intercalates the sand layers. On the whole, the relatively higher resistivity values observed from the 2D models of Zone C show that the area is free from saltwater encroachment.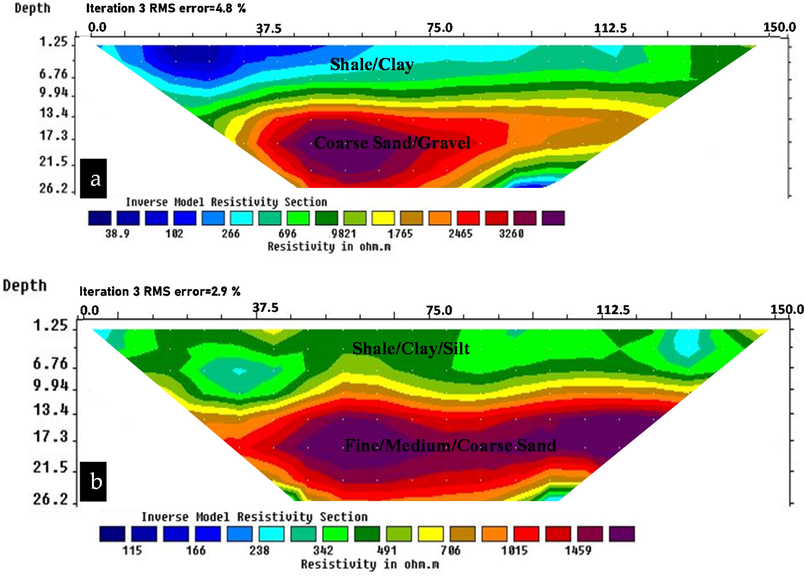
ERT tomograms obtained (a) Usuang Beach and (b) Nsie.
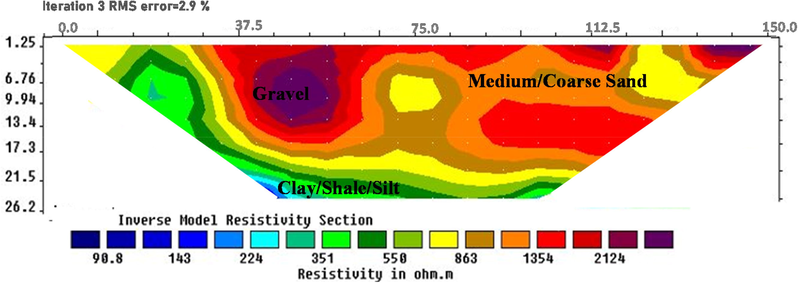
ERT tomogram obtained Miya Ntak.
4 Discussion
The investigated area is classified as Zones A (≤0 < 20 km), B (<20 < 40 km), and C (>40 km) based on the distance from the shoreline to the survey points. Within Zone A, the resistivity values varied from 0.015 to 1119 Ωm. The saline aquifers for the different tomograms obtained at Ibeno Beach, Ukpenekang, Eastern Obolo, and Okoro Ette (Fig. 2a-3b) are characterized by 0.159–3.55 Ωm, 0.33–44.0 Ωm, 2.07–48.5 Ωm and 8.0–60.0 Ωm respectively. The resistivity values obtained at Ibeno Beach are relatively lower than the 4.0 Ωm values reported in the saline aquifer in Southwest Nigeria (Oyeyemi et al., 2015; Oteri and Atolagbe, 2003). Furthermore, the saline water incursion region of the middle part (Zone B) of this study area is defined by apparent electrical resistivity values that varied from a minimum of 0.602 Ωm to a maximum of 64.5 Ωm. The observed resistivity values indicating saline aquifers agree relatively well with previous studies (Aladejana et al., 2021; Igboekwe et al., 2019; Okorie and Sofolabo, 2017; Adeyemo et al., 2017; Atakpo, 2013; Oteri and Atolagbe, 2003). However, shale and clay lenses occurring alongside the dominantly coastal sands in the subsurface have minimal effects on the observed low resistivity values. Based on the measured resistivity values, the concentration of saline water decreases progressively inland. Generally, the depth to the upper aquifer within the coastline is shallow (<20 m). This condition coupled with the loose overlying sands makes the aquifers within the investigated area highly vulnerable to anthropogenic pollution (Adeyemo et al, 2017). In addition, survey points at distances >40 km from the shoreline are characterized by subsurface materials with relatively higher resistivity values (38.9–3260 Ωm). Such areas are suspected to harbour freshwater aquifers. In order to guarantee sustainable groundwater resources, further investigations involving geochemical analyses and monitoring wells should be carried out to generate reliable long-term data to precisely determine the water budgets for domestic, industrial, and agricultural purposes (Durán-Sánchez et al., 2018; Zaimes and Emmanouloudis, 2012) in the study location. Furthermore, these data are important for the estimation of future water budgets based on population projections (Durán-Sánchez et al., 2018; Zaimes and Emmanouloudis, 2012).
5 Conclusion
Electrical resistivity tomography involving Wenner array was used to investigate the extent of saline water incursions into the coastal and inland aquifers. The study area was partitioned into zones A, B, and C based on the distance from the survey locations to the shoreline. Within Zone A, the saline aquifers detected by the tomograms are characterized by very low resistivity values. The control ERT profile located at Ibeno coastal shoreline has electrical resistivity of 0.159–3.55 Ωm. In other locations like Ukpenekang, Eastern Obolo, and Okoro Ette, the saline aquifer is defined by electrical resistivity values of 0.33–44.0 Ωm, 2.07–48.5 Ωm, and 8.0–60.0 Ωm respectively. Within Zone B, the resistivity of salt incursion zones has resistivity variations of 0.602–64.5 Ωm. Furthermore, Zone C which is free from saltwater invasion is dominated by relatively higher electrical resistivity (38.9–3260 Ωm). The results revealed by various tomograms showed that electrical resistivity values increase progressively inland, and Zone C is observed to be free from saltwater incursions. Generally, loose coastal sands overlying the near-surface aquifers, particularly within Zones A and B enhance groundwater pollution by anthropogenic sources.
Acknowledgment
This research was supported by Researchers Supporting Project number (RSP2022R432), King Saud University, Riyadh, Saudi Arabia.
Declaration of Competing Interest
The authors declare that they have no known competing financial interests or personal relationships that could have appeared to influence the work reported in this paper.
References
- A novel approach for characterizing the mixing zone of a saltwater wedge. Geophys. Res. Lett.. 2009;36:36.
- [Google Scholar]
- Impact of layered heterogeneity on transient saltwater upconing in coastal aquifers. J. Hydrol.. 2020;581:124393
- [Google Scholar]
- Towards a correlation between long-term seawater intrusion response and water level fluctuations. Water. 2021;13:719. https://doi.org/10.3390/w13050719
- [Google Scholar]
- Geoelectric soundings for delineation of saline water intrusion into aquifers in part of eastern Dahomey Basin, Nigeria. J. Geosci. Environ. Protect.. 2017;5:213-232.
- [Google Scholar]
- Water uncertainties in Southeastern Nigeria: Why government should be interested in management. Int. J. Sociol. Anthropol.. 2009;2(2):38-46.
- [Google Scholar]
- Aquifer transmissivity determination using geoelectric sounding data at Uyo, Southern part of Nigeria. Int. J. Pure Appl. Sci., Sci. Afric.. 2008;7(1):81-90.
- [Google Scholar]
- Geophysical and geological studies of the spread and industrial quality of Okurike Barite Deposit. Am. J. Environ. Sci.. 2014;10(6):566-574.
- [Google Scholar]
- Seasonal reversals in groundwater flow direction and its role in the recurrent Agwagune landslide problem: a geophysical and geological appraisal. Environ. Earth Sci.. 2016;75(429):1-17.
- [Google Scholar]
- Coupled geophysical characterization of shallow fluvio-clastic sediments in Agwagune, south-eastern Nigeria. J. Afr. Earth Sc.. 2018;143:67-78.
- [Google Scholar]
- Groundwater quality index as a hydrochemical tool for monitoring saltwater intrusion into the coastal freshwater aquifer of Eastern Dahomey Basin, Southwestern, Nigeria. Groundwater Sustain. Dev. 2021:1-12.
- [Google Scholar]
- Electrical resistivity tomography modeling of vertical lithological contact using different electrode configurations. Jordan J. Earth Environ. Sci.. 2017;8(1):27-34.
- [Google Scholar]
- Arango-Galván, C., De la Torre-González, B., Chávez-Segura, R.E., Tejero-Andrade, A., Cifuentes-Nava, G., Hernández-Quintero, E., 2011. Structural pattern of subsidence in an urban area of the southeastern Mexico Basin inferred from electrical resistivity tomography, Geofis. Int. 50(4), 401–409.
- Geoelectric investigation of deghele community in Warri southwest L.G. A, Delta State, Nigeria. IOSR J. Appl. Phys. (IOSR-JAP). 2013;3(1):6-51.
- [Google Scholar]
- 2D resistivity surveying for environmental and engineering applications. First Break. 1996;14:275-284.
- [Google Scholar]
- A numerical comparison of 2D resistivity imaging with 10 electrode arrays. Geophys. Prospect.. 2004;52:379-398.
- [Google Scholar]
- Sustainable water resources management: A bibliometric overview. Water. 2018;10:1-19.
- [CrossRef] [Google Scholar]
- Electrical Resistivity Investigation of Agwagune Landslide Site, Biase Local Government Area, Cross River State, Nigeria. Nigeria: University of Calabar; 2012. p. :152. Unpublished M.Sc. thesis
- Assessment of groundwater potential using geophysical data: a case study in parts of Cross River State, south-eastern Nigeria. Appl. Water Sci.. 2020;101(44):1-17.
- [Google Scholar]
- Saltwater intrusion in coastal aquifers: A primary case study along the adriatic coast investigated within a probabilistic framework. Water. 2013;5:1830-1847.
- [Google Scholar]
- Salt intrusion during the dry season in the Huangmaohai Estuary, Pearl River Delta, China. J. Mar. Syst.. 2013;111–112:235-252.
- [Google Scholar]
- Application of geophysical and hydrogeochemical tracers to investigate salinisation sources in Nagapatinam and Karaikal coastal aquifers, South India. Aquatic Procedia. 2015;4:65-71.
- [Google Scholar]
- Laboratory-scale investigation of saltwater intrusion dynamics. Water Resour.. 2007;43:43.
- [Google Scholar]
- 2-D Electrical Resistivity Tomography (ERT) For Delineating Saltwater Intrusion in the Coastal Region of AKWA IBOM State, Nigeria. IOSR J. Appl. Geol. Geophys.. 2019;7(5):35-45.
- [Google Scholar]
- Features and evaluation of sea/saltwater intrusion in southern Laizhou Bay. J. Groundwater Sci. Eng.. 2016;4(2):141-148.
- [Google Scholar]
- The inversion of two-dimensional resistivity data. University of Birmingham; 1994. Unpublished PhD thesis
- Tutorial: 2-D and 3-D electrical Imaging Surveys. Malaysia: Geotomo Software; 2014.
- Rapid least-squares inversion of apparent resistivity pseudosections using a quasi-Newton method. Geophys Prospect. 1996;44:131-152.
- [Google Scholar]
- Loke, M.H., 1999. Electrical imaging surveys for environmental and engineering studies: a practical guide to 2-D and 3-D surveys. www.terraplus.com. Accessed Dec 30, 2014.
- Loke, M.H., 2000. A practical guide to 2-D and 3-D surveys. www.geoelectrical.com.
- Seawater intrusion and groundwater resources management in coastal aquifers. Eur. J. Exp. Biol.. 2013;3(3):80-94.
- [Google Scholar]
- Groundwater quality assessment of a coastal aquifer in Niger Delta using geo-electrical techniques. IOSR J. Appl. Geol. Geophys. (IOSR-JAGG). 2017;5(2):71-75.
- [Google Scholar]
- Oteri, A.U., Atolagbe, F.P., 2003. Saltwater intrusion into coastal aquifers in Nigeria. The second international conference on saltwater intrusion and coastal aquifers- monitoring, modeling, and management, Mérida, Yucatán, México.
- Integrated geophysical and geochemical investigations of saline water intrusion in a coastal alluvial terrain, Southwestern Nigeria. Int. J. Appl. Environ. Sci.. 2015;10(4):1275-1288.
- [Google Scholar]
- High- resolution electrical imaging of the Varco d’Izzo earthflow (southern Italy) J Appl Geophys. 2004;56:17-29.
- [Google Scholar]
- Experimental saltwater intrusion in coastal aquifers using automated image analysis: Applications to homogeneous aquifers. J. Hydrol.. 2016;538:304-313.
- [Google Scholar]
- Szalai, S., Szarka, L., 2007b. Auxiliary Results of Collection and Classification of Surface Geoelectric Arrays, 13th European Meeting of Environmental and Engineering Geophysics, Istanbul A09.
- On the classification of surface geoelectrical arrays. Geophys. Prospect.. 2007;56:159-175.
- [Google Scholar]
- Using surface and cross-hole resistivity tomography in an urban environment: an example of imaging the foundations of the ancient wall in Thessaloniki, North Greece. Phys. Chem. Earth.. 2011;36(16):1310-1317.
- [Google Scholar]
- Vu, M.D., Xayavong, V., Do, C.A., Pham, L.T., Gómez-Ortiz, D., Eldosouky, A.M., 2021. Application of the improved multi-electrode electrical exploration methods for groundwater investigation in Vientiane Province, Laos. J. Asian Earth Sci., X, 100056, ISSN 2590-0560. https://doi.org/10.1016/j.jaesx.2021.100056.
- Sustainable management of the freshwater resources of Greece. J. Eng. Sci. Technol. Rev.. 2012;5(1):77-82.
- [Google Scholar]
- Properties of effects of measurements errors on 2D resistivity imaging. Near Surf. Geophys.. 2003;1:105-117.
- [Google Scholar]
Appendix A
Supplementary data
Supplementary data to this article can be found online at https://doi.org/10.1016/j.jksus.2022.102371.
Appendix A
Supplementary data
The following are the Supplementary data to this article:


