

Translate this page into:
Three-component channel wave characteristics and fine imaging of erosion zone
⁎Corresponding author. hlymaster@126.com (Lanying Huang)
-
Received: ,
Accepted: ,
This article was originally published by Elsevier and was migrated to Scientific Scholar after the change of Publisher.
Peer review under responsibility of King Saud University.
Abstract
Intelligent mining on working face requires reliable geological guarantee technology. Transmitted channel wave detection is an effective method to detect geological structures in working face. However, three-component channel wave field characteristics of detecting the erosion zone have not been revealed, which results in difficulty in fine imaging of scour zones. In this paper, numerical modeling and field tests were conducted. The results indicate that when seismic source is excited, the body waves propagating along the roof and floor and the channel waves propagating in the coal seam. When the channel wave propagating in the erosion zone and then produces diffraction wave which propagating along the seam behind the erosion zone, and the rest continues to propagate forward. Owing to absence of coal seam in erosion zone, transmitted channel wave is converted to S-wave on entering the erosion zone, therefore the seismic record shows the partial absence of the transmitted channel wave in Event, and the converted S-wave propagates along roof and floor of coal seam, and they are not able to form channel waves with higher energy. Besides, the Y-component of the channel wave is suitable for detecting erosion zone, because it has high amplitude and it can be easily distinguished. The attenuation imaging method based on eigenvalue limitation has high imaging resolution and good abrupt convergence. Three-component transmitted P-wave and S-wave have no obvious response to erosion zone and cannot be used as characteristic waves for the erosion zone detection.
Keywords
Wave characteristics
Channel wave
Transmitted attenuation
Numerical simulation

1 Introduction
In the coal mines of high gassy, the thickness variation of coal seams in erosion zones may cause ground stress concentration and outburst accidents of coal and gas (Wang et al., 2012a,2012b). Owing to the influence of geological conditions, to a certain extent, erosion zones influence the occurrence and distribution of a coal seam. With a trend of intelligent, efficient, and precise mining, the presence of erosion zones hinders the mining at the working face (Wang et al., 2018). Therefore, the fine detection of erosion zones is in urgent need for coal production.
At present, commonly used methods for detecting erosion zones in mining faces are the prediction methods based on geological laws (Liu, 2004) and coal rock mechanical properties (Wang et al., 2019a) as well as the ground three-dimensional seismic survey (Wang, 2012). However, the prediction methods based on geological laws and coal rock mechanical properties are limited by the workload of drilling and tunneling prospecting (Wang et al., 2016). Besides, the ground three-dimensional seismic survey is affected by complex terrain and shallow goaf, which limit the accuracy of the exploration (Chen et al., 2015). The underground geophysical exploration is not disturbed by ground terrain and close to targeting objects (Wang et al., 2019b). Among underground geophysical survey methods, the in-seam channel wave is the most widely used one for working face structure exploration (Wang et al., 2012a,2012b).
Evison (1955) first excited and received a wave in a coal seam in New Zealand and this type of wave is called channel wave. Krey (1963) conducted a theoretical study of channel wave propagation. Buchanan (1978) carried out an in-depth study of the attenuation characteristics of the Love-type channel wave. Krey et al. (1982) studied the Love channel wave attenuation properties of classical three-layer model. Asten et al. (1984) obtained the relationship between the energy loss of the Love channel wave and the geological anomaly using a numerical simulation. Buchanan (1986) obtained a tomography image of a coal seam on the basis of the propagation time and energy attenuation characteristics of transmitted channel wave and successfully located a geologic anomaly. Krajewski et al. (1987) investigated the characteristics of dispersion curves with the actual signals collected by in-seam two-component geophones. Cox and Mason (1988) verified the theoretical propagation mode of the Love channel wave proposed by Elsen et al. (1985). Liu et al. (1992) compared the theoretical model with field test results and concluded that the Love channel wave is sensitive to the tectonic evolution of the coal seam. Essen et al. (2007) studied the relationship between channel waves and coal seam thickness. The thickness exploration about coal seam is mainly on the basis of the frequency-velocity relationship of the channel wave and the Geological information revealed on field exploration (Zhang et al., 2019), and inversion imaging using the group velocity and energy information of channel wave in the coal seam (Wang et al., 2016).
In summary, in-seam seismic survey has been employed to investigate geological structures and coal seam thickness variations. However, at present, the accurate detection of erosion zones is not well studied and the theoretical study of the characteristics of three-component channel waves transmitted through erosion zones has not been reported. In this study, the simple Love channel wave is employed in erosion zone detection (Breitzke and Dresen, 1986; Liu et al., 2014). The kinematics and dynamics of the transmitted three-component channel wave are evaluated by a numerical simulation and a channel-wave attenuation imaging method based on eigenvalue constraint is proposed. The inversion images of different component signals are compared to reveal the characteristics of the three-dimensional wave field of channel waves. In addition, a high-resolution inversion image of an erosion zone is obtained.
2 Principals of eigenvalue constraint attenuation imaging
Due to the “waveguide” property of the coal seam, channel wave is confined in coal seam. When structure of coal seam is disrupted, energy of channel wave transmitted through this area will decrease dramatically. Geological structures can be identified through the inversion of energy attention (Liu et al., 2019). However, in field test, the thickness of the coal seam in some erosion zones changes gradually, which makes it difficult to determine attenuation anomaly zones and the inversion result is not convergent.
Considering the problems above, an attenuation imaging method based on eigenvalue constraint of the channel wave is proposed. In this approach, eigenvalues are used to mark the development of the channel wave in every seismic record. Specifically, in a single shot record, seismic trace with well-developed channel waves are labeled with 3; seismic trace with suspected channel waves are labeled with 2; seismic trace without channel waves are labeled with 1; and seismic trace with no signals are labeled with 0. The algorithmic logic satisfying the commutative law is described as follows.
Calibration of eigenvalue based on the development of every receiving channel wave, a preliminary inversion result of the development of channel waves is obtained. At this point, the eigenvalue inversion model can be used to determine the area with and without channel wave development in the working face. And it can be used as an initial model for the attenuation of the channel wave amplitude. Using the eigenvalue inversion result as a constraint, the accuracy of the channel wave amplitude attenuation result is improved.
The amplitude attenuation of the channel wave follows the propagation characteristics of the cylindrical wave: the energy density decreases as the propagation distance, r, increases. The relationship between energy, the energy attenuation coefficient, and the propagation distance can be described as follows (Krey et al., 1982):
However, in an actual observation system, there is an angle between the vibrating and the sensing direction of geophone. Hence, considering the influence of the incident angle of the wave,
, the equation can be expressed as:
Assuming the attenuation coefficients of every grid on the pass way of the channel wave are
,
, …
, The following expression can be obtained by discretizing Eq. (3):
The equation can be rewritten as
If:
, ,
A matrix is obtained:
The above matrix is obtained based on the attenuation coefficient of a single track in a single shot seismic record. When the survey area has multiple tracks, assuming i is number of tracks and m is number of discrete grids, the Eq. (6) can be expressed as:
The attenuation coefficient matrix in Eq. (7) can be solved with the SIRT iterative algorithm. Different attenuation coefficients represent the development of different coal seams. The larger the attenuation is, the more likely that area is abnormal.
3 Numerical simulation
3.1 Numerical simulation
Three-dimensional simulation was conducted based on finite difference method. Fig. 1(a) shows a three-dimensional forward model for numerical simulation. The physical parameters, which satisfy the excitation conditions of Love channel wave, are listed in Table 1. A three-dimensional coordinate system is established with O as the origin, wherein the X-direction is tilt direction of coal seam, the Y-direction is strike direction of coal seam trend, and the Z-direction is perpendicular to the coal seam. The dimensions of the model in X-direction, Y-direction, and Z-direction are 200 m, 250 m, and 100 m, respectively. The size of grid at all three directions is 1 m. The coal seam is located at 45–50 m in the Z-direction with a thickness of 5 m. An erosion zone with a radius of 30 m is located at central position of the 3D model. As shown in Fig. 1(b), erosion zone completely breaks the coal seam and the disrupted area is uniformly filled by the surrounding rock. The layout of an observation system is shown in Fig. 1(c), in which the detectors are arranged linearly from (290 m, 0 m, 47.5 m) to (290 m, 500 m, 47.5 m) with a 10-m interval and the source is located at (5 m, 55 m, 47.5 m). The source frequency is 150 Hz. The boundary of the model set to be the PML absorption boundary (Meza-Fajardo and Papageorgiou, 2008).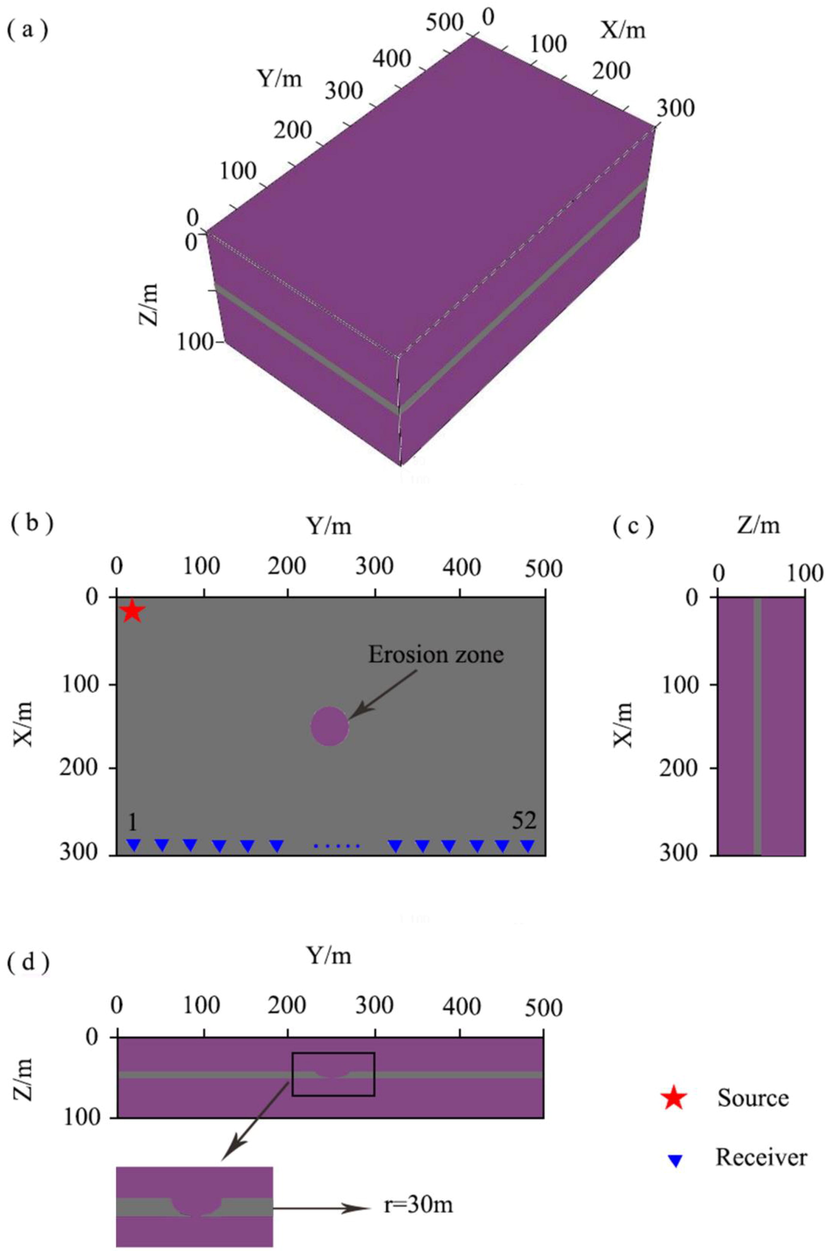
Numerical mode: (a) 3D-model diagram; (b) top view; (c) left view; (d) front view.
Medium
P-wave velocity (m/s)
S-wave velocity (m/s)
Density (kg/m3)
Surrounding rock
3000
1730
2200
Coal seam
2200
1270
1300
3.2 Seismic record
Fig. 2 is a three-component common-shot point gather. The in-phase axis 1 are P-waves with the velocity of about 3050 m/s; the in-phase axis 2 are shear waves with the velocity of about 1750 m/s; the in-phase axis 3 are Love channel waves and the velocity of Airy phase is about 1100 m/s; the in-phase axis 4 is a gather of waves diffracted by the erosion zone and the wavefront 5 are shear waves converted from Love channel waves (Liu et al., 1994). In the three-component seismic data, the channel waves disappear at the same position in in-plane axes, but they have good continuity in in-plane axes. Due to the influence of the axis effect (Deng, 2012), the Y-component shows an energy loss in the middle part of the seismic source. The Z-component wave amplitude is stronger than that of another component. However, due to the mixing of the in-plane axis and the shear wave, the signal-to-noise ratio of the Z-component is lower than that of other components. Besides, the amplitude of the channel waves in the Y-component is larger than that in the X-component.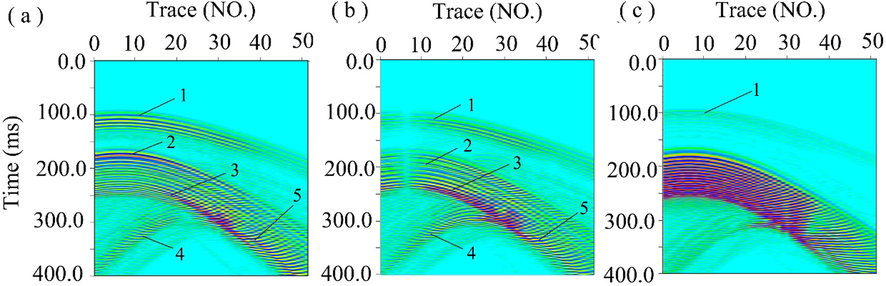
Three-component seismic records: (a) X-component seismic record; (b) Y-component seismic record; (c) Z-component seismic record.
The eigenvalue imaging and the energy attenuation imaging based on eigenvalue constraints are performed with the three-component seismic data is shown in Fig. 3. Comparing the inversion images of different components, it is concluded that the high attenuation anomaly region in the inversion image of the Y-component has good consistency with the erosion zone in the forward model; the X-component and the Z-component have poor convergence compared with the Y-component, and the size of anomaly regions in the X-component and the Z-component are smaller than that of the Y-component. In addition, the anomaly region in the Z-component has the smallest size and poor consistency with the erosion zone in the forward model. The eigenvalue constrained attenuation imaging method is better than the eigenvalue imaging method in terms of the convergence, and the outcomes of the eigenvalue constrained attenuation imaging of the Y-component exceeds that of the X-component and the Z-component. In summary, based on the signal-to-noise ratio, the energy of the channel wave, and the imaging quality, the Y-component is suitable for the detection of erosion zones in the working face.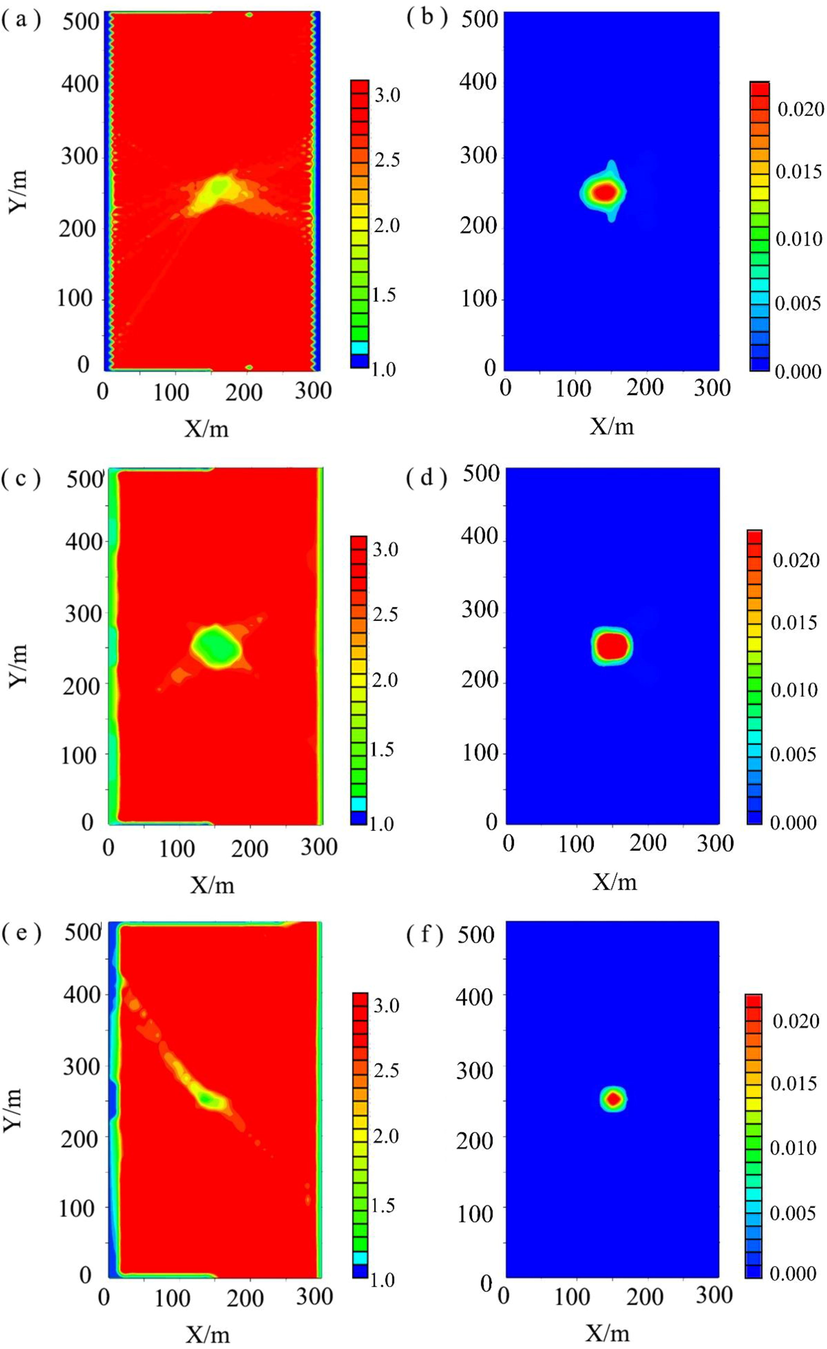
Attenuation tomography: (a), (c) and (e) are attenuation imagings of X-component, Y-component and Z-component signal using eigenvalues, respectively; (b), (d) and (f) are attenuation imagings of X-component, Y-component and Z-component signal with the constraint of channel wave energy using eigenvalues, respectively.
3.3 Three-dimensional wavefield analysis
Based on the conclusion of the above analysis, the snapshots of different wavefields in the Y-component are compared to evaluate their propagation characteristics, and these snapshots are shown in Fig. 4. Forty milliseconds after the excitation of the source, the longitudinal waves (wavefront 1) and shear waves (wavefront 2) show normal propagation patterns. Hundred twenty milliseconds after the excitation of the source, wavefront 1–5 are longitudinal waves, shear waves, channel waves, a diffracted wave group, and converted shear waves, respectively. When these seismic waves reach the erosion zone, the erosion zone has a small influence on the propagation of these waves. Some of these waves are diffracted and the rest of them continue to propagate forward. When Love-type channel waves encounter the interface of the erosion zone, a part of these Love-type channel waves propagate backward, and the rest is converted to shear waves (SH waves) inside the erosion zone, resulting in a partial loss of the waveform of channel waves. The converted shear waves continue to propagate forward. When encountering the interface of the coal seam, part of these shear waves propagates backward and the other continues to propagate forward. Different types of seismic waves are diffracted and form a diffracted wave group, as shown in wavefront 4. At 160 ms of propagation, the snapshot of the wavefield has no longitudinal waves and the waveform of channel waves still show the missing portion. The snapshot of the wavefield at 200 ms of propagation is similar to the one at 160 ms of propagation.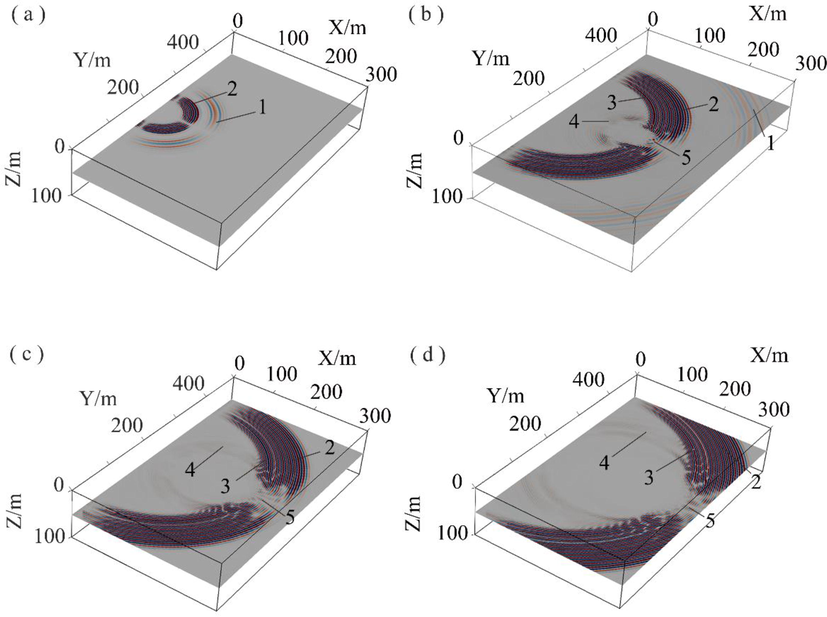
Snapshot slice of Y-component wave field: (a) Snapshot of wave field at 40 ms; (b) Snapshot of wave field at 120 ms; (c) Snapshot of wave field at 160 ms; (d) Snapshot of wave field at 200 ms.
According to the snapshots of the wavefield, the waveform of these channel waves is partially disappeared at 120 ms, 160 ms, and 200 ms. Besides, channel waves are not re-energized after encountered as the continuity of the coal seam has been destroyed by the erosion zone. When channel waves reach the erosion zone, part of these channel waves propagates backward in the coal seam in the form of diffracted waves and another part of these waves enter the erosion zone. As the coal seam has been replaced by other media, this geological condition does not satisfy the development of channel waves (Liu et al., 1994), and channel waves are converted into S-wave to propagate forward. When these S-wave reencounter the coal seam, these S-wave mainly propagate along the external medium of coal seam, and they are not able to interfere again to form strong channel waves. On the other hand, the erosion zone has little influence on the propagation of P-wave and S-wave. In the seismic record, the continuity of the event of P-wave and S-wave is not disrupted by the erosion zone. In addition, the wavefield snapshots of longitudinal waves and shear waves have no missing portions in their wavefields but some energy loss, which is due to diffraction.
3.4 Geological setting
To verify the reliability and practicability of the simulation result, a field test was carried out in Xiaoyun coal mine of Jining mining area, as shown in Fig. 5. The test was designed for the 1308 working face. The strike of the working face is 630 m, and the dip is 215 m. The average thickness of 3.47 m. According to the previous geophysical data and geological exposure, erosion zone is suspected to develop in the working face. The estimated area that influenced by the erosion zone is about 22,171 m2, where the average thickness of 1.7 m. To ensure safety during the mining process, the channel wave is needed to determine the extension of the erosion zone in the working face.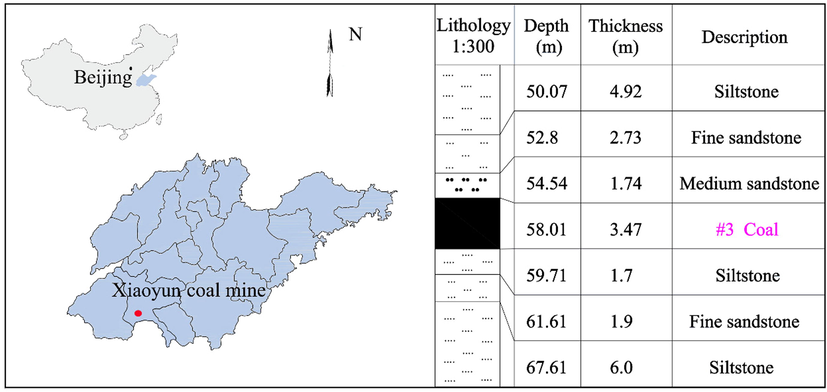
Geological profile.
3.5 Data analysis and discussion
3.5.1 Observation system
According to the actual conditions of the working face, geophones were arranged in the belt roadway, as shown in Fig. 6. A three-dimensional observation system was established with the R1 position as the coordinate origin. In this system, the X direction is vertical to coal seam side; the Y direction is normal to the roadway; the Z direction is vertical downward. Based on the numerical simulation result of the erosion zone model, the survey was carried out in the Y-axis direction. A total of 64 geophones, denoted as R1-R64, were arranged along Y-axis with an interval of 10 m. Explosive seismic sources were arranged in the track roadway. A total of 70 seismic sources, denoted as S1-S70, were installed with 10 m intervals. P1, P17, and P26 are inflection points and their coordinates are (125, 0), (125, 160), and (215, 160), respectively.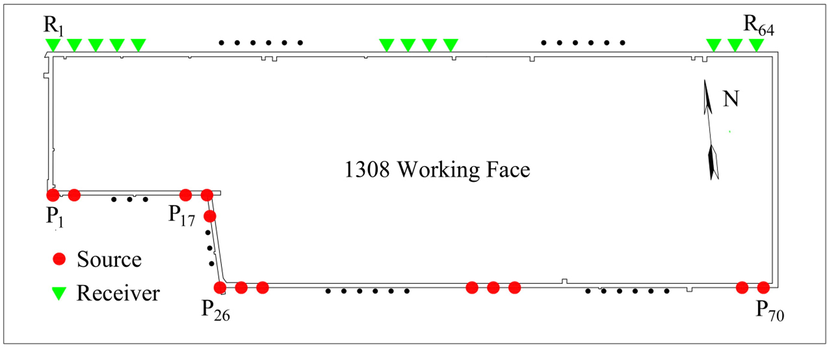
Observation system.
3.5.2 Data collection and analysis
The seismic sources were ignited in sequence. The original seismic data of the 3rd shot and the 30th shot are selected and shown in Fig. 7. Seismic event 1, 2 and 3 are P-waves, S-waves, and channel waves, respectively. The P-waves and S-waves are continuous, whereas the channel waves disappear between R35 and R64, indicating that there exists a structure leading to the change of coal seam thickness.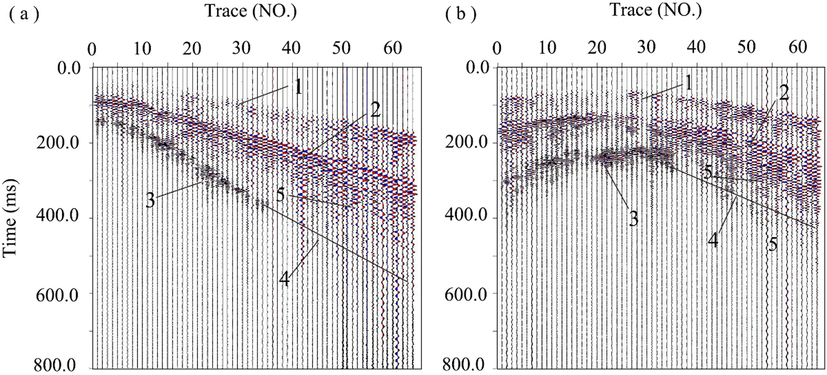
Primary seismic records.
After the initial correction, inter-channel equalization, and amplitude compensation of the obtained signals, the eigenvalue constraint attenuation tomography based on the variation in the amplitudes of the Airy phases of channel waves was carried out. The obtained inversion image was shown in Fig. 8. This image shows an abnormal region, denoted as YC1, which is located between 270 m 400 m of the belt roadway and between 350 m and 400 m of the track roadway, running through the entire working surface.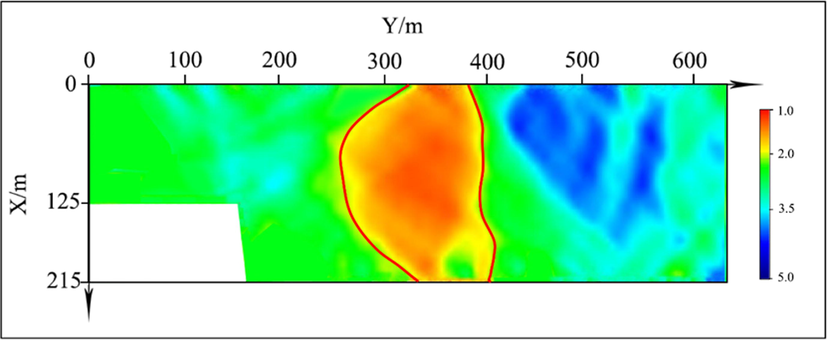
Inversion result.
Based on the field exploration data obtained from the mine, an abnormal area with a thinner coal seam is located at YC1. As shown in Fig. 9, the actual location of the abnormal area has a good agreement with the predicted location.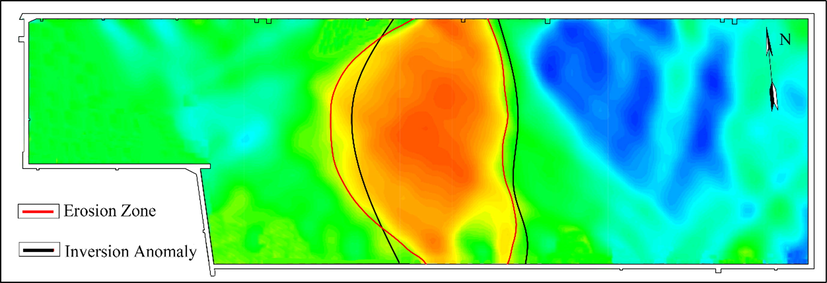
Mining geological exposure.
4 Conclusions
The numerical simulation of the erosion zone exploration with three-component transmitted channel waves reveals that the three-component transmitted longitudinal and shear waves have no obvious response to the erosion zone and cannot be used as characteristic waves for exploration. Moreover, the channel wave of Z-component is stronger than that of X-component and Y-component, but the signal-to-noise ratio of Z-component is the lowest; the channel wave of X-component has lower total energy than that of the Y-component; the Y-component of the channel wave is the best candidate for erosion zone exploration, because the event of it has high power and it can be easily distinguished.
Compared with single eigenvalue imaging method, the channel wave energy attenuation imaging method based on eigenvalue constraint has high precision. The high-attenuation anomaly region of the Y-component is consistent with the location of the erosion zone in the forward model. The sizes of the erosion zones in the inversion results of the X-component and the Z-component are smaller than that of the erosion zone in the model. Moreover, the inversion region obtained from the Z-component is the smallest.
A field survey was carried out by using the Y-component channel wave at the working face. On the basis of the transmitted channel wave of Y-component, the energy attenuation imaging method was employed to predict the location of the erosion zone. It is proved that this method provides technical support for safe and efficient mining of the working face.
Acknowledgment
This paper is supported by the National Natural Science Foundation of China (nos. 41604082, 51904270).
Declaration of Competing Interest
The authors declare that they have no known competing financial interests or personal relationships that could have appeared to influence the work reported in this paper.
References
- In-seam seismic love wave scattering modeled by the finite element method. Geophys. Prospect.. 1984;32(4):649-661.
- [Google Scholar]
- Love-type seam-waves in washout models of coal seam. Geophys. Prospect.. 1986;34(8):1167-1184.
- [Google Scholar]
- The propagation of attenuated SH channel waves. Geophys. Prospect.. 1978;26(1):16-28.
- [Google Scholar]
- The scattering of SH-channel waves by a fault in a coal seam. Geophys. Prospect.. 1986;34(3):343-365.
- [Google Scholar]
- In situ identification of high vertical stress areas in an underground coal mine panel using seismic refraction tomography. Int. J. Coal Geol.. 2015;149:55-66.
- [Google Scholar]
- Velocity analysis of the SH-channel wave in the schwalbach seam at ensdorf colliery 1. Geophys. Prospect.. 1988;36(3):298-317.
- [Google Scholar]
- Study on Nimerical Simulation of Whole-space Elastic Wave and Reverse Time Migration Imaging Method. China: University of Mining and Technology; 2012. (Ph.D thesis)
- Seam waves along multilayered coal seams, some case histories. In: 47th EAEG Meeting. 1985.
- [Google Scholar]
- Modelling of Rayleigh-type seam waves in disturbed coal seams and around a coal mine roadway. Geophys. J. Int.. 2007;170(2):511-526.
- [Google Scholar]
- Studies of roadway modes in a coal seam by dispersion and polarization analysis: a case history. Geophys. Prospect.. 1987;35(7):767-786.
- [Google Scholar]
- Channel waves as a tool of applied geophysics in coal mining. Geophysics. 1963;28(5):701-714.
- [Google Scholar]
- Theoretical and practical aspects of absorption in the application of in-seam seismic coal exploration. Geophysics. 1982;47(12):1645-1656.
- [Google Scholar]
- Application study of geostatistics to predicate washout zone in coal seam. J. China Coal Soc.. 2004;29(1):49-52.
- [Google Scholar]
- Modelling channel waves with synthetic seismograms in an anisotropic in-seam seismic survey. Geophys. Prospect.. 1992;40(5):513-540.
- [Google Scholar]
- In-seam Seismic Exploration. China University of Mining and Technology Press; 1994. p. :57-59.
- Method and test of mine seismic multi-wave and multi-component. J. China Coal Soc.. 2019;44(1):271-277.
- [Google Scholar]
- A nonconvolutional, split-field, perfectly matched layer for wave propagation in isotropic and anisotropic elastic media: stability analysis. Bull. Seismol. Soc. Am.. 2008;98(4):1811-1836.
- [Google Scholar]
- Coal Seam Scouring Zone Analysis Based on Seismic Attributes. Dalian University of Technology; 2012. (Ph.D thesis)
- Innovation progress and prospect on key technologies of intelligent coal mining. Ind. Mine Autom.. 2018;44(2):5-12.
- [Google Scholar]
- Channel wave tomography method and its application in coal mine exploration: An example from Henan Yima Mining Area. Chin. J. Geophys. (in Chinese). 2012;55(3):1054-1062.
- [Google Scholar]
- Polarization migration of three-component reflected waves under small migration aperture condition. Acta Geodynam. Geomater.. 2016;13(1):47-58.
- [CrossRef] [Google Scholar]
- Experimental study on the effect of gas pressure on ultrasonic velocity and anisotropy of anthracite. Geofluids. 2019;2019:1-10.
- [Google Scholar]
- Analysis on control action of geologic structure on rock burst and typical cases. J. China Coal Soc.. 2012;37(S2):263-268.
- [Google Scholar]
- Fine imaging by using advanced detection of reflected waves in underground coal mine. Earth Sci. Res. J.. 2019;23(1):93-99.
- [Google Scholar]
- Response of triaxial velocity and acceleration geophones to channel waves in a 1-m thick coal seam. J. Appl. Geophys.. 2019;166:112-121.
- [Google Scholar]


