

Therapeutic effect of dexmedetomidine on myocardial ischemia reperfusion injury in type 2 diabetic rat model under P13K/Akt pathway
⁎Corresponding author at: Departement of Cardiology, Northwest Women’s and Children’s Hospital of Xi’an Jiaotong University Health Science Center, No. 1616 Yanxiang Road, Xi’an 710061, Shaanxi, China. zengxinyanuhsc@126.com (Xinyan Zeng)
-
Received: ,
Accepted: ,
This article was originally published by Elsevier and was migrated to Scientific Scholar after the change of Publisher.
Peer review under responsibility of King Saud University.
Abstract
This research aims to study the therapeutic effect of dexmedetomidine on type 2 diabetic rats reperfusion injury model. A rat model of type 2 diabetes was induced by high-fat and high-sugar feed, and a reperfusion rat model was obtained by ligating the left anterior descending branch and reperfusion. The diabetic rat model sham operation group was used as the control group (DM-S), the rats were divided into diabetic reperfusion group (DM-IR) and dexmedetomidine treatment group (DM-D), dexmedetomidine combined with DM-DW (DM-DW), and Wortmannin treatment group (DM-W). In this study, the MB isoenzyme of creatine kinase (CK-MB) concentration was determined by ELISA competition method, superoxide dismutase (SOD) activity in rat plasma was detected by superoxide dismutase WST-1, and the content of malonaldehyde (MDA) in rat plasma was determined by thiobarbituric acid method. Besides, Western Blot was used to detect the expression changes of Akt, P-Akt, GSK-3β, and P-GSK-3β in rat myocardial tissue. The results showed that the content of CK-MB and SOD in DM-D group was significantly higher than that in DM-IR group (P < 0.05), and the content of MAD was significantly lower than that in DM-IR group (P < 0.05). The content of CK-MB and SOD in DM-DW group and DM-W group were significantly higher than that in DM-D group (P < 0.05), and the content of MDA was significantly lower than that in DM-D group (P < 0.05). However, expression of p-Akt and p-GSK-3β protein in DM-D group was significantly higher than that in DM-DW group and DM-W group (p < 0.05). Accordingly, dexmedetomidine can play a role in treating myocardial ischemia-reperfusion injury in type 2 diabetes by regulating the expression of related genes in the P13K/Akt signaling pathway.
Keywords
Type 2 diabetes
Myocardial ischemia reperfusion injury
P13K/Akt signaling pathway
Dexmedetomidine
GSK-3β

1 Introduction
Hu et al. (2017) supposed that Ischemic heart disease is a common acquired heart disease in middle and old age, which is coronary obstruction, vascular stenosis, obstructed coronary circulation and blood flow, insufficient myocardial blood supply caused by principles such as atherosclerotic lesions, and severe obstruction may lead to myocardial infarction. In clinical treatment of myocardial infarction, in addition to bypass surgery, reperfusion therapy is commonly used, that is, by thrombolytic drugs, interventional therapy or surgical treatment, the completely occluded blood vessel is reopened. Although some patients may spontaneously reperfusion, most patients have persistent thrombus occlusion. Reperfusion therapy is the most effective way to restore oxygen and blood supply to ischemic tissues. Later, Ye et al. (2017) found that the degree of tissue injury rapidly increased after the tissue cells that suffered ischemia for a certain period of time restored blood flow (reperfusion), which was clinically known as reperfusion syndrome. And Zhao et al. (2017a,b) found that the complex pathological process of ischemia-reperfusion injury may be related to the mechanisms of inflammation, oxidative stress, autophagy, mitochondrial function injury, calcium overload and apoptosis.
Through a large number of basic and clinical studies, it is found that the pretreatment and post-treatment of anesthetic drugs can reduce myocardial ischemia reperfusion injury and protect myocardial ischemia tissue. Studies Li and Liu (2017) show that ischemic post-treatment and ischemic preconditioning play a protective role on myocardium and are associated with the activation of reperfusion injury salvage kinase (RISK) during reperfusion. According to Kobayashi et al. (2018), due to the uncertainty of myocardial ischemia, anesthesia post-treatment refers to drug intervention before ischemia reperfusion, so it is widely used. Li et al. (2019) believed that Dexmedetomidine (DEX) is an α2 – adrenalin receptor agonist, which is clinically applicable for sedation of patients with intubation and ventilator during intensive care treatment. Later studies have found that DEX has a protective effect on the heart, especially in patients with myocardial infarction after reperfusion therapy, the postoperative cardiac complications were improved. Studies such as Ahmed et al. (2017) have found that DEX can slow down the heart rate by reducing the level of norepinephrine in plasma. In addition, it also has the effect of lowering blood pressure, reducing myocardial blood flow, reducing coronary artery diameter, and anti-inflammatory effect, so as to produce a certain protective effect on myocardium.
Type II diabetes is a chronic metabolic disease that occurs due to insufficient insulin secretion. Patients with type 2 diabetes have long-term hyperglycemia and lipid metabolism disorders with a series of complications, mainly cardiovascular complications. Therefore, in patients with acute myocardial infarction complicated with diabetes, changes in lipid deposition and myocardial fibrosis may affect the protective effect of drugs. At present, basic studies have confirmed that post-treatment with dexmedetomidine can improve myocardial ischemia reperfusion injury. However, there is a lack of studies on DEX in reperfusion therapy in diabetic patients. In view of this, in this experiment, the rat myocardial ischemia reperfusion model on the basis of the II diabetes model was established, so as to study the effect of DEX on the re-injection therapy of diabetic patients and its mechanism of action, and provide experimental evidence for the clinical use of diabetes patients.
2 Materials and methods
2.1 Method for establishing diabetic rat model
Forty healthy and clean Sprague-Dawley female rats of about 200 g were selected and provided by animal experimental center. Ten rats were randomly selected as the healthy control group, and the other 30 rats were used to establish the diabetes model. Normal rat feeding conditions were 25 °C constant temperature and 55% humidity. Rats were not restricted and could drink and eat freely. Diabetic rats were fed with normal diet for one week, and then SD rats were fed with ultraviolet sterilized high-fat and high-sugar diet (74.5% normal diet + 10% lard + 10% sugar + 5% yolk powder + 0.5% cholesterol). After 4 weeks of continuous feeding, all rats fasted overnight (12 h), and the weight of each rat was measured and recorded. Streptozostatin was injected into all rats by intraperitoneal injection to induce diabetes at a dose of 35 mg/kg. Tail tip blood was collected three days later to measure FBG. When the amount of water, food intake and urine of the rats increased and FBG was larger than 16.7 mmol/L, it indicated that the diabetic rat model was successfully established. The modeled diabetic rats were fed with high-fat and high-sugar diet for 4 weeks. The tail blood of the rats was collected weekly to measure FBG, and the rats with hyperglycemia (FBG > 16.7 mmol/L) were screened.
2.2 Method for establishing ischemia reperfusion model
Twenty-five successfully modeled type 2 diabetic rats were selected, each group consisted of five randomly selected rats, a total of five groups, as shown in Table 1 (Dexmedetomide was purchased from Jiangsu Nhwa Pharmaceutical Co., LTD, while Wortmannin was purchased from Sigma company in the United States). All rats fasted overnight and could drink water before ischemic surgery. Rats were anesthetized by intraperitoneal injection of 3% pentobarbital sodium (40 mg/kg, Sinopharm Chemical Reagent Co., Ltd), and their heads and limbs were fixed to lie on the operating table. The trachea was intubated and connected to the ventilator (parameters: 2.5 mL/100 g of tidal volume and 75 beat/min of respiratory rate). The right common carotid artery was separated and intubated, connected with Med-Lab system, and heart rate (HR) and average arterial pressure (MAP) were detected. Between the 3rd and 4th ribs at the left margin of the sternum, LAD was found by opening the chest cavity and separating the pericardium at 0.5 cm parasternal. A 4-0 mousse thread was used to ligate the LAD at the upper and middle 1/3 of the LAD. In addition, the electrode needle needs to be inserted into the limbs to monitor the electrocardiogram of the rat during the operation, and the ischemia can be judged according to the change of the electrocardiogram. If the ischemia was successful, the ST segment of the ECG was raised upwards. After 30 min of ischemia, the ligated wire was opened, and the reperfusion lasted for 120 min. After reperfusion, the ST segment of elevation fell back.
| Groups | Processing method |
|---|---|
| Diabetic sham operation group (DM-S group) | The LAD under thread was maintained for 150 min |
| Diabetic ischemia reperfusion group (DM-IR group) | At 25 min of ischemia, 0.5 mL of normal saline was injected into the tail vein, continued ischemia for 5 min, and reperfusion was conducted for 120 min |
| Diabetes dexmedetomidine group (DM-D group) | DEX was injected into tail vein with ischemia for 25 min at 10 μg/kg, followed by ischemia for 5 min and reperfusion for 120 min |
| Diabetes dexmedetomidine + wortmannin group (DM-DW group) | After 15 min of ischemia, wortmannin was injected into the tail vein at 15 μg /kg, and dexmedetomidine was injected into the tail vein at 25 min of ischemia at 10 μg/kg, ischemia was continued for 5 min, and reperfusion was conducted for 120 min |
| Diabetes wortmannin group (DM-W group) | Wortmannin was given to the tail vein after ischemia for 15 min at 15 μg/kg, 0.5 mL normal saline was injected into tail vein for 25 min after ischemia, ischemia was continued for 5 min, and reperfusion was conducted for 120 min |
2.3 Detection method of basic condition of rats
The body weight, water intake, food intake, activity and coat color and luster of the model rats were observed, and fasting blood glucose was detected. After 120 min of reperfusion, the rat heart was removed, rinsed and weighed to calculate the heart index (H/B, mg/g), as shown in Eq. (1).
2.4 Method for detecting CK-MB
After 120 min of reperfusion, 3 mL blood was taken from the common carotid artery of rats and centrifuged in a heparinized centrifuge tube (3500 rpm, 15 min). The plasma was the supernatant after centrifugation, which was stored at −80 °C. In this experiment, CK-MB concentration was determined by ELISA. The competition method could be used to determine antigens as well as antibodies. When detecting an antigen, the test antigen and the enzyme-labeled antigen competed for binding to the solid-phase antibody, and thus the amount of the enzyme-labeled antigen bound to the solid phase was inversely proportional to the amount of the test antigen. Standard substance and rat plasma were added to the enzyme-labeled wells pre-coated with antibodies, which were competitively combined with antibodies. After PBST washing, horseradish peroxidase (HRP) was added, and incubated at 37 °C for 1 h. HRP could specifically recognize the enzyme-labeled antigen and catalyze the transformation of TMB into blue and yellow under the action of acid, with the maximum absorption peak at 450 nm. The absorbance was inversely proportional to the CK-MB concentration. The experimental steps were as follows: firstly, standard products were diluted with PBST to different concentration gradients. Secondly, 50 μL diluted standard product and rat plasma were added to enzyme standard hole, and blank hole (only PBST diluent was added) was set. Thirdly, 50 μL L HRP was added to the standard hole and sample hole, gently shaken and mixed, covered with plate membrane, and incubated at 37 °C for 1 h. Fourthly, the liquid in the hole was discarded, the enzyme plate was cleaned with 300 μL detergent, and the plate was pat dry on absorbent paper. Fifthly, 50 μL chromogenic agent was added to each hole, shaken and mixed, and incubated at 37 °C for 10 min without light. Sixthly, 50 μL termination fluid was added to per hole. Seventhly, OD value of standard hole at the wavelength of 450 nm was measured with a microplate reader to obtain the standard linear regression curve (as shown in Fig. 1) and read CK-MB concentration.
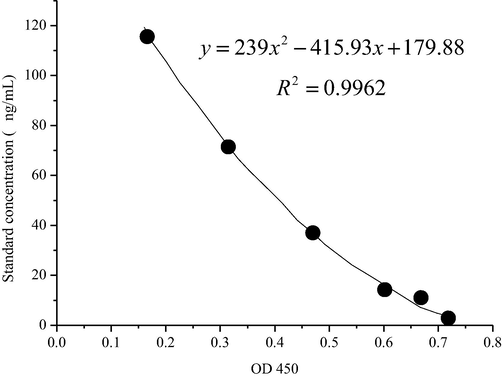
- Standard linear regression standard curve measured by competition method.
2.5 Method for detecting the activity of plasma SOD in rats
In this study, superoxide dismutase WST-1 method was used to detect the activity of SOD in rat plasma. SOD can catalyze the disproportionation of superoxide anion (O2•−) to generate hydrogen peroxide and elemental oxygen, which is an important antioxidant enzyme. The raw superoxide anion, catalyzed by xanthine oxidase, may react with water-soluble tetrazole salt (WST-1) to form blue formazan. Because SOD inhibited the above reactions, the OD value of formazan was inversely proportional to the activity of SOD. The test was carried out with the SODAssay Kit-WST kit (Nanjing Institute of Biological Engineering). The operation method is shown in Table 2, and the calculation formula of SOD activity is shown in Eqs. (2) and (3)
| Control hole | Control blank hole | Measuring hole | Measuring blank holes | |
|---|---|---|---|---|
| Sample to be tested (μL) | – | – | – | – |
| DdH2O (μL) | 20 | 20 | – | – |
| Enzyme working fluid (μL) | 20 | – | 20 | – |
| Enzyme diluent (μL) | – | 20 | – | – |
| Substrate application fluid (μL) | 200 | 200 | 200 | 200 |
The samples were mixed, incubated at 37 °C for 20 min, and read at 450 nm with a microplate reader.
2.6 Detection method of MDA in plasma
In this experiment, the MDA content in rat plasma was determined by TBA method. Oxygen free radicals acted on unsaturated fatty acids of lipids to form peroxidation lipids. The latter was broken down into a series of complex compounds, including MDA. The level of lipid oxidation can be obtained by detecting the level of MDA. In this study, thiobarbituric acid (TBA) method was adopted to determine MDA. TBA could condense with MDA to produce red substances, and had the maximum absorption peak at 532 nm. The operation method is shown in Table 3.
| Standard tube | Blank tube | Measuring tube | Control tube | |
|---|---|---|---|---|
| 10 nmol/mL standard (mL) | a* | |||
| Anhydrous ethanol (mL) | a* | |||
| Test sample (mL) | a* | a* | ||
| a* | a* | a* | a* | |
| Mix well (gently shake the test-tube stand) | ||||
| Reagent two (mL) | 3 | 3 | 3 | 3 |
| Reagent three (mL) | 1 | 1 | 1 | |
| 50% glacial acetic acid (mL) | 1 | |||
a* means that the sample quantity, standard quantity, anhydrous ethanol quantity and test dose are all equal.
The samples were mixed with a vortex mixer, the mouth of the test tube was tightly tied with fresh film, a small hole was pricked with a needle, and the water was boiled at 95 °C for 40 min. The sample was taken out and cooled by running water, then centrifuged at 3500–4000 rpm/min for 10 min. The supernatant was taken, and at 532 nm and a light path of 1 cm, the distilled water was adjusted to zero, and the absorbance values of the respective tubes were measured. The MDA concentration of plasma is calculated as Eq. (4).
2.7 Method for detecting tissue protein expression
First, the extraction of rat myocardial tissue protein. After 120 min of reperfusion, the rat heart was removed and rinsed clean. Then, 0.1 g of myocardial tissue was taken from the ischemic area of rats, and 1 mL of tissue lysate (including 10 μL PFSM) was added after being cut into pieces and lysed on ice for 20 min, and then fully ground in a precooled grinder. Next, the mixture was then transferred to the 1.5 mL EP tube and centrifuged at 12,000 RPM at 4 °C for 15 min to obtain the supernatant.
Second, the determination of protein concentration in the BCA kit. Bovine serum protein standard solution was prepared with 2 mg/mL and diluted with PBS for different concentration gradients (2 mg/mL, 1.5 mg/mL, 1 mg/mL, 0.75 mg/mL, 0.5 mg/mL, 025 mg/mL, and 0.125 mg/mL); BCA working fluid was configured according to the ratio of liquid A: liquid B = 50:1; 2 μL solution with different concentration gradients were added to the 96-well plate and 50 μL of BCA working fluid was added; the sample was diluted 10 times with PBS; 2 μL of diluted sample was put into the 96-well plate, and 50 μL of BCA working fluid was added; it was incubated at 37 °C for 30 min; OD value of the standard hole was measured at the wavelength of 562 nm with a microplate reader to obtain the standard curve (as shown in Fig. 2) and read the protein concentration.
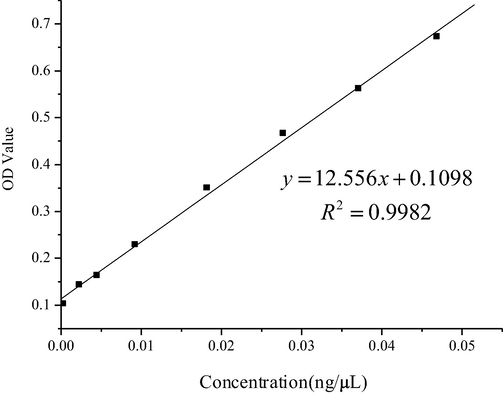
- Standard curve of standard solution by BAC method.
Third, SDS-PAGE electrophoresis. Some of the protein samples were taken, the lowest concentration was taken as the standard, and the lysate was added to adjust all the samples to a uniform concentration. 5× SDS buffer was added and diluted to 1×. The protein was thoroughly mixed and centrifuged at 12,000 rpm for 15 s, and heated in a 95 °C metal bath for 10 min to denature it.
According to the molecular weight of the target protein, the proper concentration of separation glue and concentrated glue was selected. The formula of separation glue and concentrated glue (with four pieces of glue) is shown in Table 4.
| Reagents | 12% separation glue (mL) | 5% concentrated glue (mL) |
|---|---|---|
| DdH2O | 3.30 | 6.80 |
| 30% Acr | 4.00 | 1.70 |
| Tris-HCL (1.5 mmol, PH8.8) | 2.50 | – |
| Tris-HCL (1.5 mmol, PH6.8) | – | 1.25 |
| 10% SDS | 0.10 | 0.10 |
| 10% ammonium persulfate | 0.10 | 0.10 |
| TEMED | 0.004 | 0.010 |
| Total volume | 100 | 10 mL |
The separation glue and concentrated glue suitable for protein size and concentration were prepared; the thick glass plate and the thin glass plate were fixed on the plastic glue rack and were checked for leakage; the separating glue between the two glass plates was slowly added to the middle of the green strip with a pipette gun; isopropanol was added to fill the pressure surface and left at room temperature for 25 min; the upper layer of isopropanol was poured, concentrated glue was added, and the comb was quickly inserted after overflow, and placed at room temperature for 20 min; the comb was pulled out slowly and horizontally, and the glass plate was installed on the electrophoretic splint and placed into the electrophoretic tank. Note that the clip should not be inversely connected to the anode and cathode of the tank; 1x electrophoretic buffer was added to the tank and soaked in glue; 2 μL of Marker protein was added and sampled, with 4 μL per well; the sample was electrophoresed at 75 V for 30 min; after the sample was separated by the separation rubber, the separation gel condition was converted, and 100 V electrophoresis was performed for 60 min.
Fourth, transfer film. PVDF membrane of corresponding size was cut and immersed in 100% methanol solution for 10 s, in deionized water for 3 min, and in transfer buffer for 3 min; separating glue was cut; as shown in Fig. 3, the film transfer clip was installed. Note that the sponge filter paper had been soaked with 1× transfer solution, and there should be no bubbles in the film spreading process; the transfer film splint was installed in the electric transfer groove. Please pay attention to the corresponding positive and negative poles; it was put into an ice box to prevent the gel from melting at too high temperature during the film transfer process. The film transfer conditions were constant flow of 100 V and 120 min (Fig. 4).
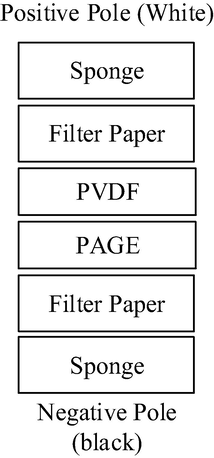
- Sandwich structure diagram of power transfer.
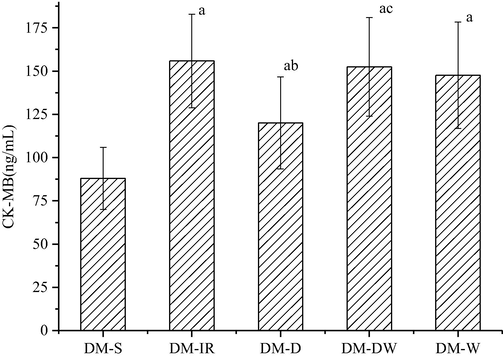
- Changes in CK-MB in plasma of rats in each group.
Fifth, antibody incubation. PVDF membrane was rinsed with deionized water. At room temperature, it was put into 3% skim milk powder for covering for 30 min. The membrane was washed with washing liquid for 3 times, each time for 5 min; the primary antibody was configured with TBST solution, and the concentrations of Akt, p-Akt, GSK-3β, p-GSK-3β, and β-actin were all 1:1000 with TBST solution. The antibody was placed in a rocking bed at room temperature at 60 rpm/min for 1 h or 4 °C overnight; the membrane was washed with washing liquid for 3 times at room temperature, each time for 5 min; TBST solution was used to prepare the secondary antibody, the sheep anti-rabbit IgG antibody (1:10,000), the sheep anti-mouse IgG antibody (1:2000), and the horizontal shaking bed was set as 100 rpm/min at room temperature for 1 h; the membrane was washed with washing solution 3 times at room temperature, each time for 5 min.
Sixth, exposure. The prepared DAB color rendering liquid was added, and the liquid was gently shaken at room temperature to observe the color reaction. Once the color depth of the specific protein band reached the requirements, the color reaction was terminated by deionized water rinsing, and the exposure was made by the developer. Image Lab software was used to analyze the gray value of the band.
2.8 Statistical method
SPSS21.0 statistical software was adopted, and mean ± standard deviation was adopted to represent the experimental data. T-test was used for comparison between the two groups, and one-way ANOVA was used for comparison between multiple groups. When P < 0.05, the difference was statistically significant.
3 Results
3.1 Modeling results of rats
The body weight (BW) of the rats in the two groups was measured, and statistical analysis showed that BW of the diabetic rats was significantly reduced compared with healthy group, with statistical significance (P < 0.01). The whole heart mass (HW) of diabetic rats was significantly reduced, which was statistically significant (P < 0.01). Biochemical test results on the blood of rats in the two groups showed that the increase of FBG, TC, and TG in the diabetic group were significantly increased, with statistical significance (P < 0.01), as shown in Table 5. Through observation, it was found that the amount of water, food intake and urine in the diabetic group were increased, the spirit was poor, the activity was decreased, and the hair color was easy to fall off. According to the above statistical analysis, a total of 25 successfully modeled diabetic rats were selected in this experiment.
| Items | Health group | Diabetes group |
|---|---|---|
| BW (g) | 371 ± 27 | 315 ± 34** |
| HW (g) | 1.22 ± 0.04 | 1.02 ± 0.20** |
| H/B (%) | 3.28 ± 0.02 | 3.37 ± 0.03 |
| FBG (mmol/L) | 5.89 ± 0.78 | 25.25 ± 2.61** |
| TC (mmol/L) | 1.78 ± 0.33 | 3.64 ± 0.75** |
| TG (mmol/L) | 0.82 ± 0.09 | 3.03 ± 0.77** |
3.2 Test results of CK-MB
CK-MB is a sensitive index for the diagnosis of myocardial infarction and it is usually used for the early diagnosis of acute myocardial infarction. Wortmannin is an effective and specific phosphatidylinositol 3-kinase (Pl3-K) inhibitor. In this experiment, CK-MB in the blood of five groups of rats was measured by the competition method, and the results are shown in Table 6. The experimental results showed that compared with the DM-S group, the content of CK-MB in plasma in the other groups was significantly increased, with statistical significance (P < 0.05). Among them, the increase of CK-MB content in DM-W group. Compared with the DM-IR group, the content of CK-MB in the DM-D group was significantly lower (P < 0.05). Compared with the DM-D group, the content of CK-MB increased in the DM-DW group, which was statistically significant (P < 0.05).
3.3 Test results of SOD and MDA
SOD is a powerful antioxidant, which is mainly used to remove active oxygen free radicals in the body. MDA is the product of lipid peroxidation, and its content in blood can reflect the degree of lipid peroxidation of cell membrane. In this experiment, SOD and MDA levels in the blood of rats were detected to study the oxidative stress response in myocardial tissue after ischemia reperfusion. The results are shown in Tables 7, 8 and Fig. 5. The experimental results showed that compared with the DM-S group, the plasma SOD activity was reduced and MDA content was significantly increased in the other groups (P < 0.05). Compared with the DM-IR group, SOD activity was increased and MDA content was significantly reduced in the DM-D group (P < 0.05). Compared with the DM-D group, SOD activity was decreased and MDA content was significantly increased in the DM-DW group (P < 0.05).
| Group | Contents of SOD (U/mL) |
|---|---|
| DM-S | 122.75 ± 11.86 |
| DM-IR | 79.62 ± 11.77a |
| DM-D | 100.95 ± 17.03a,b |
| DM-DW | 84.78 ± 10.39a,c |
| DM-W | 89.44 ± 7.93a |
| Groups | Contents of MDA (nmol/mL) |
|---|---|
| DM-S | 5.33 ± 1.08 |
| DM-IR | 10.37 ± 1.92a |
| DM-D | 7.83 ± 1.43a,b |
| DM-DW | 9.85 ± 1.44a,c |
| DM-W | 9.66 ± 2.31a |
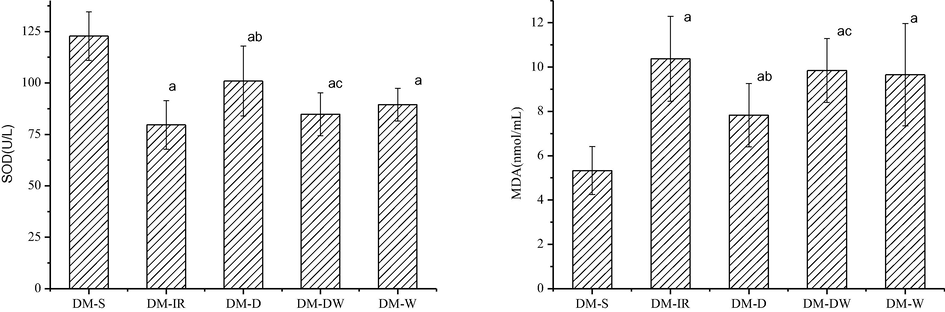
- Changes of SOD and MDA levels in plasma of rats in each group aP < 0.05 vs DM-S; bP < 0.05vs DM-IR; cP < 0.05 vs DM-D.
3.4 Expression results of p-Akt and p-GSK-3β proteins in rat myocardium
The contents of p-Akt and Akt in rat myocardial tissue are shown in Fig. 6, and the experimental results are shown in Fig. 7. Compared with DM-S group, p-Akt/Akt ratio in the other groups significantly increased, with statistical significance (p < 0.05). Compared with DM-IR group, the p-Akt/Akt ratio of DM-D group was significantly increased, which was statistically significant (P < 0.05). Compared with DM-D group, p-Akt/Akt ratios in DM-DW group and DM-W group were significantly lower, with statistical significance (p < 0.05).
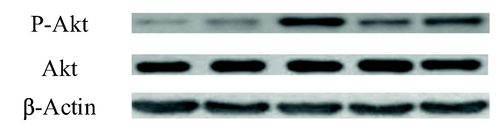
- Contents of p-Akt and Akt in rat myocardial tissue.
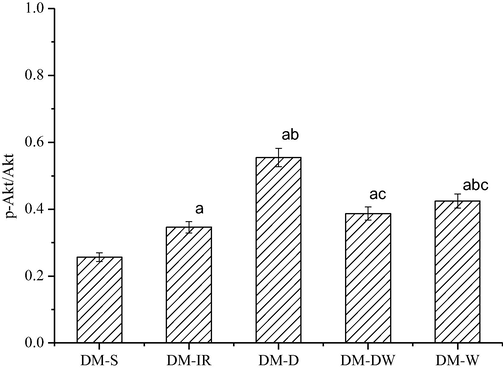
- Statistics for p-Akt/Akt ratio in each group.
The contents of p-GSK-3β and GSK-3β in rat myocardial tissue are shown in Fig. 8, and the experimental results are shown in Fig. 9. The experimental results showed that compared with DM-S group, the ratio of p-GSK-3β/GSK-3β in the DM-D group was significantly increased with statistical significance (p < 0.05), but there was no significant difference in the other three groups. Compared with the DM-IR group, the ratio of p-GSK-3β/GSK-3β in the DM-D group was significantly increased with statistical significance (p < 0.05). Compared with the DM-D group, the ratio of p-GSK-3β/GSK-3β in the DM-DW group and the DM-W group was significantly reduced, which was statistically significant (p < 0.05).
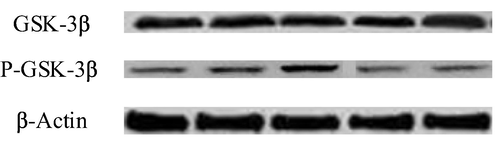
- Contents of p-GSK-3β and GSK-3β in rat cardiac tissue.
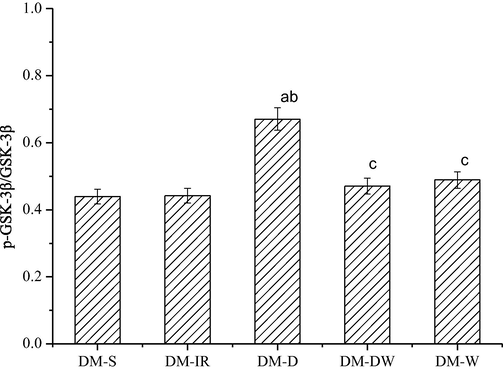
- Statistics of the ratio of p-GSK-3β/GSK-3β in each group.
4 Discussion
According to Zhao et al. (2017a,b), CK-MB is usually higher in the blood of patients with myocardial infarction, which is an indicator for clinical examination of the disease. In this study, CK-MB contents in the blood of four groups of rats with reperfusion ischemia were detected. It was found that compared with the DM-IR group, the CK-MB content of the DM-D group showed a significant downward trend, suggesting that ischemic preconditioning with dexmedetomidine in diabetic rats could alleviate myocardial reperfusion injury to a certain extent. Xue et al. (2017) found that in patients with type 2 diabetes, oxidative stress in the body can be directly or indirectly activated due to the high blood sugar insulin resistance pathological characteristics, so the tissue damage in the ischemic area is often aggravated after reperfusion therapy. SOD is the main antioxidant to remove oxygen free radicals in the body, while MDA is the final product of lipid peroxidation. Therefore, SOD and MDA are usually used to reflect the oxidative stress level of tissues in clinical practice. In this research, through the analysis of these two indicators, it was found that compared with the DM-S group, the oxidative stress level of the four groups after reperfusion treatment was increased. Compared with the DM-IR group, SOD content in the DM-D group increased significantly and MDA content decreased significantly, indicating that dexmedetomidine after ischemia treatment could inhibit oxidative stress response to some extent. Dong et al. (2017) randomly divided Sprague-Dawley rats into four groups: ischemic preconditioning group, sham surgery group, dexmedetomidine group, and ischemic reperfusion injury group to evaluate the effects of dexmedetomidine on myocardial ischemia-reperfusion injury in aging rats. The results showed that SOD activity decreased and MDA increased in the homogenization of myocardial tissue in the ischemic reperfusion injury group (P < 0.05), and SOD activity decreased and MDA increased in the dexmedetomidine group compared with the ischemic reperfusion group (P < 0.05); dexmedetomidine preconditioning can effectively reduce ischemia reperfusion injury in elderly rats and has a protective effect on the heart of elderly rats [10], which is consistent with the results in the study.
RISK pathway mainly includes BPI3K/Akt pathway and Erk1/2 pathway, according to Yi et al. (2017). In this paper, the control group was set with wortmannin, an inhibitor of PI3K. Compared with DM-D group, the CK-MB content and MDA content of DM-DW group and DM-W group were significantly increased, and SOD content was significantly decreased, suggesting that DEX may act on the PI3K/Akt pathway. Then, the contents of p-Akt and p-GSK-3β proteins involved in the BPI3K/Akt pathway in myocardial tissue were quantitatively analyzed, and it was found that the contents of these two proteins were significantly increased in the DM-D group. Compared with the DM-D group, the protein content in the DM-DW group and DM-W group was significantly reduced, which proved that DEX acted on the PI3K/Akt pathway. Cheng et al. (2016) explored the effects of dexmedetomidine post-treatment on myocardial ischemia and the role of PI3K/Akt-dependent signaling pathway in reperfusion injury. The results suggested that similar to ischemic postconditioning, post-ischemic treatment with DEX protected the heart from I/R through a PI3K/Akt-dependent signaling pathway, possibly by activating GSK-3β, which is consistent with the results of the study.
In conclusion, dexmedetomidine can be used in ischemic preconditioning, inhibit oxidative stress response to a certain extent, and play a role in myocardial ischemia-reperfusion injury in type 2 diabetes by regulating the expression of related genes in the P13K/Akt signaling pathway. In addition to diabetes, there may be other kinds of diseases such as hyperlipidemia that cause myocardial infarction. Therefore, whether the reperfusion therapy of DEX is equally effective in patients with other kinds of diseases needs to be further studied. In this study, only one of the PI3K/Akt pathways was studied, but whether DEX ACTS on another Erk1/2 pathway remains to be studied. The specific effect of DEX on upstream and downstream substances when acting on the PI3K/Akt pathway remains to be studied. In the future, the Erk1/2 pathway of DEX would be further studied.
Acknowledgement
This work was supported by Shaanxi Provincial Health Scientific Research Fund project (project no.: 2018D038).
Declaration of Competing Interest
The authors declare that they have no known competing financial interests or personal relationships that could have appeared to influence the work reported in this paper.
References
- 168 Cardioprotective role of fingolimod in ischemia-reperfusion injury by activation of akt/erk pathways in rat model. Heart. 2017;103(5) 119–119
- [Google Scholar]
- Effects of dexmedetomidine postconditioning on myocardial ischemia and the role of the PI3K/Akt-dependent signaling pathway in reperfusion injury. Mol. Med. Rep.. 2016;14(1):797-803.
- [Google Scholar]
- The effects of dexmedetomidine preconditioning on aged rat heart of ischaemia reperfusion injury. Res. Vet. Sci.. 2017;114:489-492.
- [Google Scholar]
- Effect of dexmedetomidine post conditioning on myocardial ischemia-reperfusion injury and inflammatory response in diabetic rats. J. Southern Med. Univ.. 2017;37(11):1506-1511.
- [Google Scholar]
- Dexmedetomidine preserves the endothelial glycocalyx and improves survival in a rat heatstroke model. J. Anesthesia. 2018;1(3):1-6.
- [Google Scholar]
- The effect of dexmedetomidine on oxidative stress response following cerebral ischemia-reperfusion in rats and the expression of intracellular adhesion molecule-1 (ICAM-1) and S100B. Med. Sci. Monit.. 2017;23(13):867-873.
- [Google Scholar]
- Protective effects and mechanisms of shenhua tablet on toll-like receptors in rat model of renal ischemia-reperfusion injury. Chin. J. Integrative Med.. 2019;1(1):37-44.
- [Google Scholar]
- Protective effects of betaine on ischemia-reperfusion injury through ROS pathway in rat. Chin. J. Pharmacol. Toxicol.. 2017;5:94-95.
- [Google Scholar]
- Fasudil attenuates mitochondrial injury and apoptosis in rat model of myocardial ischemia/reperfusion injury. XI Bao Yu Fen Zi Mian Yi Xue Za Zhi. 2017;33(7):909-914.
- [Google Scholar]
- Dual roles of IL-22 at ischemia-reperfusion injury and acute rejection stages of rat allograft liver transplantation. Oncotarget. 2017;8(70):115384-115397.
- [Google Scholar]
- The role of glycogen synthase kinase 3 beta in brain injury induced by myocardial ischemia/reperfusion injury in a rat model of diabetes mellitus. Neural Regener. Res.. 2017;12(10):1632-1639.
- [Google Scholar]
- Magnesium isoglycyrrhizinate protects against renal–ischemia–reperfusion injury in a rat model via anti–inflammation, anti–oxidation and anti–apoptosis. Mol. Med. Rep.. 2017;16(3):3627-3632.
- [Google Scholar]


