

Translate this page into:
Theoretical modeling for predicting the activities of some active compounds as potent inhibitors against Mycobacterium tuberculosis using GFA-MLR approach
⁎Corresponding author. shola4343@gmail.com (Shola Elijah Adeniji)
-
Received: ,
Accepted: ,
This article was originally published by Elsevier and was migrated to Scientific Scholar after the change of Publisher.
Peer review under responsibility of King Saud University.
Abstract
Tuberculosis (TB) is of one the most infectious disease caused by Mycobacterium tuberculosis which remains a serious public health problem. Emergence of multi-drug resistant strains of M. tuberculosis led to development of new and more potent anti-tuberculosis agents. The aim of this study was to correlate the chemical structures of the inhibitory compounds with their experimental activities. In this study, analogs of 2,4-disubstituted quinoline derivatives as potent anti-tubercular agents was subjected to quantitative structure–activity relationship (QSAR) analysis in order to build a QSAR model for predicting the activities of these compounds. In order to build the regression model, Genetic Function Approximation (GFA) and Multi-linear Regression approach were used to predict the activities of inhibitory compounds. Based on the prediction, the best validation model was found to have squared correlation coefficient (R2) of 0.9367, adjusted squared correlation coefficient (R2 adj) value of 0.9223 and cross validation coefficient ( ) value of 0.8752. The chosen model was subjected to external validations and the model was found to have (R2 test) of 0.8215 and Y-randomization Coefficient (c ) of 0.6633. The proposed QSAR model provides a valuable approach for designing more potent anti-tubercular agents.
Keywords
Anti-tuberculosis
Applicability domain
Genetic Function Algorithm
Multi-linear Regression
QSAR

1 Introduction
Tuberculosis still remains a major infectious disease which causes human mortality. World Health Organization (WHO) estimates a marked increase in TB infections of 1.5 million deaths in 2014. Moreover, a marked increase of 6% in the TB incidence was reported in 2014 compared with the numbers reported in 2013 (Organization, 2016).
The widespread use of chemotherapeutics has resulted in the emergence of drug-resistant mutants that pose a continuing challenge to design new active compounds. The resistances of the M. tuberculosis toward the current drugs; isoniazid, rifampicin and enthambutol led to development of new approach that is fast and precise which could able to predict the biological activity for the new compounds against M. tuberculosis.
Quantitative structure activity relationships (QSARs), one of the most widely used computational method help in drug designing and prediction of drugs activities (Hansch et al., 2001). QSAR model is a mathematical linear equation which relates the molecular structures of the compounds and their biological activities. In this research, a data set of 2,4-diquinoline derivatives which had been synthesized and evaluated as anti-mycobacterium tuberculosis (Nayyar and Jain, 2008) have been selected for QSAR study. Few researchers; (Eric et al., 2016, n.d.; Joshi et al., 2014; Ogadimma and Adamu, 2016; Sharma et al., 2012) have carried QSAR studies to established relationship between some inhibitory compounds like Quinolone, chalcone, pyrrole and 7-methyijuglone. However QSAR study has not been established to relate the structures and activities of 2,4-disubstituted quinoline derivatives as potent anti-tubercular agents. Therefore, this study aimed to build a valid QSAR model that could predict the activities of 2,4-diquinoline derivatives against mycobacterium tuberculosis.
2 Materials and methods
2.1 Data collection
Analogs of molecules of 2,4-disubstituted quinoline derivatives as potent anti-tubercular agents that were used in this studies were gotten from the literature (Nayyar and Jain, 2008).
2.2 Biological activities (pEC50)
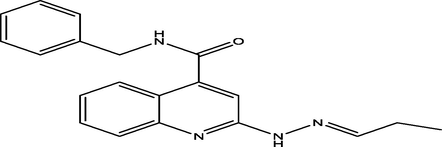
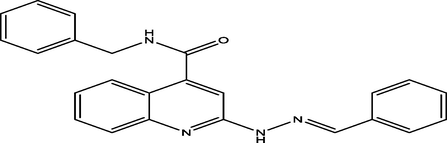
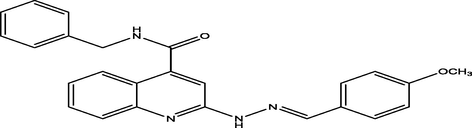
The Biological activities of 2,4-disubstituted quinoline derivatives as potent anti-tubercular agents were initially expressed in percentage (%) and then converted to logarithm unit using Eq. (1) below in order to increase the linearity and approach normal distribution of the activity values. The observed structures and the biological activities of these compounds were presented in Table 1.
Where superscript a represent the test set.
S/N
IUPAC name
Molecular structure
Activity (%)
Activity (pA)
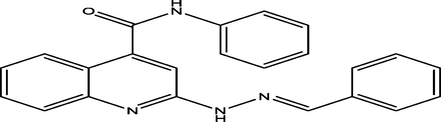
1a
(E)-N-phenyl-2-(2-(pyridin-4-ylmethylene)hydrazinyl)quinoline-4-carboxamide
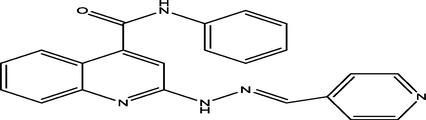
14
6.9809
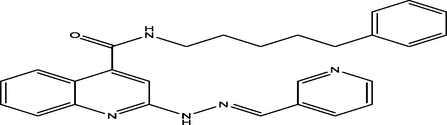
2
(E)-N-phenyl-2-(2-(pyridin-3-ylmethylene)hydrazinyl)quinoline-4-carboxamide

10
6.8150
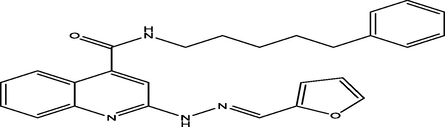
3
(E)-2-(2-(furan-2-ylmethylene)hydrazinyl)-N-phenylquinoline-4-carboxamide
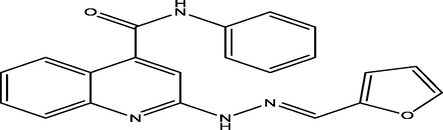
10
6.8018
4 a
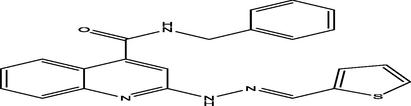
(E)-N-phenyl-2-(2-(thiophen-2-ylmethylene)hydrazinyl)quinoline-4-carboxamide

26
7.3209
5 a
(E)-2-(2-(2-methylpropylidene)hydrazinyl)-N-phenylquinoline-4-carboxamide
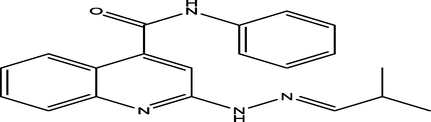
11
6.8191
6
(E)-N-phenyl-2-(2-propylidenehydrazinyl)quinoline-4-carboxamide
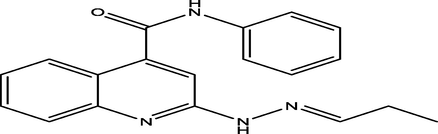
12
6.8418
7 a
(E)-2-(2-benzylidenehydrazinyl)-N-phenylquinoline-4-carboxamide
11
6.8601
8 a
(E)-2-(2-(4-methoxybenzylidene)hydrazinyl)-N-phenylquinoline-4-carboxamide
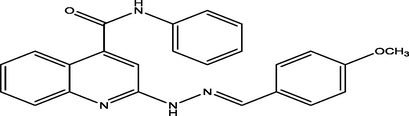
99
9.4979
9
(E)-2-(2-(4-methoxybenzylidene)hydrazinyl)-N-phenylquinoline-4-carboxamide
14
6.9772
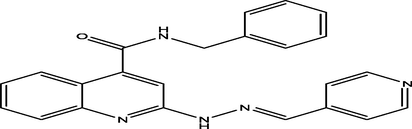
10
(E)-N-benzyl-2-(2-(pyridin-3-ylmethylene)hydrazinyl)quinoline-4-carboxamide
23
7.2608
11
(E)-N-benzyl-2-(2-(furan-2-ylmethylene)hydrazinyl)quinoline-4-carboxamide

20
7.1707
12 a
(E)-N-benzyl-2-(2-(thiophen-2-ylmethylene)hydrazinyl)quinoline-4-carboxamide
30
7.4233
13
(E)-2-(2-(anthracen-9-ylmethylene)hydrazinyl)-N-benzylquinoline-4-carboxamide
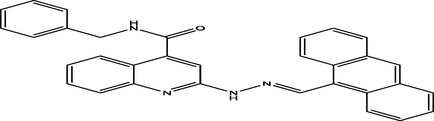
20
7.2838
14
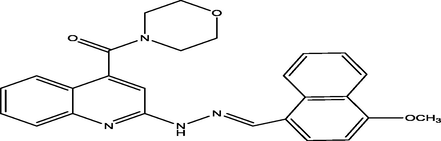
(E)-N-benzyl-2-(2-((4-methoxynaphthalen-1-yl)methylene)hydrazinyl)quinoline-4-carboxamide
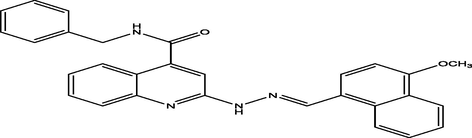
16
7.1472
15
(E)-N-benzyl-2-(2-(2-methylpropylidene)hydrazinyl)quinoline-4-carboxamide
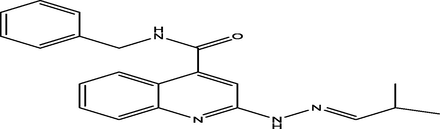
42
7.6035
16
(E)-N-benzyl-2-(2-propylidenehydrazinyl)quinoline-4-carboxamide
27
7.2938
17
(E)-N-benzyl-2-(2-benzylidenehydrazinyl)quinoline-4-carboxamide
99
9.6090
18
(E)-N-benzyl-2-(2-(4-methoxybenzylidene)hydrazinyl)quinoline-4-carboxamide
21
7.2630
19
(E)-N-(5-phenylpentyl)-2-(2-(pyridin-4-ylmethylene)hydrazinyl)quinoline-4-carboxamide
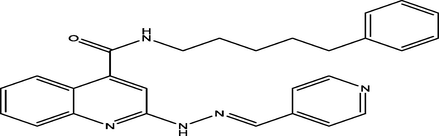
30
7.4772
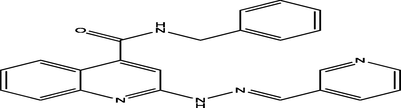
20
(E)-N-(5-phenylpentyl)-2-(2-(pyridin-3-ylmethylene)hydrazinyl)quinoline-4-carboxamide
10
6.8909
21
(E)-2-(2-(furan-2-ylmethylene)hydrazinyl)-N-(5-phenylpentyl)quinoline-4-carboxamide
15
7.0807
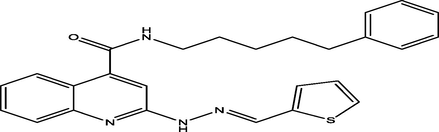
22
(E)-N-(5-phenylpentyl)-2-(2-(thiophen-2-ylmethylene)hydrazinyl)quinoline-4-carboxamide
21
7.2747
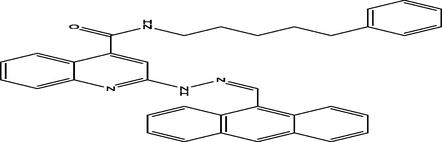
23
(Z)-2-(2-(anthracen-9-ylmethylene)hydrazinyl)-N-(5-phenylpentyl)quinoline-4-carboxamide
23
7.4091
24
(E)-2-(2-((4-methoxynaphthalen-1-yl)methylene)hydrazinyl)-N-(5-phenylpentyl)quinoline-4-carboxamide
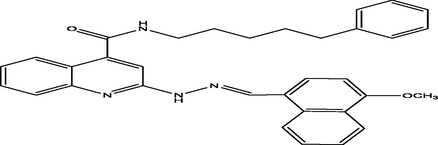
40
7.7412
25 a
(E)-2-(2-(2-methylpropylidene)hydrazinyl)-N-(5-phenylpentyl)quinoline-4-carboxamide
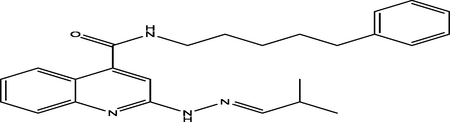
42
7.6688
26 a
(E)-2-(2-benzylidenehydrazinyl)-N-(5-phenylpentyl)quinoline-4-carboxamide
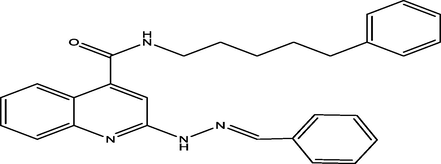
21
6.2688
27
(E)-2-(2-(4-methoxybenzylidene)hydrazinyl)-N-(5-phenylpentyl)quinoline-4-carboxamide
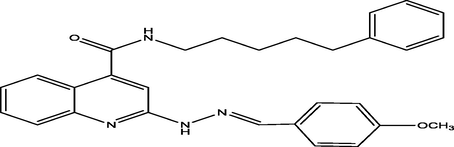
40
7.6970
28
(E)-(2-(2-((4-methoxynaphthalen-1-yl)methylene)hydrazinyl)quinolin-4-yl)(morpholino)methanone
7
6.7741
29
(E)-(2-(2-benzylidenehydrazinyl)quinolin-4-yl)(morpholino)methanone
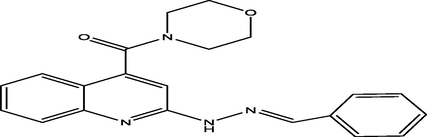
3
6.2513
30
(E)-(2-(2-(4-methoxybenzylidene)hydrazinyl)quinolin-4-yl)(morpholino)methanone
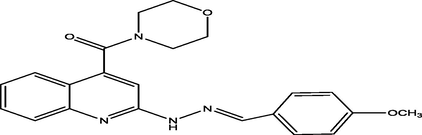
10
6.8414
31 a
(E)-(4-methylpiperazin-1-yl)(2-(2-(pyridin-3-ylmethylene)hydrazinyl)quinolin-4-yl)methanone
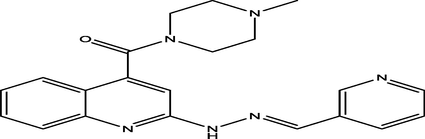
1
5.8000
32
(E)-(4-methylpiperazin-1-yl)(2-(2-(pyridin-4-ylmethylene)hydrazinyl)quinolin-4-yl)methanone
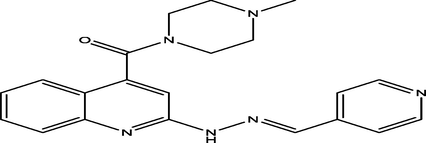
28
7.3673
33
(E)-(2-(2-(furan-2-ylmethylene)hydrazinyl)quinolin-4-yl)(4-methylpiperazin-1-yl)methanone
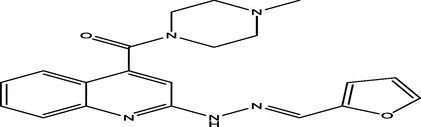
21
7.1891
34
(E)-(4-methylpiperazin-1-yl)(2-(2-(thiophen-2-ylmethylene)hydrazinyl)quinolin-4-yl)methanone
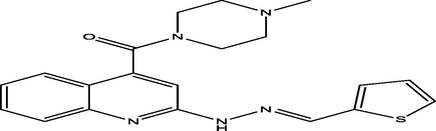
10
6.8291
35
(E)-(2-(2-(anthracen-9-ylmethylene)hydrazinyl)quinolin-4-yl)(4-methylpiperazin-1-yl)methanone
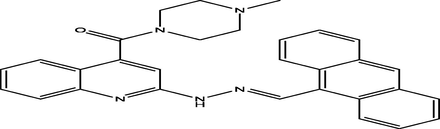
10
6.9253
36 a
(E)-(2-(2-((4-methoxynaphthalen-1-yl)methylene)hydrazinyl)quinolin-4-yl)(4-methylpiperazin-1-yl)methanone
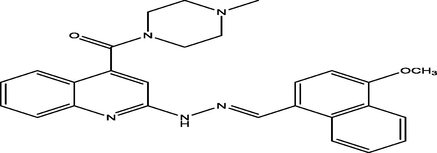
18
7.2022
37
(E)-(4-methylpiperazin-1-yl)(2-(2-(2-methylpropylidene)hydrazinyl)quinolin-4-yl)methanone
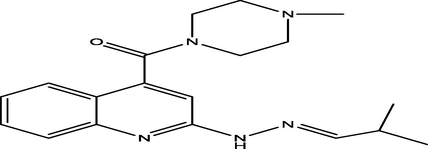
52
7.7696
38 a
(E)-(4-methylpiperazin-1-yl)(2-(2-propylidenehydrazinyl)quinolin-4-yl)methanone
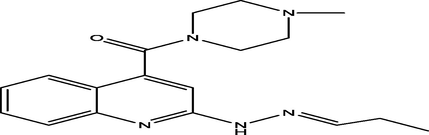
6
6.5216
39
(E)-(2-(2-benzylidenehydrazinyl)quinolin-4-yl)(4-methylpiperazin-1-yl)methanone

9
6.7716
40
(E)-(2-(2-(4-methoxybenzylidene)hydrazinyl)quinolin-4-yl)(4-methylpiperazin-1-yl)methanone
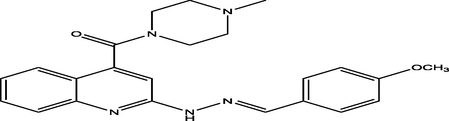
30
7.4420
2.3 Optimization
The chemical structures of the molecules were drawn with Chemdraw ultra Version 12.0 The molecular structures of the compounds were optimized in order to achieve a stable conformer for the inhibitory compounds by employing Density Function Theory (B3LYP/6-31G*) utilizing Spartan 14 Version 1.1.4 software.
2.4 Descriptor calculation
Molecular descriptor is a numerical value that gives chemical information about the molecule. Molecular descriptors for all the forty (40) molecules were calculated utilizing the PaDEL-Descriptor software Version 2.20. A total of 1875 molecular descriptors were calculated.
2.5 Normalization and data pretreatment
The calculated descriptors for the data set that made up the molecules were normalized using Eq. (1) in order to give each variable the same chance at the onset to influence the model (Singh, 2013).
2.6 Data division
In order to generate a robust QSAR model that could predict the activity of the inhibitor against Mycobacterium tuberculosis, Kennard and Stone’s algorithm was employed to divided the data set into training set and test set (Kennard and Stone, 1969). The training set is made up of 70% of the data set which were used to build the QSAR model while the remaining 30% of the data set (test set) were used to confirm the built model.
2.7 Generation of the model
The training set generated was imported to Material studio software version 8 to build the model by employing the Genetic Function Approximation and Multi-linear Regression (GFA-MLR) method.
2.8 Internal validation of model
Estimation of the validation parameter to access the built model was achieved with the aid of Material studio software version 8. Internal validation parameters calculated are as follows;
2.8.1 Friedman formula (LOF)
This parameter measures the fitness score of the model. LOF is defined as; (Friedman, 1991)
The Standard Error of Estimation (SEE) is equivalent to the models standard deviation. It measures the model quality and a model is said to be a robust model if it has low SEE value. SEE is defined by equation below;
2.8.2 The correlation coefficient (R2)
Correlation coefficient (R2) defines the fraction of the entire variation in the model. As the value of R2 approaches 1.0, the stronger the model generated. R2 is expressed as:
Yexp, and Ypred are the mean experimental activity, experimental activity and the predicted activity in the training set, respectively (Adeniji et al., 2018)
2.8.3 Adjusted R2
Correlation coefficient (R2) value varies directly with the increase in number of descriptors thus; R2 is not reliable parameter to measure the robustness and stability of the model. Therefore, R2 is adjusted in order to have a stable and reliable model. The R2adj is defined as:
2.8.4 The cross-validation coefficient ( )
The predictive ability of the QSAR model to predict the activity of inhibitor was determined using cross validation test. The cross-validation coefficient (
) is defined as:
2.9 External validation of the model
Model built was validated to assessed
value. As the value of
approaches 1.0, the robust the model generated. The
is defined by as;
The external validation test for the developed QSAR model was further subjected to Golbraikh and Tropsha criteria listed below:
-
|r0^2 − r′0^2| (Threshold value < 0.3)
-
r2 − ro2/r2 (Threshold value < 0.1)
-
r2 − r′o2/r2 (Threshold value < 0.1)
-
k (Threshold value 0.85 ≤ k ≤ 1.15)
-
k′ (Threshold value 0.85 ≤ k ≤ 1.15) (Roy et al., 2013; Tropsha et al., 2003)
2.10 Y-Randomization test
Y-randomization test was carried out on the training set in order to confirmed that the built QSAR model is strong, robust, reliable and not gotten by chance (Tropsha et al., 2003). For the developed QSAR model to reliable and robust, the model is expected to have a low R2 and Q2 values for numbers of trials. Coefficient of determination (c
) for Y-randomization test is another external validation parameter with (Threshold value
0.5) for passing this test.
2.11 Determination of outlier and influential molecule
The applicability domain approach was employed to determination of outlier and influential molecule. Any compound outside the applicability domain space of
3 is said to be an outlier. The leverage approach was employed in defining and describing the applicability domain of the built QSAR models (Veerasamy et al., 2011). Leverage of a given molecule hi, is defined as;
2.12 Intelligent consensus prediction
An intelligent consensus prediction is performed on multiple QSAR models developed against a particular response and compares them with the prediction quality obtained from the individual models. Further, the quality of predictions is judged based on several external validation metrics such as Q2F1, Q2F2, Q2F3, CCC, rm2 and MAE that might help in improving the quality of prediction for a query molecule. The optimum settings can be fixed using the available QSAR models and corresponding external set compounds with known response values, while the same setting can be later employed for predictions of newly designed query molecules (Roy et al., 2018).
2.13 Assessment of the built model
The robustness, reliability, fitness, stability, and predictability of the generated models were evaluated by subjecting the model to validation parameters. The minimum Threshold value for internal and external validation parameters for a generally acceptable QSAR model (Veerasamy et al., 2011) is presented in Table 2.
Validation Parameter
Definition
Threshold value
R2
Coefficient of determination
≥0.6
P (95%)
Confidence interval at 95% confidence level
<0.05
Cross validation coefficient
>0.5
Difference between R2 and
≤0.3
Next. test set
Minimum number of external test set
≥5
Coefficient of determination for Y-randomization
>0.5
3 Results and discussion
QSAR approach was used to predict the activities of 2,4-disubstituted quinoline derivatives as potent inhibitor against Mycobacterium tuberculosis. The data set which comprises of 40 compounds were divided into a training set of 28 compounds and test set 12 compounds by employing Kennard-Stone algorithm. The training set compounds were used to build the model while the test set compounds were used to validate the built model.
Descriptive analysis of the training set and the test set were reported in Table 3. This shows that the mean value and the standard deviation value of the training set were similar to that of test set. Thus, Kennard-Stone algorithm used in dividing the dataset generate a test set compounds that is a good reflection of the training set compounds
Statistical parameters
Activity
Training set
Test set
Number of sample points
28
12
Range
3.5617
1.8688
Maximum
6.2513
8.2854
Minimum
4.7441
4.9074
Mean
7.339114
6.498873
Median
7.19905
6.1213
Variance
0.609039
0.866467
Standard deviation
0.78041
0.93084
Mean absolute deviation
0.5672
0.703515
Skewness
2.323993
0.87066
Kurtosis
6.13018
0.153415
The Genetic Function Algorithm (GFA) was employed in this study to select the best descriptor that could better predict the activities of the inhibitory compounds while Multi-linear Regression (MLR) method was used as modeling technique in generating the QSAR model. GFA-MLR led to selection of five descriptors and five QSAR models.
Model 1
pBA = −6.515153698 * AATS5e + 0.056593117 * VR3_Dzp + 0.001891166 * VR1_Dzi + 0.000132807 * VR1_Dzs − 6.230058484 * SpMin7_Bhe + 61.731402188.
Model 2
pBA = −5.983214203 * AATS5e + 0.065340929 * VR3_Dzp + 0.001930689 * VR2_Dzi + 0.004049607 * VR1_Dzs − 6.084763724 * SpMin7_Bhe + 57.265328066.
Model 3
pBA = −6.738118716 * AATS5e + 0.008743880 * VR3_Dzv + 0.001819903 * VR1_Dzi + 0.000135235 * VR1_Dzs − 5.680009813 * SpMin7_Bhe + 63.776142838.
Model 4
pBA = −6.148961522 * AATS5e + 0.077745375 * VR3_Dzp + 0.058288135 * VR1_Dzi + 0.000140171 * VR2_Dzs − 5.605672315 * SpMin7_Bhe + 57.795782473.
Model 5
pBA = −6.730758918 * AATS5e + 0.008667299 * VR3_Dzv + 0.001822324 * VR1_Dzi + 0.004064233 * VR1_Dzs − 5.596564878 * SpMin7_Bhe + 63.634320925.
Internal validation parameters to confirm that the built QSAR model is stable and robust were reported in Table 4. These parameters were in agreement with validation parameters presented in Table 2. Based on these validation parameters, model one was selected as the optimum model and used to predict the activities of 2,4-disubstituted quinoline derivatives.
Internal Validation Parameters
Model 1
Model 2
Model 3
Model 4
Model 5
Friedman LOF
0.214357
0.31676
0.32802
0.33227
0.33506
R-squared
0.936651
0.90639
0.90306
0.90181
0.90098
Adjusted R-squared
0.922254
0.88511
0.88103
0.87949
0.87848
Cross validated R-squared
0.875177
0.79575
0.77394
0.76346
0.74815
Significant Regression
Yes
Yes
Yes
Yes
Yes
Significance-of-regression F-value
65.05654
42.6022
40.9893
40.4092
40.0358
Critical SOR F-value (95%)
2.684036
2.684036
2.684036
2.684036
2.684036
Replicate points
0
0
0
0
0
Computed experimental error
0
0
0
0
0
Lack-of-fit points
22
22
22
22
22
Min expt. error for non-significant LOF (95%)
0.175074
0.21282
0.21657
0.21796
0.21888
The QSAR model generated in this research was compared with the model obtained in the literature (Shola et al., 2018; Ogadimma and Adamu, 2016) as shown below;
pBA = −0.307001458(AATS7s) + 1.528715398(nHBint3) + 3.976720227(minHCsatu) + 0.016199645(TDB9e) + 0.089381479 (RDF90i) − 0.107407822(RDF110s) + 4.057082751 Ntrain = 35, R2 = 0.92023900, Radj = 0.91017400, = 0.89538600 and the external validation for the test set was found to be R2pred = 0.8842 (Shola et al., 2018).
pIC50 = −2.040810634 * nCl − 19.024890361 * MATS2m + 1.855704759 * RDF140s + 6.739013671 Ntrain = 27, R2 = 0.9480, Radj = 0.9350, = 0.87994 and R2pred = 0.76907. (Ogadimma and Adamu, 2016).
From the above models the validation parameters reported in this work and those reported in the literature were all in agreement with parameters presented in Table 2 which actually confirmed the robustness of the model generated.
3.1 Interpretation of descriptors in the built model
AATS5e is Average Broto-Moreau autocorrelation – lag 5/weighted by I-state auto-correlation descriptor. It’s based on spatial dependent autocorrelation function which measures the strength of the relationship between observations (atomic or molecular properties) and space separating them (lag). This descriptor is obtained by taking the molecule atoms as the set of discrete points in space and an atomic property as the function evaluated at those points. When this descriptor is calculated on molecular graph, the lag coincides with the topological distance between any pair of the vertices. AATS5e is defined on the molecular graphs using atomic masses (m), Sanderson electronegativity (e) and inductive effect respectively of pairs of atoms 5 bond apart as the weighting scheme. These observations suggested that atomic masses and electronic distribution of atoms that made up the molecule had significant effect on the anti-tubercular activity of the dataset. In addition, the signs of the regression coefficients for each descriptor indicated the direction of influence of the descriptors in the models such that, negative regression coefficient associated to a descriptor will diminish the activity of the compound.
VR1_Dzi is Randic-like eigenvector-based index from Barysz matrix/weighted by first ionization potential while VR1_Dzs is Randic-like eigenvector-based index from Barysz matrix/weighted by I-state. From the model generated in this study, these descriptors have positive coefficient and positive mean effect value. Thus, the interpretation of this model shows that each of this descriptor with positive coefficient is directly proportional to the activities of these molecules. Descriptor VR3_Dzp (Logarithmic Randic-like eigenvector-based index from Barysz matrix/weighted by polarizabilities) with positive mean effect also contribute positively to the activities of the inhibitory compounds.
SpMin7_Bhe is one of the Burden modified eigen values descriptors. The SpMin7_Bhe descriptors have been proposed as chemical structure descriptors derived from a new representation of molecular structure. SpMin7_Bhe is the smallest absolute eigenvalue of Burden modified matrix – n 1/weighted by relative van der Waals volumes. The SpMin7_Bhe mean effect has a positive sign. This sign suggests that the anti-tubercular activity is directly related to this descriptor.
Experimental activities, predicted activities of the inhibitors and the residual values were reported in Table 5. The low residual values between experimental activities and predicted activities indicate that the model generated has a high predictive power (Adeniji et al., 2018).
Molecule
Experimental Activity
Predicted Activity
Residual
1
6.9809
6.971917
0.008983
2
6.815
7.035605
−0.2206
3
6.8018
6.835969
−0.03417
4
7.3209
7.405311
−0.08441
5
6.8191
6.812504
0.006596
6
6.8418
6.794876
0.046924
7
6.8601
7.14979
−0.28969
8
9.4979
9.780245
−0.28235
9
6.9772
6.981565
−0.00436
10
7.2608
7.023143
0.237657
11
7.1707
7.447515
−0.27682
12
7.4233
7.223165
0.200135
13
7.2838
7.473957
−0.19016
14
7.1472
7.201502
−0.0543
15
7.6035
7.567027
0.036473
16
7.2938
7.373105
−0.0793
17
9.6090
9.116462
0.4925
18
7.813
7.55099
0.26201
19
7.4772
7.22946
0.24774
20
6.8909
6.854689
0.036211
21
7.0807
7.201935
−0.12124
22
7.2747
7.265469
0.009231
23
7.4091
7.611252
−0.20215
24
7.7412
7.249363
0.491837
25
7.6688
7.666948
0.001852
26
6.2688
6.399172
−0.13037
27
7.697
7.838932
−0.14193
28
6.7741
6.4254
0.3487
29
6.2513
6.153244
0.098056
30
6.8414
7.044018
−0.20262
31
5.8
5.750218
0.049782
32
7.3673
7.102889
0.264411
33
7.1891
7.133475
0.055625
34
6.8291
6.94336
−0.11426
35
6.9253
6.907757
0.017543
36
7.2022
6.641454
0.560746
37
7.7696
7.382345
0.387255
38
6.5216
6.814865
−0.29327
39
6.7716
6.792383
−0.02078
40
7.442
7.501349
−0.05935
Calculated descriptors for training set and test set in generating Model 1 were reported in Tables 6 and 7. The statistical parameters that influences the selected descriptors used in generating the QSAR model were reported in Table 8. Standard regression coefficient (
and the mean effect (ME) values reported in Table 8 provides vital information on the effect of the descriptors and the degree of influence in the developed model. The signs and the magnitude of these descriptors combined with their mean effects indicate their individual strength and direction in influencing the activity of a compound. Variance Inflation Factor (VIF) calculated for all the five descriptors in the model were all less than 4 which shows that the descriptors selected were orthogonal and model generated was significant. The P-values less than 0.05 shows that there is significant relationship between the descriptors used to build the model and the activities of the inhibitory molecules.
Molecule
AATS5e
VR3_Dzp
VR1_Dzi
VR1_Dzs
SpMin7_Bhe
Predicted Activity
10
7.7372
17.70549
511.3397
642.028
1.0157
7.023143
11
7.791068
17.47607
962.9099
309.0707
1.025939
7.447515
13
7.608921
21.68556
870.1052
873.1568
1.226739
7.473957
14
7.659644
20.41834
627.2396
3328.826
1.18583
7.201502
15
7.739571
20.32523
238.2739
219.4391
0.857759
7.567027
16
7.713336
14.36154
211.4342
208.8292
0.843563
7.373105
17
7.723033
17.69381
522.9963
524.6427
1.01531
7.116462
18
7.652887
18.32748
1468.024
1691.794
1.01613
9.55099
19
7.573325
21.86432
404.1937
380.1573
1.14638
7.22946
2
7.840335
15.98099
517.8681
688.3532
0.898044
7.035605
20
7.564849
21.84717
200.1304
380.1454
1.151469
6.854689
21
7.596019
19.21292
881.1454
449.1
1.251748
7.201935
23
7.520498
31.07208
669.6331
605.408
1.320635
7.611252
24
7.542017
26.40663
635.8836
544.9153
1.297562
7.249363
27
7.536545
27.71683
518.8696
391.9847
1.180847
7.838932
28
7.727577
19.4227
344.8825
537.3151
1.085863
6.4254
29
7.817869
15.1251
398.1442
782.1284
1.018928
6.153244
3
7.907036
16.80212
520.6419
433.798
0.869388
6.835969
30
7.735461
16.0337
546.1729
1172.182
1.018928
7.044018
32
7.711552
16.12091
508.9688
1034.445
1.018928
7.102889
33
7.745807
20.73024
526.963
316.0941
1.018928
7.133475
34
7.712288
15.85823
480.0661
421.0379
1.018928
6.94336
35
7.595979
20.95833
382.0186
591.7095
1.164737
6.907757
37
7.702071
14.90617
597.3325
222.4993
0.979925
7.382345
39
7.689397
16.46417
250.0237
1282.517
1.018928
6.792383
40
7.631576
16.87745
474.5457
558.9262
1.018928
7.501349
6
7.823736
18.6672
253.5776
210.2844
0.888366
6.794876
8
7.734472
16.85365
479.7148
18835.13
0.948795
9.780245
Molecule
AATS5e
VR3_Dzp
VR1_Dzi
VR1_Dzs
SpMin7_Bhe
Predicted Activity
1
7.852957
17.18093
400.8908
527.9417
0.86626
6.971917
12
7.751904
17.26382
674.0365
408.3237
1.012727
7.223165
22
7.567618
19.01451
834.7073
743.5662
1.270478
7.265469
25
7.560045
16.95123
544.0738
292.8519
1.097381
7.666948
26
7.589404
14.07973
258.4521
233.0907
1.156111
6.399172
31
7.789627
14.02771
123.6455
675.4873
1.018928
5.750218
36
7.641038
19.59175
364.7305
583.3535
1.153024
6.641454
38
7.704655
15.62959
245.2209
200.6652
0.978235
6.814865
4
7.798773
16.07059
477.8878
694.5818
0.870197
7.405311
5
7.848879
15.28019
316.6029
346.5946
0.849395
6.812504
7
7.824782
16.21208
532.6217
511.4705
0.898009
7.14979
9
7.748697
17.71338
511.449
635.1386
1.014425
6.981565
Descriptor
Standard regression coefficient (bj)
MeanEffect (ME)
P-Value (Confidence interval)
VIF
Standard Error
AATS5e
−0.2769
−0.31421
0.000527
1.8931
7.19166E−06
VR3_Dzp
0.67675
0.153246
3E−12
1.2779
1.53188E−07
VR1_Dzi
0.987436
0.58264
8.84E−11
3.6622
1.56739E−09
VR1_Dzs
0.338438
0.351968
4.48E−06
1.3493
1.11976E−10
SpMin7_Bhe
1.097495
−0.34097
3.25E−10
3.0968
6.03594E−06
Pearson’s correlations of the five descriptors selected in building the QSAR Model were reported in Table 9. The low correlation coefficient indicates that there is no significant inter-correlation among the selected descriptors.
Inter-correlation
AATS5e
VR3_Dzp
VR1_Dzi
VR1_Dzs
SpMin7_Bhe
AATS5e
1
VR3_Dzp
−0.07133
1
VR1_Dzi
−0.15418
0.10971
1
VR1_Dzs
0.071375
−0.11793
0.015657
1
SpMin7_Bhe
−0.52256
0.0747094
0.301044
−0.11617
1
The test set was subjected to external validation in order to validate the model built. Model 1 passed all the validation parameters reported in Table 10. This can be infer that the model developed is robust and reliable to predict the activities of 2,4-disubtituted quinoline.
External Validation Parameter
Threshold value
Model 1
Model 2
Model 3
Model 4
Model 5
K
0.85 < k < 1.15
1.00018
1.00234
1.03762
1.08732
1. 10,234
K′
0.85 < k < 1.15
0.9989
0.93229
0.89233
0.85423
0.84292
<0.3
0.01487
0.06523
0.06234
0.18766
0.32566
<0.1
0.00363
0.007632
0.08341
0.92301
0.14938
<0.1
0.02176
0.05478
0.08432
0.92310
0.16738
R2 test
>0.6
0.8215
0.7145
0.6822
0.6734
0.6598
Y-Randomization test was reported in Table 11. The low R2 and Q2 values for numbers of trials confirm that the built QSAR model is robust, stable, and reliable. While the Coefficient of determination c
value greater than 0.5 guaranteed that the built model is powerful and not inferred by chance.
Model
R
R^2
Q^2
Original
0.85791
0.736009
0.361481
Random 1
0.263469
0.069416
-0.42957
Random 2
0.634931
0.403137
-3.21615
Random 3
0.44027
0.193838
-1.71176
Random 4
0.45403
0.206144
-0.7079
Random 5
0.642442
0.412732
-4.71577
Random 6
0.116309
0.013528
-0.3569
Random 7
0.24943
0.062215
-0.2046
Random 8
0.296007
0.08762
-0.42455
Random 9
0.270977
0.073429
-0.37515
Random 10
0.351074
0.123253
-0.38131
Random Models Parameters
Average r:
0.371894
Average r^2:
0.164531
Average Q^2:
-1.25236
cRp^2:
0.663262
Intelligent consensus prediction performed on multiple QSAR models developed against a particular response compared with the prediction quality obtained from the individual models has been analyzed and reported. The quality of the predictions judged based on several external validation metrics such as Q2F1, Q2F2, Q2F3, CCC, rm2 and MAE that might help in improving the quality of prediction for a query molecule were reported in Table 12.
Type of Model
N Comp Ext
Q2f1 (100%)
Q2f2 (100%)
Q2f3 (100%)
CCC (100%)
Avg Rm2 (100%)
Delta Rm2 (100%)
MAE (100%)
MAE (95%)
PRESS (100%)
PRESS (95%)
SDEP (100%)
SDEP (95%)
Individual Model 1
12
0.8915
0.8185
0.9218
0.9056
0.7506
0.05595
0.1366
0.0980
0.5512
0.2368
0.2143
0.1467
Individual Model 2
12
0.8883
0.8132
0.9195
0.8957
0.7197
0.15706
0.1463
0.1085
0.5675
0.2509
0.2175
0.1510
Individual Model 3
12
0.7801
0.632
0.8415
0.7901
0.4998
0.26599
0.2417
0.2118
1.1172
0.7922
0.3051
0.2684
Individual Model 4
12
0.7664
0.6092
0.8316
0.7709
0.562
0.12429
0.2456
0.2112
1.187
0.7976
0.3145
0.2693
Individual Model 5
12
0.7466
0.5761
0.8173
0.7469
0.4125
0.32315
0.2553
0.2266
1.2877
0.9618
0.3276
0.2957
CM0 (Average; Original)
12
0.8657
0.7754
0.9032
0.8667
0.6188
0.19871
0.1725
0.1378
0.6822
0.3748
0.2384
0.1846
CM 1 (Average; Modified)
12
0.8657
0.7754
0.9032
0.8667
0.6188
0.19871
0.1725
0.1378
0.6822
0.3748
0.2384
0.1846
CM 2 (Weighted Average)
12
0.8701
0.7828
0.9064
0.8740
0.6442
0.18763
0.1619
0.1263
0.6599
0.3534
0.2345
0.1792
CM 3 (Using Best Model)
12
0.8924
0.820
0.9224
0.9145
0.7740
0.05941
0.1577
0.1209
0.5469
0.2303
0.2135
0.1447
Graphical representations for internal and external validation test were shown in Fig. 1 and Fig. 2 respectively. The squared correlation coefficient (R2) of 0.9367 for training set and (R2test) of 0.8215 for test set reported in this study were in agreement with Genetic Function Approbation (GFA) derived R2 value reported in Table 2 and Table 10. This confirmed the stability, robustness and reliability of the model. The dataset used in this study were within the limit range of
2.5 as shown in Fig. 3. This indicates that dataset were evenly distributed.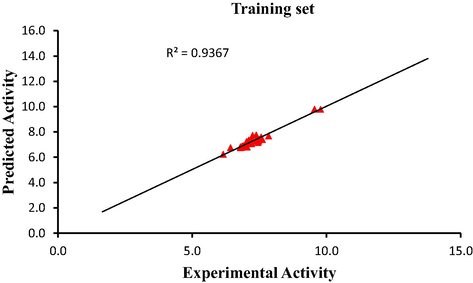
Plot of predicted activity against experimental activity of training set.
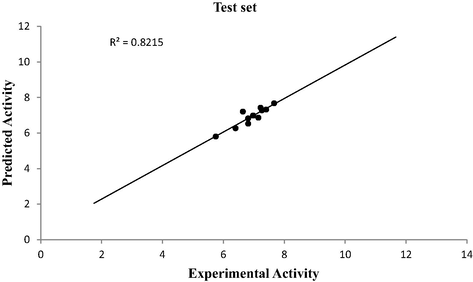
Plot of predicted activity against experimental activity of test set.
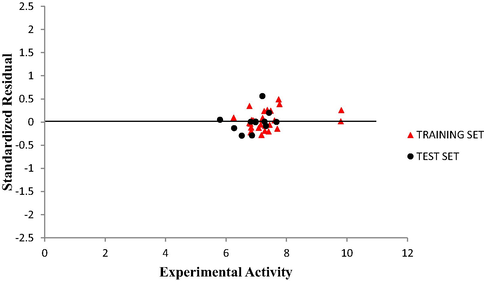
Plot of Standardized residual activity versus experimental activity.
In order to determine the outliers and influential compound in the dataset standardized residual for the all the compounds that made up the dataset were plotted against their leverage values. The Williams plot of the standardized residuals against the leverage values is an evident that all the compounds were within the square space
3 as shown in Fig. 4. Therefore no compound is said to be an outlier. It is also an evident that no compound is said to be an influential compound since all their leverage values are less than the warning leverage (h* = 0. 64).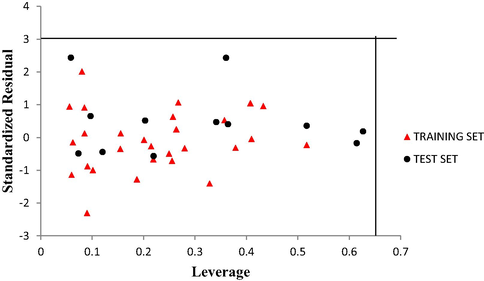
The Williams plot of the standardized residuals versus the leverage value.
4 Conclusion
This study generates a QSAR model for a dataset of 2,4-disubstituted quinoline derivatives as potent inhibitors against Mycobacterium tuberculosis. The internal and external validation test confirmed that the built QSAR model is significant, robust and reliable. From the results, it is concluded that 2,4-disubstituted quinoline derivatives can be modeled using molecular descriptors; AATS5e, VR3_Dzp, VR1_Dzi, VR1_Dzs and SpMin7_Bhe. The built QSAR model will be useful for pharmaceutical as well as medicinal chemists to design and synthesis new drugs with better activities against M. tuberculosis.
References
- A novel QSAR model for the evaluation and prediction of (E)-N’-benzylideneisonicotinohydrazide derivatives as the potent anti-mycobacterium tuberculosis antibodies using genetic function approach. Phys. Chem. Res.. 2018;6:479-492.
- [Google Scholar]
- A quantitative structure-activity relationship (QSAR) study of the anti-tuberculosis activity of some quinolones. J. Sci. Res. Rep.. 2016;10:1-15.
- [Google Scholar]
- Chem-bioinformatics and QSAR: a review of QSAR lacking positive hydrophobic terms. Chem. Rev.. 2001;101:619-672.
- [Google Scholar]
- Two-and three-dimensional QSAR studies on a set of antimycobacterial pyrroles: CoMFA, Topomer CoMFA, and HQSAR. Med. Chem. Res.. 2014;23:107-126.
- [Google Scholar]
- Modeling corrosion inhibition of iron in acid medium by genetic function approximation method: a QSAR model. Corros. Sci.. 2011;53:3457-3465.
- [Google Scholar]
- Nayyar, A., Jain, R., 2008. Synthesis and anti-tuberculosis activity of 2,4-disubstituted quinolines.
- Analysis of selected chalcone derivatives as mycobacterium tuberculosis inhibitors. Open Access Lib. J.. 2016;3:1-13.
- [Google Scholar]
- Organization, W.H., 2016. Tuberculosis Fact Sheet (No. 104) 2000. Site Accessed Www Who Intmediacentrefactsheetswho104enindex Html.
- Some case studies on application of “rm2” metrics for judging quality of quantitative structure–activity relationship predictions: emphasis on scaling of response data. J. Comput. Chem.. 2013;34:1071-1082.
- [Google Scholar]
- Is it possible to improve the quality of predictions from an “intelligent” use of multiple QSAR/QSPR/QSTR models? J. Chemom.. 2018;32:e2992
- [Google Scholar]
- QSAR studies of 7-methyljuglone derivatives as antitubercular agents. Med. Chem. Res.. 2012;21:2006-2011.
- [Google Scholar]
- QSAR Modeling and Molecular Docking Analysis of Some Active Compounds against Mycobacterium tuberculosis Receptor (Mtb CYP121) J. Pathog. 2018
- [CrossRef] [Google Scholar]
- Quantitative Structure-Activity Relationship Study of Substituted-[1, 2, 4] Oxadiazoles as S1P1 Agonists. J. Curr. Chem. Pharm. Sci.. 2013;3
- [Google Scholar]
- The importance of being earnest: validation is the absolute essential for successful application and interpretation of QSPR models. Mol. Inform.. 2003;22:69-77.
- [Google Scholar]
- Validation of QSAR models-strategies and importance. Int. J. Drug Des. Discovery. 2011;3:511-519.
- [Google Scholar]


