

Translate this page into:
The Saudi women participation in development index
⁎Corresponding author. maomair@ksu.edu.sa (Maha Omair)
-
Received: ,
Accepted: ,
This article was originally published by Elsevier and was migrated to Scientific Scholar after the change of Publisher.
Peer review under responsibility of King Saud University.
Abstract
We present a composite index that measures the participation of Saudi women in national development through certain broad dimensions of measurements, to be employed on Saudi Arabian datasets. In terms of method and technique, the composite index consists of 5 pillars from selected weighted variables chosen by experts, in order to provide a well representative index that measures local priorities and development needs. Construction of the index goes through stages, such as data allocation, national surveys, data normalizing, weight assignment, focus groups, pilot testing, and finally measurement of the index and its components. The index incorporates 54 indicators to capture the complexity of national development and ranks regions in Saudi Arabia according to calculated components and the gender gap between women and men in five key areas: health, education, economy, social engagement, and legislative structure to gauge the state of gender equality in the country. The index will be beneficial to decision makers to allocate necessary strategic policies that will help increase women participation in development in order to play their anticipated role in achieving the goals of Saudi Arabia’s Vision 2030.
Keywords
Y8
D63
O15
I0
I3
C8
Composite index
Economic development index
Gender gap
Women’s empowerment
Index construction
Sustainable development indicators

1 Introduction
Societies are interested in knowing where they are and where they are headed. Information and measurement are essential tools to achieve this purpose. In fact, without them it would be difficult to perform an assessment on how much progress a society has made, or identify which aspects to measure, or how to measure them (Global Gender Gap Report, 2017). Also, it would be difficult to determine how much advancement could be considered real progress. Each society has its own considerations about what the real meaning of development is, how to measure it, and how to interpret any development results. Moreover, local experts can especially provide this understanding and construct a well representative index that measures local priorities and development needs; then international expertise would complement national knowledge where needed. There is a need to develop a more comprehensive view of development and progress in nations; one that considers social, environmental, and economic concerns, and considers the local needs and customs of a specific region.
Recently, constructing composite indicators have led researchers to develop different methods of weighing and aggregating individual indicators into a single index (Ding et al., 2018). Ding et al. (2018) presented a new mechanism to build a composite indicator using ranked weights and Stochastic Multicriteria Acceptability Analysis (SMAA-2). (Santeramo, 2015) In another work, Santeramo (2015) computed several composite indices for food security with different methods to impute and homogenize weights, and to aggregate data. (Wineman, 2016) Similarly, Wineman (2016) built a multidimensional index of food security using principal component analysis technique.
In this paper, we construct a compound index that measures Saudi women participation in development in Saudi Arabia. The index is composed of five major pillars that affect women participation in development: education, health, legislative structure, economic opportunities, and social engagement. Each pillar is divided into relevant components that reflect the needs of a changing Saudi economy, but account for necessary local and cultural considerations. All 54 components are weighted and averaged into the final index. This index aims to help decision makers around Saudi Arabia and Saudi citizens to highlight their great achievements in development, as well as find solutions to improve their weaknesses. The index can also be used as a tool by the government and planning commissions to measure women’s progress against national and international commitments to improve the status of women in economic, social and political spheres. During the process of index construction, benchmarking against world indices was conducted, and major world indices were used as references in constructing the index. In fact, the Global Gender Gap Index (GGGI) was the model against which our index was designed in order to achieve a reflection of the GGGI on the 13 districts of Saudi Arabia. During our alignment of index pillars and components with the Saudi Vision 2030 (Full Text of Saudi Arabia's Vision, 2030), we found that it is necessary to add an extra important pillar that was not mentioned in the GGGI, and that is the social dimension. We need our index to be comprehensive and address our specific needs. Thus, in each pillar, local expert opinion was sought to validate the pillar’s components and their relative weights. Moreover, the index construction team had several international experts review the index, who in turn noted that neither the GCC region nor and the MENA region has such a composed index that focuses on women participation in development. This increased the motivation for us to design such an index which could be beneficiary to all in our region.
The paper starts with a background review of relevant world indices and Saudi Arabia’s rank in these indices. The methodology section follows with information on all the local considerations and needs, datasets, and weight determinations. Lastly there is an analysis of the first-round of results for 2018, as well as potential future studies.
2 Insight into some world indices
The Human Development Report was published in 1990, where human development was defined as a process of diversifying people’s choices, improving their capabilities, and providing an enabling environment in which people can live productive lives (UNDP, 2017). The Human Development Index (HDI) is a measure to evaluate and assess the social and economic development levels of countries. The HDI was developed by the United Nations. This index focuses on three areas: population’s health and longevity; knowledge and education; and decent standard of living. The HDI is basically used to rank countries by level of human development. In 1995, the Human Development Report introduced the Gender Empowerment Measure (GEM) and the Gender Development Index (GDI). The Gender Inequalities Index (GII) was developed to resolve the shortcomings of the GEM and GDI. The GII is a measurement of gender disparity. It was introduced in the 2010 Human Development Report 20th Anniversary edition by the United Nations Development Program (UNDP). This index measures the loss of achievement within a country due to gender inequality (Gopoian and Mccue, 2008; Dollar and Gatti, 1999). It uses three dimensions to measure opportunity cost: labor market participation, reproductive health and empowerment. Another index, the Global Gender Gap Index (GGGI) (Global Gender Gap Report, 2017) published in 2006 by the World Economic Forum, covers 144 economies in terms of measures of gender equality. Countries are ranked according to calculated gender gaps between women and men in four areas: health, education, economy and politics. By closing 84% of their gender gaps, the three highest ranking countries became a role models in providing these resources equitably between women and men. The lowest country closed around 50% only of its gender gap.
Fig. 1 shows Saudi Arabia’s rankings in some of these major world human development indices. In most of these indices the low position that Saudi Arabia scores does not reflect the status of Saudi women in reality. For instance, Saudi Arabia is ranked 138 out of 144 countries in the GGGI and ranked 131 out of 164 countries in the GDI. There are sometimes unknown survey collection methods and in some cases, the neighboring regions’ averaged scores are used to fill in some of the Saudi missing data. Therefore, a local index, measured by local experts from the region is highly needed. The data must be accurate, collected correctly, and provided by authorized national census units to more realistically reflect the Saudi society (Hertog, 2008). Saudi Arabia has now assigned the General Authority for Statistics (GASTAT) to be the source of all national data. All data records are collected directly from the sources by GASTAT, either from ministries and authorities or through national surveys. They intend to collaborate with all world indices and make sure the data is collected with high standards and passed on to global indices to reflect more accurately the status of women and development in Saudi Arabia.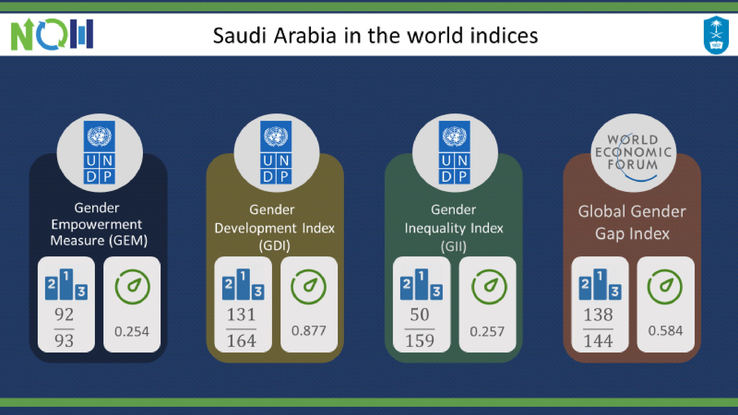
The rank of Saudi Arabia in some world indices shown in the numerator of the ratios.
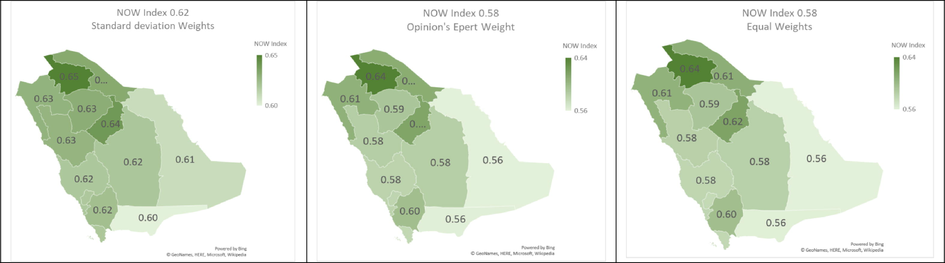
The Women Participation in Development Index using three methods of weighing.
3 Methodology for building the index
To construct a suitable index that measures the participation of women in development, the National Observatory for Women (NOW) at King Saud University signed agreements and secured partnerships with different beneficiaries, such as the Family Affairs Council for index construction, the GASTAT for data allocation, Alwaleed Philanthropies for the national survey for the Social Pillar, and local experts in the fields of each pillar for validation of pillar components and assignment of component weights. After thoroughly researching the methodology of existing world indices during benchmarking and determining the best practices in these fields (Nardo et al., 2005), the index was designed to measure all the national development needs using national statistics. Therefore, it is intended to help decision makers to guide the nation towards Vision 2030 and towards the full development of Saudi Arabia in various fields (Full Text of Saudi Arabia's Vision, 2030), aided by greater women empowerment and participation. Moreover, the Women Participation in Development Index variables can measure Saudi Arabia’s scores in the different world indices. Composite indexing involves essential steps: selection; scaling; weighting and aggregation; and validation (Nardo et al., 2002). It is a concurrent effort during which selection can be altered, weights adjusted, and variables rescaled in order to arrive at final index estimates. The index features include being comprehensive, based on specific and measurable outcomes, robust but sensitive to change, relative to stakeholders and mutually exclusive (Saltelli, 2004).
Five meetings with experts in the fields that influence women’s participation in national development were conducted. These meetings were necessary to come up with the five major pillars, and the relative components of each pillar, and the associated weights related to the components in the index. Overall there were 2 workshops, 3 focus groups, 3 electronic surveys, and one major conference (Table 1) (Alharbi, 2018). The conference titled “The Role of Women in Development: Towards a Thriving Economy” was held at King Saud University’s women campus on April 4–5, 2018. It involved contributions from many ministries and top decision makers together with a group of experts in national development areas. The Women Participation in Development Index was launched experimentally during that conference. Ministry of Health Pharmacy College Applied Medical Sciences College Family Affairs Council Sociology and Social Studies Department Ministry of Education Mawhiba- National Center for Giftedness and Creativity
Time
Field of experts
Type
Pillar
January 28, 2018
Focus groups
Health pillar
February14, 2018
Council of Saudi Chambers
Work shop-electronic surveys
Economic pillar
March 5, 2018
Work shop-electronic surveys
Social Pillar
March 19, 2018
Institute of Public Administration
Focus group-electronic surveys
Legislation pillar
March 21, 2018
April 1, 2018
Focus group
Educational pillar
April 4–5, 2018
King Saud University-Women Campus
The First conference on “The Role of Women in Development: Towards a Thriving Economy” (Full text, 2030)
Launch of the Women Participation in Development Index
Our composite index consists of five pillars: economic, social, legislation, education and health, each of which consists of several variables that measure the state of gender equality in the country and women participation in development. For instance, the economic pillar has 6 variables that reflect closing the gender gap: in government and private sector workers, in monthly wage, in unemployment, in career professionals and technicians and in running of small and medium enterprises (see Tables 2–6 for further details on the pillars and all 54 components). Construction of the index goes through stages, such as data allocation, national surveys, data normalizing and rescaling, weight assignment, focus groups, pilot testing, and finally measurements of the composite index.
Components
Source and Description
Ar Riyad
Makkah
Al Madinah
Al Qassim
Ash Sharqiyah
Asir
Tabuk
Ha'il
Al Hudud ash Shamaliyah
Jizan
Najran
Al Bahah
Al Jawf
KSA
Type of transformation
weights using standard deviation
equal weights
expert scores
expert weights
Ratio of female workers to male workers in government sector workers
Ministry of Civil Services MCS (Data do not include employees in the security and military sectors)
0.23
0.26
0.28
0.27
0.20
0.23
0.15
0.25
0.26
0.28
0.17
0.30
0.38
0.24
No Trans.
0.21
0.17
3.75
0.17
Ratio of female workers to male workers in private sector workers
General Organization for social insurance law GOSI
0.28
0.22
0.25
0.21
0.16
0.18
0.14
0.12
0.29
0.05
0.06
0.08
0.18
0.21
No Trans.
0.16
0.17
4.60
0.21
Ratio of female monthly wage to male value
GASTAT
0.74
0.80
0.81
0.85
0.71
0.84
0.83
0.86
0.85
0.84
0.80
0.81
0.90
0.78
No Trans.
0.25
0.17
1.90
0.09
Ratio of male unemployment rate to male value
GASTAT
0.22
0.17
0.28
0.22
0.16
0.20
0.21
0.25
0.18
0.28
0.13
0.19
0.40
0.20
No Trans.
0.18
0.17
2.70
0.12
Ratio of female professional and technical workers over male value
Ministry of Civil Services MCS and General Organization for social insurance law GOSI
0.71
0.60
0.74
0.62
0.42
0.69
0.61
0.58
0.65
0.78
0.47
0.86
0.90
0.63
No Trans.
0.09
0.17
4.70
0.21
Ratio of female running small and medium enterprises to male value
Council chamber of commerce
0.42
0.43
0.45
0.52
0.35
0.48
0.59
0.59
0.60
0.51
0.38
0.52
0.74
0.44
No Trans.
0.12
0.17
4.60
0.21
Index of Economic pillar using equal weights
0.43
0.41
0.47
0.45
0.33
0.44
0.42
0.44
0.47
0.46
0.34
0.46
0.58
0.42
Index of Economic pillar using sd
0.43
0.42
0.47
0.46
0.35
0.44
0.42
0.45
0.47
0.46
0.36
0.45
0.57
0.42
Index of Economic pillar using weights from eperts'opinion
0.42
0.39
0.45
0.43
0.31
0.42
0.40
0.41
0.46
0.43
0.30
0.45
0.57
0.40
Components
Source and Description
Ar Riyad
Makkah
Al Madinah
Al Qassim
Ash Sharqiyah
Asir
Tabuk
Ha'il
Al Hudud ash Shamaliyah
Jizan
Najran
Al Bahah
Al Jawf
KSA
Type of transformation
weights using standard deviation
equal weights
expert scores
expert weights
Ratio of females to males in senior positions in the government sector
Ministry of Civil Services MCS (Data do not include employees in the security and military sectors)
0.06
0.18
0.27
0.26
0.11
0.12
0.00
0.21
0.14
0.27
0.08
0.13
0.19
0.14
no trans.
0.06
0.11
4.64
0.12
Ratio of females in managerial positions in the private sector (medium and high)to males.
General Organization for social insurance law GOSI
0.09
0.11
0.09
0.15
0.09
0.10
0.00
0.00
0.12
0.11
0.00
0.03
1.07
0.10
no trans.
0.02
0.11
4.36
0.11
Ratio of females in Shura Council to males
GaStat
0.25
0.25
0.25
0.25
0.25
0.25
0.25
0.25
0.25
0.25
0.25
0.25
0.25
0.25
no trans.
0.04
0.11
4.27
0.11
Ratio of females in municipal councils to males.
GaStat -
0.01
0.02
0.02
0.01
0.03
0.00
0.01
0.01
0.00
0.02
0.00
0.00
0.02
0.01
no trans.
0.61
0.11
4.27
0.11
Ratio of Female in rank of minister or equivalent compared to males.
GaStat
0.01
0.01
0.01
0.01
0.01
0.01
0.01
0.01
0.01
0.01
0.01
0.01
0.01
0.01
no trans.
0.04
0.11
4.27
0.11
Ratio of female to male in promotions ((number of female who promoted/number of suited for promotion) over male value).
GaStat- Ministry of Civil Services MCS (Data do not include employees in the security and military sectors)- General Organization for social insurance law GOSI
0.14
0.14
0.14
0.14
0.14
0.14
0.14
0.14
0.14
0.14
0.14
0.14
0.14
0.14
no trans.
0.04
0.11
4.64
0.12
Women job security
NOW Survey (Assess your sense of job security from 0 to 10?
7.91
8.16
8.22
9.73
8.16
9.05
9.08
9.28
8.53
8.64
7.88
8.97
8.75
8.46
no trans.
0.09
0.11
4.20
0.11
Ratio of female participation in municipal elections to male
GaStat
0.08
0.04
0.07
0.08
0.12
0.07
0.13
0.14
0.30
0.09
0.10
0.05
0.22
0.10
no trans.
0.07
0.11
4.18
0.11
Employment engagement
NOW Survey (Assess how closely you associate with the job you are working in and want to complete in the same job from 0 to 10?
7.89
8.23
8.06
9.69
8.22
9.01
8.93
9.10
8.68
8.60
8.18
8.67
9.11
8.47
X/10
0.02
0.11
3.91
0.10
Index of Legislation pillar using equal weights
0.25
0.20
0.20
0.32
0.20
0.25
0.23
0.26
0.25
0.24
0.17
0.22
0.38
0.21
Index of Legislation pillar using sd
0.12
0.12
0.13
0.15
0.13
0.13
0.13
0.15
0.14
0.14
0.10
0.12
0.17
0.13
Index of Legislation pillar using weights from experts' opinion
0.24
0.19
0.20
0.31
0.19
0.24
0.22
0.26
0.24
0.24
0.17
0.21
0.38
0.21
Components
Source and Description
Ar Riyad
Makkah
Al Madinah
Al Qassim
Ash Sharqiyah
Asir
Tabuk
Ha'il
Al Hudud ash Shamaliyah
Najran
Al Bahah
Al Jawf
KSA
Type of transformation
weights using standard deviation
equal weights
expert scores
expert weights
Social Relations Network: social media affiliation.
Survey (Proportion of women who answered yes to the following question: Do you have an account in any of social network?)
0.88
0.85
0.83
0.84
0.90
0.82
0.87
0.92
0.89
0.76
0.88
0.87
0.85
No trans.
0.04
0.04
4.00
0.04
Proportion of the existence of a network of crises in society.
Survey (Proportion of Women who answered choices 2–6 to the question: On who you rely on the crises? 1- nobody, 2-relatives, 3-friends, 4-family support fund, 5-Charities, 6-others
0.99
0.96
0.95
0.99
0.92
0.94
0.98
0.99
0.99
0.98
0.96
0.96
0.97
No trans.
0.11
0.04
4.00
0.04
Civil Participation (volunteering age 18 and above – volunteering in the neighbourhood)
NOW survey (Proportion of women who answered yes to the question: Have you ever worked as volunteer in the neighbourhood over the past year?)
0.09
0.08
0.04
0.05
0.08
0.02
0.21
0.03
0.28
0.60
0.13
0.03
0.12
No trans.
0.02
0.04
4.00
0.04
The confidence (confidence in Community institutions (political, economic,…etc.) confidence in non-profit organizations). Social Relations Network (social media affiliation – family support or social support).
NOW Survey (Do you trust community care institutions? Such as social development centers, orphanages, nursing home, support centers, divorcees, widows)
0.85
0.79
0.74
0.93
0.86
0.83
0.97
0.86
0.77
0.65
0.75
0.89
0.82
No trans.
0.03
0.04
3.65
0.04
Proportion of women above subsistence living level
Ministry of economy and planning + NOW Survey
0.67
0.45
0.51
0.52
0.78
0.62
0.63
0.76
0.71
0.48
0.71
0.59
0.61
No trans.
0.02
0.04
4.53
0.05
Proportion of households headed by women or with women financial contribution to total families.
NOW Survey (is the family headed by women?)
0.21
0.29
0.24
0.24
0.22
0.24
0.28
0.25
0.21
0.22
0.28
0.31
0.26
No trans.
0.03
0.04
4.53
0.05
Proportion of women without primary health care
NOW Survey
0.00
0.00
0.00
0.00
0.00
0.00
0.00
0.00
0.00
0.00
0.00
0.00
0.00
1-X
0.03
0.04
4.71
0.05
Freedom of choice Index: Percentage of participants who replied that they were satisfied with the next question “How are you satisfied about your freedom to choose marriage? ” from 0 to 10.
NOW Survey
9.00
9.16
9.27
9.90
9.42
9.33
9.30
9.13
8.98
8.14
8.83
8.60
9.13
X/10
0.06
0.04
4.41
0.05
How are you satisfied about your freedom of reproduction? from 0 to 10.
NOW Survey
9.24
9.23
9.30
9.91
9.32
9.34
9.38
9.19
8.97
8.20
9.00
8.85
9.19
X/10
0.06
0.04
4.00
0.04
How are you satisfied about your freedom to choose work? from 0 to 10.
NOW Survey
8.19
8.63
8.61
9.75
8.59
9.35
9.10
8.85
8.69
7.77
8.81
8.73
8.68
X/10
0.05
0.04
4.24
0.04
How are you satisfied about your freedom of studying)? from 0 to 10.
NOW Survey
7.18
7.67
7.44
8.51
7.56
7.78
8.18
8.73
7.74
6.08
7.57
7.27
7.54
X/10
0.04
0.04
4.12
0.04
The Transport Availability Index –satisfaction of easy access to public or private transportation from 0 to 10.
NOW Survey
5.57
6.46
6.76
8.92
7.04
5.57
6.89
8.58
6.31
6.42
4.99
6.59
6.46
X/10
0.02
0.04
4.24
0.04
Satisfaction with facilities and comprehensive access programs and the suitability of the working environment for the female disabled (scale of 0–10).
NOW Survey
6.92
7.18
7.46
9.03
7.45
6.56
8.48
8.58
7.27
6.24
5.36
6.30
7.13
X/10
0.02
0.04
4.47
0.05
Proportion of women who have experienced gender-specific discrimination.
NOW Survey
0.00
0.01
0.01
0.09
0.03
0.00
0.00
0.00
0.00
0.01
0.01
0.00
0.01
No trans.
0.10
0.04
4.53
0.05
Proportion of women and girls aged 18 and over who have experienced physical, sexual or psychological violence during the past 12 months.
NOW Survey
0.02
0.01
0.00
0.01
0.03
0.00
0.00
0.00
0.00
0.12
0.01
0.00
0.02
No trans.
0.08
0.04
4.71
0.05
Proportion of women aged 20 to 24 who have married before they reach the age of 16 years.
NOW Survey
0.02
0.02
0.01
0.04
0.02
0.03
0.02
0.08
0.01
0.04
0.00
0.00
0.03
No trans.
0.03
0.04
4.41
0.05
A sense of security in wandering around the residence.
NOW Survey, ratio of positive answers (Do you feel safe walking alone?)
0.89
0.88
0.90
0.93
0.78
0.92
0.95
0.95
0.93
0.69
0.67
0.85
0.86
No trans.
0.03
0.04
4.41
0.05
Society accepts women in leadership positions.
NOW Survey (do you accept to work with a woman-headed administration?)
0.79
0.80
0.71
0.82
0.84
0.74
0.89
0.81
0.91
0.78
0.85
0.84
0.81
No trans.
0.05
0.04
3.71
0.04
Society accepts women's work in Trades and crafts.
NOW Survey (do y0u accept women working in crafts or service jobs?)
0.80
0.81
0.74
0.93
0.82
0.69
0.92
0.80
0.93
0.86
0.81
0.90
0.82
No trans.
0.03
0.04
3.76
0.04
The Community acceptance of women's independent in individual housing
NOW Survey (do you accept an independent home for women if needed?)
0.62
0.66
0.75
0.85
0.67
0.61
0.77
0.80
0.88
0.77
0.80
0.56
0.69
No trans.
0.02
0.04
3.76
0.04
Average of hours spent in leisure and personal care
NOW Survey
2.67
2.61
2.04
2.00
2.61
2.45
2.24
1.86
2.32
3.88
1.79
2.08
2.43
X/(Max.)
0.02
0.04
3.94
0.04
Ratio of female unpaid working hours to male value
NOW Survey
1.00
1.00
1.00
1.00
1.00
1.00
1.00
1.00
1.00
1.00
1.00
1.00
1.00
No trans.
0.03
0.04
4.50
0.05
The indicator of how you feel about the place you now stand in your life you wish from 0 to 10, so that 10 is the best life for you.
NOW Survey
8.51
8.92
8.57
9.64
8.85
9.08
9.21
9.13
9.06
8.38
8.92
8.59
8.86
X/10
0.07
0.04
4.29
0.04
Index of Social pillar using equal weights
0.64
0.64
0.63
0.70
0.66
0.63
0.69
0.68
0.68
0.65
0.63
0.64
0.65
Index of Social pillar using sd
0.64
0.64
0.63
0.70
0.66
0.64
0.68
0.67
0.67
0.63
0.64
0.64
0.65
Index of Social pillar using weights from experts'opinion
0.64
0.65
0.63
0.70
0.66
0.64
0.69
0.69
0.68
0.65
0.63
0.64
0.65
Components
Source and Description
Ar Riyad
Makkah
Al Madinah
Al Qassim
Ash Sharqiyah
Asir
Tabuk
Ha'il
Al Hudud ash Shamaliyah
Jizan
Najran
Al Bahah
Al Jawf
KSA
Type of transformation
weights using standard deviation
equal weights
expert scores
expert weights
Proportion of children whose school is>60 min away from their residence.
Now Survey
0.00
0.00
0.00
0.00
0.00
0.00
0.00
0.00
0.00
0.00
0.00
0.00
0.00
0.00
1-X
0.04
0.09
4.32
0.10
Percentage of schools with female student per class: Primary > 30, intermediate and secondary > 35.
Ministry of Education
13.24
15.84
15.03
5.03
22.01
7.21
11.79
8.24
9.69
18.09
10.54
2.73
15.92
13.18
1-X/100
0.05
0.09
4.61
0.11
The Number of female students per teacher at primary level – intermediate and secondary.
Ministry of Education
11.27
12.20
10.98
8.32
13.88
9.28
12.25
8.89
11.82
11.66
14.03
6.75
10.87
11.28
1 if above world av.
0.04
0.09
4.57
0.10
Ratio of females to males in literacy.
GASTAT
0.47
0.42
0.50
0.46
0.38
0.27
0.30
0.34
0.53
0.38
0.44
0.25
0.71
0.40
No trans.
0.02
0.09
3.68
0.08
Ratio of female net enrolment rate for primary education to male value.
GASTAT (net enrolment rate for primary education)
1.00
1.01
1.01
0.99
1.01
1.00
1.00
1.00
1.00
0.98
1.00
1.00
1.00
1.00
No trans.
0.43
0.09
3.82
0.09
Ratio of female net enrolment rate for intermediate education to male value
GASTAT (net enrolment rate for intermediate education)
1.00
0.99
0.99
0.99
1.01
1.00
0.98
1.03
1.00
1.00
0.99
0.92
1.01
1.00
No trans.
0.13
0.09
3.93
0.09
Ratio of female net enrolment rate for secondary education to male value
GASTAT (net enrolment rate for secondary education)
0.99
0.97
0.99
0.97
0.98
0.98
1.00
0.95
0.98
0.95
0.98
1.07
0.98
0.98
No trans.
0.17
0.09
3.86
0.09
Ratio of female students to male students in intermediate diploma (post-secondary and sub-university).
Ministry of Education
0.24
0.10
0.24
0.15
0.21
0.55
0.00
0.04
0.14
0.27
0.13
0.26
0.10
0.20
No trans.
0.02
0.09
3.39
0.08
Ratio of female students to male students in higher education.
Ministry of Education
1.02
1.12
0.90
1.12
1.27
1.17
1.25
1.33
1.23
1.10
0.75
0.73
1.28
1.09
No trans.
0.03
0.09
3.78
0.09
Ratio of female students studying abroad to male value.
Ministry of Education
0.44
0.44
0.44
0.44
0.44
0.44
0.44
0.44
0.44
0.44
0.44
0.44
0.44
0.44
No trans.
0.04
0.09
3.81
0.09
Ratio of females to males in technical and vocational training.
Ministry of Education
0.14
0.19
0.28
0.17
0.45
0.06
0.32
0.08
0.24
0.02
0.12
0.15
0.23
0.21
No trans.
0.02
0.09
3.86
0.09
Index of Educational pillar using equal weights
0.74
0.72
0.75
0.74
0.75
0.75
0.72
0.71
0.75
0.71
0.70
0.70
0.76
0.74
Index of Educational pillar using sd
0.92
0.91
0.92
0.91
0.92
0.92
0.92
0.91
0.92
0.90
0.91
0.91
0.92
0.92
Index of Educational pillar using weights from experts' opinion
0.76
0.74
0.76
0.76
0.76
0.76
0.74
0.73
0.77
0.73
0.72
0.72
0.77
0.75
Components
Source and Description
Ar Riyad
Makkah
Al Madinah
Al Qassim
Ash Sharqiyah
Asir
Tabuk
Ha'il
Al Hudud ash Shamaliyah
Jizan
Najran
Al Bahah
Al Jawf
KSA
Type of transformation
weights using standard deviation
equal weights
expert scores
expert weights
Death proportion during birth or pregnancy.
GASTAT
0.00
0.00
0.00
0.00
0.00
0.00
0.00
0.00
0.00
0.00
0.12
0.00
0.10
0.01
1-X
0.123
0.20
3.200
0.200
Adolescent births (15–19 years) per 1000 women in that age group.
GASTAT
68.1
55.9
16.3
13.5
108.4
111.9
41.3
80.9
215.0
233
31.3
218.4
62.1
79.6
X/1000
0.066
0.20
3.375
0.210
Health births (birth rate under the supervision of health workers).
GASTAT
1.00
1.00
1.00
1.00
1.00
0.99
1.00
1.00
0.99
0.98
1.00
1.00
1.00
1.00
No trans.
0.720
0.20
3.570
0.223
Proportion of women aged 18 and over Practitioners of sports activities (on a regular basis) at least once a week.
GASTAT
0.37
0.69
0.42
0.44
0.40
0.74
0.94
0.44
0.76
0.52
0.89
0.64
0.49
0.57
No trans.
0.027
0.20
3.330
0.208
Ratio of female life expectancy (life expectancy at birth) to male value.
GASTAT
1.00
1.00
1.00
1.00
1.00
1.00
1.00
1.00
1.00
1.00
1.00
1.00
1.00
1.00
No trans.
0.064
0.20
2.560
0.160
Index of Health pillar using equal weights
0.86
0.93
0.88
0.89
0.86
0.92
0.98
0.87
0.91
0.85
0.95
0.88
0.87
0.90
Index of Health pillar using sd
0.98
0.99
0.98
0.98
0.98
0.98
1.00
0.98
0.97
0.95
0.98
0.98
0.97
0.98
Index of Health pillar using weights from experts' opinion
0.85
0.92
0.88
0.88
0.85
0.92
0.98
0.87
0.90
0.85
0.95
0.88
0.86
0.89
3.1 Rescaling variables
Several processes are used to scale the variables in the data collected from the General Authority for Statistics, such as:
-
Variables that captures the gap between females and males are calculated as the ratio of female over male. The range of these kinds of variables is between 0 and 1. As the number approaches 1, the gender gap is closed. In some cases where the value of the female variable exceeds the corresponding male value, this ratio is truncated to one (as in the life Expectancy) (Global Gender Gap Report, 2017). In contrast, in the unemployment rate, the indicator was calculated to be the ratio of male over female to get a positive reflection of women participation in development.
-
Opinion variables collected through the national survey for the social pillar are calculated using a 0–10 Likert scale. In this case, the approach used to rescale the variable to 0–1 is
Proportion variables are scaled from 0 to 1. These variables represent the proportion of the sample with specific characteristic that we are interested in. The proportion with negative reflection, x, to women participation in development was converted to have positive reflection using the transformation 1-x.
Rate variables are rescaled to 0–1 as follows:
3.2 Selection of weights
The five pillars are equally weighted in calculating the overall index, whereas, three different methods of weighing the variables within each pillar are used following best practices. A variety of methods have been developed in the literature to determine weights in the simple additive weighting (SAW) method (Tzeng and Huang, 2011), which can be typically categorized into three groups: objective, subjective and integrated (Wang and Luo, 2010).
3.2.1 The first (objective) method sets weights by standard deviation, where the variables with more variation among districts have less weight
In each pillar, the standard deviation (SD) of each component after the rescaling to 0–1 is calculated among the 13 Saudi districts. However, when data is not available across districts, the value is considered equal for all districts, the standard deviation is zero, and the weight of that variable will become zero. We elected to replace the zero value by the average of standard deviations of the other variables in the same pillar. Then the 1% change for each component in terms of standard deviation is calculated by dividing 0.01 by the standard deviation (Global Gender Gap Report, 2017). These normalized values are used as weights to calculate the weighted average of the components in each pillar (the weight of a component is the normalized value divided by the sum of the normalized values in this pillar). This method is used for weighing the indicators in the Global Gender Gap Index GGGI. One can note that a disadvantage of this method is that the standard deviations change over time, which complicates the inter-temporal comparisons of the index value.
3.2.2 The second (subjective) method sets weights by importance
This involved the adoption of experts’ opinions in each relevant area to determine the importance of the components within each pillar. The experts were asked during workshops and focus groups through an electronic survey to evaluate variables according to their importance and their impact on women participation in development on a scale from 1 to 5, where 1 is the least important and 5 is the most important (the weight of a component is the average value of allocated scale by experts divided by the total). Table 1 shows the scheduled workshops and focus groups to assess the variables in each pillar.
3.2.3 The third method sets equal weights.
In this method, all variables in a specific pillar are assumed to contribute equally, while noting that the contribution of all variables to the final Women Participation in Development Index is not equal and is related to the number of components in its specific pillar.
3.3 Calculation of the index
Each variable is calculated across Saudi Arabia and its 13 administrative districts, and then fed into the calculation of the five pillars and the final value of the Women Participation in Development Index. The value of each pillar ranges from 0 to 1, where 1 represents the best level of participation and representation of women in the field of a pillar. On the other hand, the 0 value represents imparity and reflects neither participation nor representation of women in the field of the pillar. The Women Participation in Development Index is then calculated by averaging all the five pillars, as shown in equation (3).
Comparison among districts in terms of the Women Participation in Development Index as well as in terms of the pillars and their components will help decision makers develop policies that have high impact on women’s participation in development and discover strengths and weaknesses around the different districts (Alharbi, 2019). The Mazziotta-Pareto index (MPI) method proposed in (Mazziotta and Pareto, 2016) is used to rank the 13 districts among the 5 pillars. The MPI method uses a non-linear function that introduces a penalty for variables with unbalanced values. Fig. 3 illustrates the comparison of the 4 different methods to construct the pillars.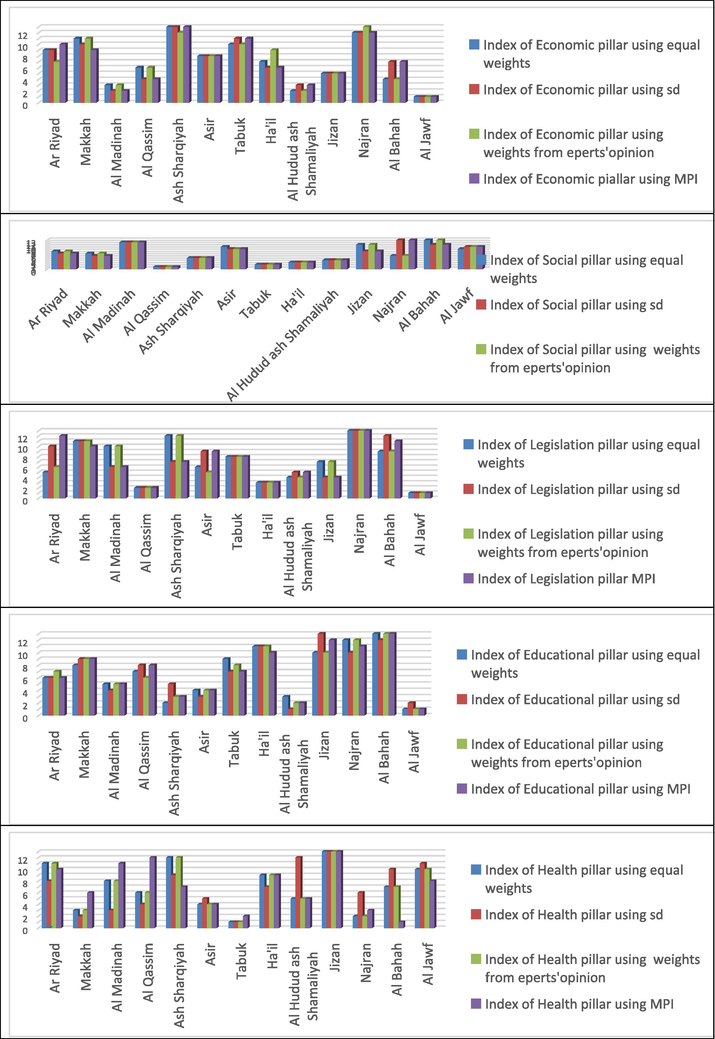
The ranks of the 13 districts in each pillar using the four methods.
3.4 Social pillar survey
While constructing the index and choosing suitable components, there were a great number of new aspects that were agreed upon in the focus groups with the experts as affecting women participation in development, but they were not measured before, especially in the social/socioeconomic and legislation pillars. The National Observatory for Women decided to design a national survey that would address these issues and provide accurate data to measure them. The national survey was conducted across the Kingdom via a partnership between the General Authority for Statistics and Alwaleed Philanthropies. Before designing the questionnaire, choosing the questions, determining the method of entering the answers and other technical matters, the opinions of specialists in sociology were sought and taken into consideration, in order to ensure the accurate implementation of the calculations and achieve the goals of the social pillar, and by extension the goals of the Women Participation in Development Index. The survey collected information on demographics, social capital variables, opinions, satisfaction and trust. In January 2019, the survey was distributed to a sample that included 15,908 families, which included 36,712 individuals, 49.3% of which were women and 50.7% men. The number of individuals in households ranged from 1 to 25 individuals with an average of 5.20 and a standard deviation of 2.51. The sample includes participants over the age of 18 with an average age of 37.74 years and a standard deviation of 15.1 years. The survey was distributed in all regions of Saudi Arabia and the percentage of population was as follows: 16.2% of the population in Riyadh, 15.9% of the population of Makkah, 12.8% of the Eastern Region, 7.3% of Asir and 6.5% of the population of Madinah, 6% of the population of Jazan, 5.8% of the population of Tabuk region, 5.6% of the northern border area, 5.3% of the population of Qassim area, 5.2% of Najran, 4.9%, 4.5%, 4% of the population of Hail, Al Jawf and Al Baha areas respectively. Results of the variables used in constructing the index are presented in Tables 3 and 4.
4 Results
Tables 2–6 show the results of the data that was available in 2018 from GASTAT together with the data source. Values are presented for each variable of the five pillars in Saudi Arabia and the 13 districts. The Women Participation in Development index is calculated using all methods of weighing. Tables 7 illustrates the calculation of the MPI for the economic pillar.
Components of Economic Pillar
Ar Riyad
Makkah
Al Madinah
Al Qassim
Ash Sharqiyah
Asir
Tabuk
Ha'il
Al Hudud ash Shamaliyah
Jizan
Najran
Al Bahah
Al Jawf
Standardized values (mean = 100, sd = 10)
Ratio of female workers to male workers in government sector workers
96.7
101.3
105.8
103.8
90.3
96.2
81.9
100.2
100.8
104.9
86.5
108.8
122.8
Ratio of female workers to male workers in private sector workers
114.5
106.4
110.5
105.9
99.0
100.9
95.5
93.4
115.3
84.7
85.1
87.9
100.9
Ratio of female monthly wage to male value
83.0
96.5
99.1
107.0
77.8
104.5
102.1
108.3
106.1
103.7
96.9
98.1
117.2
Ratio of male unemployment rate to male value
99.3
91.9
108.3
99.8
90.4
96.8
98.1
103.9
93.3
109.2
86.7
95.6
126.7
Ratio of female professional and technical workers over male value
103.5
95.5
105.6
96.9
81.5
101.9
96.3
93.4
98.7
108.9
85.3
115.0
117.5
Ratio of female running small and medium enterprises to male value
91.2
92.7
94.4
101.8
84.7
97.9
108.0
108.3
109.4
100.1
87.7
101.0
122.8
MPI
97.0
97.1
103.6
102.4
86.7
99.6
96.4
100.9
103.4
101.2
87.8
100.3
117.4
The 2018 value of the Women Participation in Development Index for the Kingdom of Saudi Arabia, using the SD weighing method, is 0.62, where the largest value of the index is 0.65 at Al Jawf and the smallest value is 0.60 at Najran (the values using the other weighing methods are available in Fig. 2. The economic pillar has a value of 0.42, showing that 42% of the gap between women and men in their participation in economic development is closed. For example, the gender gap in the government sector workers is closed by 24%, which can be interpreted as that for each 100 men there are 24 women working for the government. Moreover, the gender gap in running small and medium size enterprises is closed by 44%. It is important here to highlight the fact that there is no wage gap in the public sector between men and women in Saudi Arabia, and it is one of the countries that supports equal wage for men and women.
The social pillar has the value of 0.65. As the value gets closer to 1 the socio-economic environment is more supportive of women participation in development. 85% of Saudi women have social media affiliation and 97% of Saudi women have support and belong to a social network of support in times of crises. 26.4% of Saudi families are headed by women or partially supported financially by women.
The value of the legislation pillar is 0.13. The legislation pillar revealed a high gender gap where only 14% of the gender gap is closed in senior positions in the government sector, 10% of the gender gap is closed in managerial positions in the private sector, 25% of the gender gap is closed in the Shura council, 1% of the gender gap is closed in each of the municipal council, participation in municipal elections, and the rank of minister, with only 14% of the gender gap in number of promotions closed. It also showed that women felt a sense of job security at the rate of 8.46 out of 10 (where 10 means full sense of security) and employment engagement security at the rate of 8.47 out of 10 (where 10 means full sense of job engagement).
On the other hand, the educational pillar has the high value of 0.92, which implies no gender gap in primary, intermediate, secondary and higher education. However, the gender gap in intermediate diplomas and in technical and vocational training is closed by only 21%. Moreover, the gender gap in students studying abroad is closed by 44% (this value is the same across districts because the data is not classified according to districts).
Moreover, a high value was scored at the health pillar 0.98, which shows that women health aspects are not obstructing them from fully participating in national development. In fact primary health care is provided for free to all residents in Saudi Arabia.
It is important to note that there are low values and sometimes negative correlation between objective weights (statistically driven) and the weights given by the local experts. For example, in the economic pillar, the correlation is −0.83 between GGGI-type (SD) weights and expert weights. Which motivates us to rely on the expert weights in future calculation of the index.
In order to compare the three proposed methods for calculating the value of the pillars and the MPI method, we used the ranks of the 13 districts in Fig. 3. One can note that the ranks obtained by the MPI method and the SD weights method are almost the same, except for some differences in the health pillar, due to small values of standard deviation in some variables (standard deviation of birth rate under the supervision of health workers was 0.007). For instance, the ranks obtained by these two methods in the economic pillar is the same for all districts except Riyadh and Makkah with ranks 9 and 10 using the SD method and ranks 10 and 9 using the MPI method. Only three districts get different ranks when comparing the equal weights method and experts' opinion weights method. On the other hand, seven districts scored different ranks when comparing the equal weights method and the SD method. Generally, the SD method gives lower weights for variables with more variability.
5 Conclusions
In this study, we introduced the Women Participation in Development Index, a diagnostic measurement tool produced by the National Observatory for Women at King Saud University. The index consists of five pillars averaged equally into the main index and 54 components with weights constructed through different methods. The dataset covered all 13 administrative districts of Saudi Arabia. A national survey was conducted in January 2019 to provide some of the missing data, specifically for variables in the social and legislative pillars. The index is important to Saudi development, particularly in highlighting the role of women in development and their contribution in the realization of Saudi Arabia’s Vision 2030. The index and its pillars and components are aligned with SDG goals as well. Women status and participation in development in Saudi Arabia has improved lately due to several royal decrees that help empower women legislatively, economically, and socially.
Future work will require calculating the Women Participation in Development Index yearly using data obtained regularly from GASTAT and providing an update to the weights according to national development needs. Moreover, the general trend of the index could be analyzed after accumulating several consecutive years of measurements to monitor progress towards specific goals, measure change, and find a time series for index values to give a more comprehensive picture of Saudi women contributions in national development. Moreover, the robustness characteristic of the proposed index could be further studied through uncertainty and sensitivity analyses (Saisana et al., 2005).
Acknowledgments
The authors would like to thank King Saud University, the General Authority for Statistics, the Family Affairs Council, and Al Waleed Philanthropies for their support in this work.
Special thanks go to Her Excellency Professor Einas Al-Eisa, the founder of the National Observatory for Women and current President of Princess Noura Bint Abdulrahman University; Dr. Maimoonah Al Khalil, the Director of the National Observatory for Women; His Excellency Dr. Fahad bin Sulaiman Al Tekhaifi, the President of the General Authority for Statistics; Her Royal Highness Princess Lamia Bint Majed AlSaud, the Secretary General of Alwaleed Philanthropies; and Dr. Hala Al-Tuwaijri, the Secretary General of the Family Affairs Council for their much appreciated support.
Funding
The index construction study was funded by the Family Affairs Council. The social pillar survey was funded by Alwaleed Philanthropies and executed in partnership with the General Authority for Statistics.
Declaration of Competing Interest
The authors declare that they have no known competing financial interests or personal relationships that could have appeared to influence the work reported in this paper.
References
- Abir Alharbi, November 2018. Presentation of the main findings of the paper on Saudi women participation in the national development index, MENA-OECD women’s economic empowerment forum, Tunisia.
- Abir Alharbi, March 2019. Saudi women participation in the national development index, CSW-63, Council of status of women, UN women, New York, USA.
- Using ranked weights and acceptability analysis to construct composite indicators: A case study of regional sustainable society index. Soc. Indic. Res.. 2018;139(3):871-885.
- [Google Scholar]
- Gender Inequality, Income, and Growth: Are Good Times Good for Women?” Background Paper for Engendering Development. Washington DC: World Bank; 1999.
- Full text of Saudi Arabia's vision, 2030. English.alarabiya.net. retrieved 2017-12-13.
- Global gender gap report, 2017. Global Gender Gap Report 2017. Retrieved 2018-05-11.
- Dispositional Empathy and the political gender gap. J. Women Politics. 2008;21(2):1-20.
- [Google Scholar]
- The political economy of Saudi Arabia. J. Dev. Stud. 2008:1240-1242. Taylor & Francis
- [Google Scholar]
- On a generalized non-compensatory composite index for measuring socio-economic phenomena. Soc. Indic. Res.. 2016;127(3):983-1003.
- [Google Scholar]
- Nardo, M., Michaela, S., Saltelli, A., Tarantola, S., 20 September 2005. Tools for composite indicators building. European Commission, Joint research center Italy, Ispra.
- Nardo, M., Saisana, M., Saltelli, A., Tarantola, S., August, 20 September, 2005. Handbook on constructing composite indicators: methodology and user guide. Organization for economic cooperation and development.
- Saisana, M., Tarantola, S., 20 September 2002. State-of-the-Art report on current methodologies and practices for composite indicator development. European Commission, joint research center, Italy, Ispra.
- Uncertainty and sensitivity analysis techniques as tools for the quality assessment of composite indicators. J. R. Stat. Soc.: Ser. A (Stat. Soc.). 2005;168(2):307-323.
- [Google Scholar]
- Saltelli, Andrea, 2004, Global sensitivity analysis: An introduction“, european commission, joint research center, Italy, Ispra, March 7.
- On the composite indicators for food security: Decisions MATTER. Food Rev. Int.. 2015;31(1):63-73.
- [Google Scholar]
- Multiple Attribute Decision Making: Methods and applications. London: CRC Press; 2011.
- What is human development. UNDP, 2017. Retrieved 27 October 2017.
- Integration of correlations with standard deviations for determining attribute weights in multiple attribute decision making. Math. Comput. Modell.. 2010;51(1):1-12.
- [Google Scholar]
- Multidimensional household food security measurement in rural Zambia. Agrekon. 2016;55(3):278-301.
- [Google Scholar]


