

Translate this page into:
The role of sperm associated antigen 6 gene in morphological changes of inner ear development and signal regulation of auditory organs in mice
⁎Corresponding author. huangyidengwz@yeah.net (Yideng Huang)
-
Received: ,
Accepted: ,
This article was originally published by Elsevier and was migrated to Scientific Scholar after the change of Publisher.
Peer review under responsibility of King Saud University.
Abstract
Aim
In order to analyze the effects of the deletion of the Sperm Associated Antigen 6 (Spag6) gene on the inner ear and the auditory system of mice.
Method
Clustered Regularly Interspaced Short Palindromic Repeats (CRISPR)/Cas9 technology was utilized, and the Spag6 gene knockout mouse model was constructed. Self-breeding was carried out to obtain the F1 generation Spag6 homozygous mouse (Spag−/−), the Spag6 heterozygous mouse (Spag+/−) and the Spag6 wild mouse (Spag+/+) were obtained. Polymerase Chain Reaction (PCR) technology was used to verify the three genotypes of mice. The mean hearing threshold of Spag−/− mice, Spag+/− mice and Spag+/+ mice after different intensity of sound stimulation was detected. The inner ear cochlea tissues of Spag−/− mice and Spag+/+ mice were collected and paraffin sections were made. Morphological differences of inner ear tissues in mice were analyzed by hematoxylin – eosin (HE) staining. Immunofluorescence staining was used to analyze the number of hair cells in the inner ear of mice. Apoptosis of mouse inner ear hair cells was analyzed by TdT-mediated dUTP Nick-End Labeling (TUNEL) staining
Result
It was found that the hearing of Spag−/− mice decreased significantly compared with that of Spag+/+ mice (P < 0.01), and the hearing of Spag+/− mice decreased significantly compared with that of Spag+/− mice (P < 0.05). After HE staining and immunofluorescence staining, hair cells in the inner ear cochlea of Spag−/− mice were found to be defective. The apoptosis detection results of TUNEL staining indicated that the number of apoptosis of hair cells in inner ear cochlea of Spag−/− mice was significantly higher than that of Spag+/+ mice, and the average optical density of Corti apparatus of Spag−/− mice was significantly higher than that of Spag+/+ mice (P < 0.01).
Conclusion
The results showed that the loss of the Spag6 gene accelerated the apoptosis of hair cells in the cochlear tissue of the inner ear of mice, thereby affecting the auditory system of mice. The significance of this study is to lay the foundation for future studies on the effects of Spag6 on deafness.
Keywords
Spag6 genes knock-out
Auditory brainstem response
Hair cells
Cell apoptosis
Corti instrument

1 Introduction
Deafness is a high incidence of functional impairment. Impairment of auditory function was caused when lesions occurred in the auditory system in terms of transmission, sense of sound, auditory nerve and various levels of center in the access pathway (Ahmed et al., 2018). However, it is generally believed that when the average auditory threshold of human language frequency reaches 26 dB, it can be considered that there is auditory system decline or hearing impairment. Auditory system is composed of peripheral auditory system and central system functions of outer ear, middle ear and inner ear (Regev et al., 2019). When the sound enters the external auditory canal, it causes the tympanic membrane to vibrate. After the middle ear conducts and amplifies the vibration mechanical signal, the hair cells distributed on the Corti organ in the inner ear cochlea transmit the vibration mechanical signal into electrical signal, which is then transmitted to the brain receptors (Hoffman et al., 1984). Previous studies have shown that the development of cochlear hair cells is jointly regulated by multiple signaling pathways, and deafness is also affected by genetic factors (Rudman et al., 2017). Duncan et al. found that Celsr1 gene has an important relationship with inner ear development and vestibular hair cells (Duncan et al., 2017). Janssensdevarebeke et al. have found that COCH gene inactivation leads to prelingual hearing impairment (JanssensdeVarebeke et al., 2018). A small number of studies have indicated that the loss of Spag6 gene can affect the development of the inner ear or lead to otitis media. The Spag6 gene is located on human chromosome 10 and is highly expressed in the testicles of men (Huo et al., 2017). It has been proved that the Spag6 gene has multiple functions, for example, the deletion of the Spag6 gene can lead to infertility disease in mice (Sapiro et al., 2002), motor dysfunction in the epithelial cilia of respiratory tract, and finally pneumonia (Zhang et al., 2007). Moreover, the Spag6 gene is closely related to the occurrence of human tumors (Altenberger et al., 2017).
However, there are few studies on the establishment of the Spag6 gene deletion mouse model and the effects of the deletion of the Spag6 gene on the morphology of the inner ear and the auditory system of the mouse. Therefore, using the CRISPR/Cas9 technology, the Spag6 gene knockout mouse can be built. The Spag6 gene knockout homozygous mouse, the Spag6 gene knockout heterozygous mouse, and the Spag6 gene wild type mouse can be obtained by mating and breeding the Spag6 gene knockout mice. Then polymerase chain reactio (PCR) was used to detect different genotypes of F1 mice, giving them Click sound stimulation of different intensity, and detecting the auditory brainstem response of different genotypes of mice. Paraffin sections of mouse inner ear cochlea tissue were made, hematoxylin – eosin (HE) staining, immunofluorescence staining and TdT-mediated dUTP Nick-End Labeling (TUNEL) staining were performed. Finally, the differences between the inner ear cochlea of the homogenous mouse with gene Spag6 knockout and the wild mouse with gene Spag6 were analyzed. The results of this study are intended to provide theoretical basis for the follow-up study of Spag6 gene in the search for new molecular genetic markers of deafness disease.
2 Materials and methods
2.1 Experimental animals
40 healthy mice (20 males and 20 females) were purchased from Shanghai slack animal research co., LTD. Free drinking water and standard diet were provided when the temperature was 23 ± 5 °C, the humidity was 50 ± 10% with 12 h of light. The experimental process of this study had been approved by the ethics committee of our hospital, and the experimental procedures were in accordance with the relevant regulations formulated by the ethics committee.
2.2 Preparation of the Spag6 gene knockout mouse Spag6
Chopchop software was used to determine the target site of knockout of mouse Spag6 gene. After selecting the top 3 guide RNA (gRNA) sites, the t7-grna skeleton was used as the template. The amplification primer of the target site was used for gRNA amplification, and Cas9 mRNA was synthesized after gRNA was purified and recovered. The wild-type zygote of mice was taken, and gRNA and Cas9 mRNA were injected into the zygote of mice under the microscope. After incubating for several days, gRNA and Cas9 mRNA were transplanted into the uterus of mice. Then wait for the mice to be born. Target sites and PCR primers are shown in Table 1.
gRNA
Primer sequences
Product size
S1
TCACATCGCGAAGCACTCGGTGG
S2
CGTCGGCTTTTTGTAACAAGTGG
S3
CACGGGCAACGTGTTTGTGATGG
S1-F
F: TGAAAGTCCAACAGCTCAGAAA
274
S1-R
R: TTTGTCCTTCAGACAGGTGAGA
S2-F
F: TCTGTTTCTATCCTCAAGGTGC
283
S2-R
R: ACCAAGCATTTATCACTGAGCC
S3-F
F: CCGGAAGATCATATTAAGGCTG
273
S3-R
R: TGCTTGACTGAGAAAAGGAACA
2.3 Identification of genotype of Spag6 gene knockout mouse Spag6
The sexually mature Spag6 gene knockout mice were reared in a cage with a ratio of 1:4 male and female. After mating, the homozygous Spag6 gene knockout mice (Spag−/−), the heterozygous Spag6 gene knockout mice (Spag+/−) and the wild Spag6 gene mouse (Spag+/+) were obtained. Tail tissues of the three genotypes of mice were collected with 0.5 cm, and the whole genome DNA of the mouse was extracted with the DNA extraction kit. Then PCR amplification primer of the Spag6 gene was designed. PCR amplification was performed with mouse DNA as the template. The total PCR reaction system was 20 μL: including 0.5 μL upstream and downstream primers, 1 μL DNA template, 10 μL PCR MasterMix, 8 μL ddH2O.Reaction procedure: 94 °C 5 min, 94 °C 1 min, 58 °C 30 s, 72 °C 90 s (32 cycles), 72 °C 10 min, 4 °C forever. PCR primers are shown in Table 2.
The name of the gene
Primer sequences
Product size (bp)
Spag6
F: GACTTAGCAGAAGCAGTCG
190
R: CGGAGAGAAGCTGCTACC
GAPDH
F: CCACTCTCCACCTTTGAC
101
R: ACCCTGTTGCTGTAGCCA
2.4 Test grouping and detection of auditory brainstem response in mice
After grouping according to the genotype of the F1 generation Spag6 knockout mouse, Spag+/+ mice, Spag+/− mice and Spag−/− mice were selected from the same litter at 3 weeks of age. After weighing, an anesthetic is injected into the abdominal cavity to make it completely anesthetized. Then, mice were placed in a room where external interference could be shielded. Electrodes recording brain stem reactions were placed subcutaneously in the middle of the top of the head, a reference electrode was placed subcutaneously next to the auricle, and a grounded electrode was placed subcutaneously under the back. The mice were put in shielding interference in the room. In the middle of the head position of subcutaneous electrode that is put in the record brainstem response near the auricle subcutaneously into the reference electrode, on the back subcutaneous into the grounding electrode. Sound stimulation was performed on the ear of mice with reference electrodes. The intensity of stimulation was gradient decreased from 90 dB to 10 dB, and after the intensity was finally reduced to 10 dB, the hearing threshold of mice under the stimulation was recorded. Subsequently, 5 kHz, 10 kHz, 15 kHz and 30 kHz and pure sounds were used to stimulate the auditory brainstem of mice. The intensity of stimulation decreased from 90 dB to 10 dB in the same way, and the hearing threshold of mice under stimulation was recorded.
2.5 Preparation and HE staining of mouse inner ear tissue sections
Under tests of auditory brainstem responses in different genotypes of mice, Cochlear tissues of the same litters of Spag+/+ mice and Spag−/− mice were collected at 3 weeks of age. After washing, 10% ethylenediamine tetraacetic acid (EDTA) solution was used for decalcification treatment. After 1 week, paraformaldehyde solution was used for fixation, and 70%∼100% alcohol was used for dehydration treatment. The dehydrated tissues were immersed in xylene solution until the tissues were transparent. After the paraffin melted to liquid, the tissue was embedded at 60 °C.A microtome was used to slice the embedded tissue into slices about 4 µm thick. After soaking the tissue sections in warm water at 42 °C for 2 min, spread them flat on the slide with tweezers for drying.
The prepared inner ear sections of mice were dewaxed in xylene solution. Rinse after soaking with 100%∼70% alcohol. The tissue sections were placed in hematoxylin dye for 2 min, and the excess dye was washed away. Hydrochloric acid ethanol solution was used for tissue differentiation and washing. The tissue sections were placed in diluted ammonia water and washed after the tissues were turned blue. The tissue was stained with eosin and washed with water. Then 70%∼100% alcohol was used for dehydration treatment. The dehydrated tissues were immersed in xylene solution until the tissues were transparent. After adding the center gum seal slice, the slice was observed under the microscope.
2.6 Immunofluorescence staining of inner ear tissue in mice
Paraffin sections were made from Spag+/+ mice and Spag−/− mice of the same litter at 3 weeks after birth, and the sections were washed with 0.01 mol/L phosphate buffer solution (PBS) buffer solution for 3 times. 10% goat serum was added and sealed in an incubator at 37 °C for 45 min. After the excess liquid was removed, the diluted primary antibody was added and incubated in a wet box at 37 °C for about 1 h. After that, it was placed in a refrigerator at 4 °C and incubated overnight. The sections were washed with 0.01 mol/L PBS buffer 3 times. The diluted secondary antibody was added under dark conditions and incubated for 45 min. Discard the waste liquid and add 2.5 mg/mL DAPI for dyeing at room temperature for 20 min. The slides were washed with 0.01 mol/L PBS buffer for 6 times. Add the reagent to prevent fluorescence quenching to seal the slice, and then observe the slice under fluorescence microscope.
2.7 Detection of cochlear cell apoptosis in mice inner ear
Paraffin sections were made from Spag+/+ mice and Spag−/− mice of the same litter at 3 weeks after birth and immersed in xylene solution for 2 times. After 5 min each time, gradient leaching was performed with 100%∼70% alcohol. After 10 min immersion in trypsin solution, 400 μg/mL Proteinase K working solution was used to treat the tissue at 37 °C for 5 min. Sections were divided into three groups, and different TUNEL reaction mixtures were added after rinsing with PBS. The tissues were treated at room temperature for 10 min. After the sections were dried, 50 μL TUNEL reaction solution was added, the slides were covered, and the tissues were treated at 37 °C for 1 h in a dark wet box. PBS was added to tissues and the sections were observed under fluorescence microscope after rinsing with PBS. The reaction solution was added and placed in a dark wet box at 37 °C to treat the tissue for 30 min. Then the tissue was washed with PBS. 80 μL DAB substrates were added to react at room temperature for 10 min, and the sample was rinsed with PBS. The sections were re-dyed with hematoxylin and then dehydrated and sealed with water. After PBS was added, the sections were examined by optical microscope.
2.8 Statistical processing
SPSS 19.0 software was used for statistical analysis. The measurement data were expressed as mean ± standard deviation. T test was used for comparison between groups.
3 Results
3.1 PCR amplification results of gRNA of Spag6 gene
GRNA was amplified at the target point of mouse Spag6 gene knockout. The PCR amplification results are shown in Fig. 1. The concentration of S2 is lower, while the concentration of S1 and S3 is higher. Therefore, S1 and S3 are selected for the subsequent microinjection test.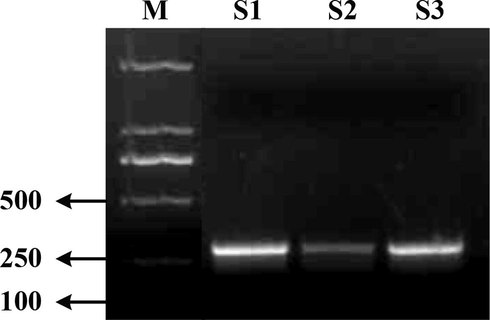
GRNA amplification products detection of S1 ∼ S3 of Spag6 gene.
3.2 Genotype detection results of Spag6 gene knockout mice
The offspring mice were obtained after mating and reproducing the Spag6 knockout mice. The offspring mice were obtained. The genotypes of the homozygous mouse (Spag−/−), the Spag6 knockout heterozygous mouse (Spag+/−) and the Spag6 wild type mouse (Spag+/+) were detected, and the primer of the Spag6 gene was designed for PCR identification of the three genotypes. Fig. 2 shows the result. GAPDH, an internal reference gene, can be amplified in all three genotypes of mice, and the expression of this gene is consistent in different genotypes of mice. The Spag6 gene was only successfully amplified in the wild type of Spag6 mouse (Spag+/+) and the Spag6 gene knockout heterozygous mouse (Spag+/−). The Spag6 gene amplification band was slightly brighter than the Spag6 gene knockout heterozygous mouse (Spag+/−), but the Spag6 gene knockout homozygous mouse (Spag−/−) was not amplified.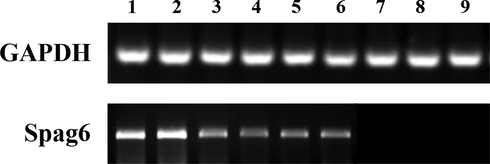
Detection results of the Spag6 gene amplification products of mice with different genotypes Note: holes 1 ∼ 3 are the Spag6 gene wild type mice (Spag+/+); Well 4 ∼ 6 is the Spag6 gene knockout heterozygous mouse (Spag+/−). Where is Spag6 gene knockout homozygous mouse (Spag−/−).
3.3 Detection results of auditory brainstem response in mice
Spag+/+ mice, Spag+/− mice and Spag−/− mice of the same litter at 3 weeks after birth were selected for the detection of auditory brainstem response, as shown in Fig. 3. The average hearing threshold of Spag+/+ mice after Click sound stimulation is 29.92 ± 1.93 dB. The average hearing threshold of Spag+/− mice is 43.57 ± 2.54 dB, and the average hearing threshold of Spag−/− mice is 71.09 ± 5.21 dB. The average hearing threshold of Spag−/− mice is significantly higher than that of Spag+/+ mice (P < 0.01), and significantly higher than that of Spag+/− mice (P < 0.05). However, there is no significant difference between Spag+/− mice and Spag+/+ mice (P > 0.05). The auditory brainstem response of mice was detected under pure tone stimulation of different intensities. As shown in Fig. 3B, the hearing threshold of mice of three genotypes under 10 kHz and 15 kHz intensity of sound stimulation is lower than that of 5 kHz and 30 kHz. Under the stimulation of 5 kHz sound intensity, the average hearing threshold of Spag−/− mice is significantly higher than that of Spag+/+ mice (P < 0.01), and significantly higher than that of Spag+/− mice (P < 0.05). Under the stimulation of 10 kHz and 15 kHz sound intensity, the average hearing threshold of Spag−/− mice is significantly higher than that of Spag+/+ mice and Spag+/− mice (P < 0.01). Under 30 kHz sound intensity stimulation, the average hearing threshold of Spag−/− mice is significantly higher than that of Spag+/+ mice (P < 0.05), but not significantly different from that of Spag+/− mice (P > 0.05).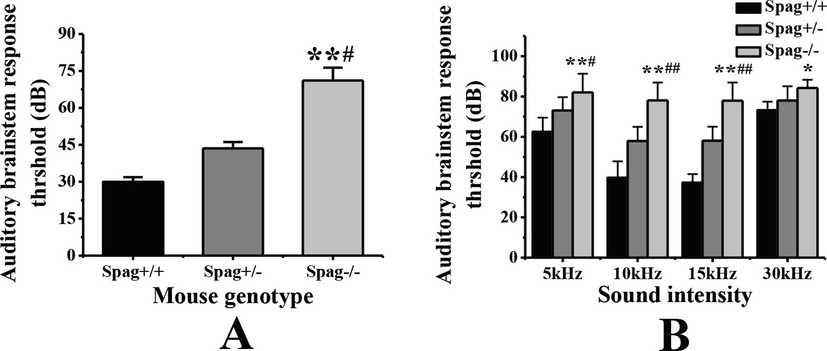
Detection results of auditory brainstem response in different genotypes of mice under sound stimulation. Note: A is the comparison of average hearing threshold of mice with different genotypes after stimulation; B is the comparison of average hearing threshold of mice with different genotypes under different sound intensity; ** indicates that the difference between Spag+/+ mice is extremely significant (P < 0.01). * indicated that there is significant difference in Spag+/+ mice (P < 0.05).Compared with Spag+/− mice, the difference was extremely significant (P < 0.01). # indicates significant difference between Spag+/− mice (P < 0.05)
3.4 Staining results of mouse inner ear tissue sections
The cochlea tissues of the same litter Spag+/+ mice and Spag−/− mice at 3 weeks after birth were collected and prepared into paraffin sections. The sections were stained with hematoxylin – eosin dye, and the differences in the inner ear tissues of the mice with different genotypes were observed under the microscope, as shown in Fig. 4. From Fig. 4A, the Corti apparatus composed of supporting cells and hair cells in the inner ear tissues of Spag+/+ mice are located on the basement membrane of the membrane-cochlear canal, and the arrangement of inner and outer hair cells is normal. No defect of hair cells is found in the cochlea. As Fig. 4B shows, only supporting cells are found in the inner ear tissues of Spag−/− mice, and the arrangement of inner and outer hair cells is irregular. The number of hair cells is significantly reduced compared with that of Spag+/+ mice, indicating that hair cells in the inner ear tissues of Spag−/− mice were defective.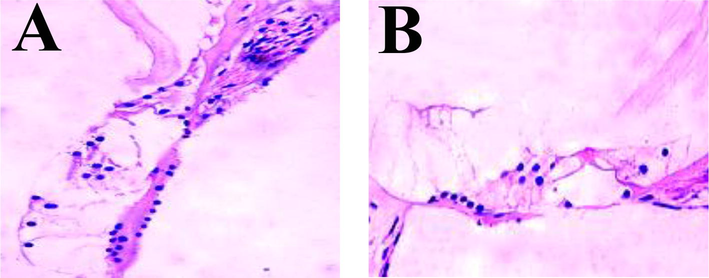
Hematoxylin – eosin staining results of mouse inner ear sections. Note: A is the result of Spag+/+ mouse inner ear tissue staining. B is the result of inner ear tissue staining of Spag−/− mice.
3.5 Immunofluorescence staining of inner ear tissue in mice
Immunofluorescence staining of cochlea tissues in the same litter Spag+/+ mice and Spag−/− mice at 3 weeks after birth were compared. The result is shown in Fig. 5. The expression of Spag6 gene was higher in the cochlea tissue of Spag+/+ mice, while no Spag6 gene was detected in the cochlea tissue of Spag−/− mice. In addition, the number of hair cells collected by Spag−/− mice inner ear tissues was significantly reduced compared with that of Spag+/+ mice, and some hair cells were missing.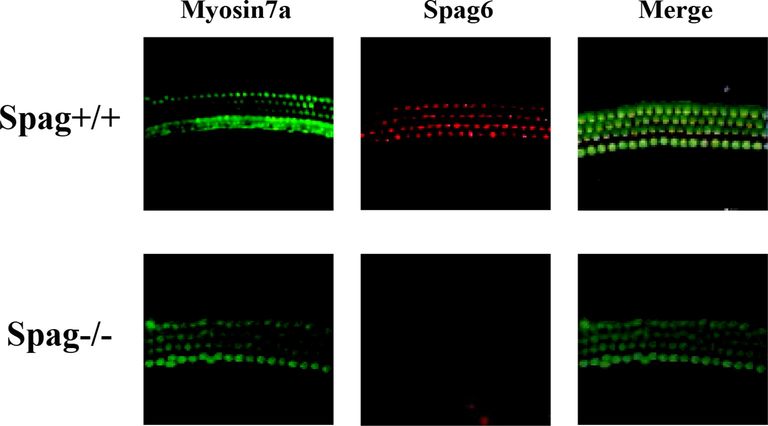
Immunofluorescence staining results of inner ear tissues of mice with different genes.
3.6 Apoptosis in inner ear of mice
Apoptosis of cochlear cells in Spag+/+ mice and Spag−/− mice was detected, and the results are shown in Fig. 6. Fig. 6A and B show that the number of positive staining in cochlear cells of Spag+/+ mice after TUNEL staining was significantly less than that in Spag−/− mice. As Fig. 6B Shows, the number of apoptosis of cochlear cells in Spag−/− mice inner ear is relatively large, and the morphology of a small number of hair cells changed and hair cell defects appeared. The average optical density between Spag+/+ mice and Spag−/− mice in different parts of the inner ear are compared. From Fig. 6C, the average optical density of spiral ganglion and striatum cells in Spag−/− mice are significantly higher than that in Spag+/+ mice (P < 0.05), while the average optical density of Corti apparatus in Spag−/− mice is significantly higher than that in Spag+/+ mice (P < 0.01).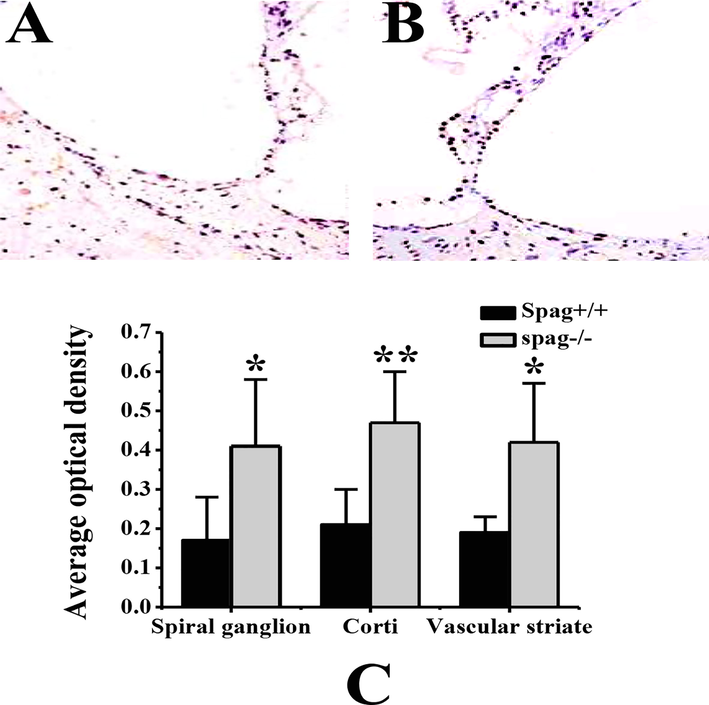
TUNEL staining results of inner ear tissues of mice with different genotypes. Note: A is the TUNEL staining result of Spag+/+ mouse inner ear tissue. B is the TUNEL staining result of Spag−/− mouse inner ear tissue. C is the comparison of the average optical density of different parts of inner ear tissues of mice with different genotypes; ** indicated that the difference between Spag+/+ mice was extremely significant (P < 0.01); * means significant difference between Spag+/+ mice (P < 0.05).
4 Discussion
The Spag6 gene is a homologous gene of PF16, some studies found that the loss of Spag6 gene led to changes in mouse models such as otitis media and abnormal immune system, indicating that Spag6 gene has multiple functions (Li et al., 2017). CRISPR/Cas9 is a technology that can achieve the silencing of target gene expression by inserting exogenous genes or deleting part of the target gene. This technology has been successfully applied in the construction of gene knockout mouse models (Xu, 2018). In order to study the morphological changes and auditory Spag6 gene in mice ear development role in regulating signal in organs, CRISPR/Cas9 technology was used to build Spag6 knockout mice. Through PCR detection of F1 generation Spag6 knockout mice found that successful breeding for Spag6 knockout mice homozygous (Spag−/−), Spag6 gene knockout heterozygous mice (Spag+/−) and wild mice Spag6 gene (Spag+/+), laid the foundation for follow-up study. In order to obtain the effects of Spag6 absence on the auditory system of mice, the auditory brainstem responses of Spag+/+ mice, Spag+/− mice, and Spag−/− mice with different intensity of sound stimulation are examined. It was found that the Spag−/− mice had a very significant decrease in hearing compared to Spag+/+ mice (P < 0.01), indicating that the loss of the Spag6 gene would affect the mouse's hearing system and with a possibility of deafness. This is consistent with the research results of Wang et al. that the loss of Spag6 gene can affect hair cells in the inner ear of mice, and thus affect the auditory system of mice (Wang et al., 2018). Then sections of Spag+/+ and Spag−/− mouse inner ear tissues were made in this research. After HE staining and immunofluorescence staining, it showed that only supportive cells were found in the inner ear tissues of Spag−/− mice, and the number of hair cells was significantly reduced compared with that of Spag+/+ mice, and the hair cells were defective. Moreover, the TUNEL staining results showed that the number of apoptosis of cochlear cells in Spag−/− mice inner ear tissues is higher. The morphology of a small number of hair cells changed, hair cell defects appeared. The average optical density of Corti apparatus in Spag−/− mice is significantly higher than that in Spag+/+ mice (P < 0.01). Corti organ is the most important auditory receptor in the inner ear structure, indicating that the loss of Spag6 gene may lead to hearing impairment in mice by affecting the Corti organ and ganglion in the inner ear tissue of mice (Jang et al., 2015).
In this research, only the deletion of mouse inner ear hair cells was caused by the knockout of Spag6 gene, but the specific regulatory mechanism is still unclear, so the effects of the knockout and overexpression of Spag6 gene on the proliferation and apoptosis of inner ear hair cells can be studied in the future. In conclusion, the knockout of Spag6 gene will cause the loss of hair cells in the cochlear tissue of the inner ear of mice, affect the regulation of the nerve ganglion of the Corti organ in the cochlea, and further cause the disorder of the mouse auditory system. The results can lay a theoretical foundation for future research on molecular genetics related to deafness diseases with Spag6 gene.
Acknowledgement
This research was jointly supported by Zhejiang Provincial Natural Science Foundation of China and Wenzhou basic scientific research project under Grant No. LY19H130003, LY19H130004 and Y20180091.
Declaration of Competing Interest
The authors declare that they have no known competing financial interests or personal relationships that could have appeared to influence the work reported in this paper.
References
- Inframe deletion of human ESPN is associated with deafness, vestibulopathy and vision impairment. J. Med. Genet.. 2018;55(7):479-488.
- [Google Scholar]
- SPAG6 and L1TD1 are transcriptionally regulated by DNA methylation in non-small cell lung cancers. Mol. Cancer. 2017;16(1):1.
- [Google Scholar]
- Celsr1 coordinates the planar polarity of vestibular hair cells during inner ear development. Dev. Biol.. 2017;423(2):126-137.
- [Google Scholar]
- Several distinct receptor binding enkephalins in olivocochlear fibers and terminals in the organ of Corti. Brain Res.. 1984;322(1):59-65.
- [Google Scholar]
- Expressions of SLC22A14 and SPAG6 proteins in the ejaculated sperm of idiopathic asthenozoospermia patients. Zhonghua Nan Ke Xue. 2017;23(8):703-707.
- [Google Scholar]
- Neural-induced human mesenchymal stem cells promote cochlear cell regeneration in deaf guinea pigs. Clin. Exp. Otorhinolaryngol.. 2015;8(2):83-91.
- [Google Scholar]
- Bi-allelic inactivating variants in the COCH gene cause autosomal recessive prelingual hearing impairment. Eur. J. Hum. Genet.. 2018;26(4):587-591.
- [Google Scholar]
- Spag6 mutant mice have defects in development and function of spiral ganglion neurons, apoptosis, and higher sensitivity to paclitaxel. Sci. Rep.. 2017;7(1):8638.
- [Google Scholar]
- Evidence for linear but not helical automatic representation of pitch in the human auditory system. J. Cogn. Neurosci.. 2019;31(5):669-685.
- [Google Scholar]
- The genetic basis of deafness in populations of African descent. J. Genet. Genomics. 2017;44(6):285-294.
- [Google Scholar]
- Male infertility, impaired sperm motility, and hydrocephalus in mice deficient in sperm-associated antigen 6. Mol. Cell. Biol.. 2002;22(17):6298-6305.
- [Google Scholar]
- Expression of prestin in OHCs is reduced in Spag6 gene knockout mice. Neurosci. Lett.. 2018;592:42-47.
- [Google Scholar]
- Generation of conditional Acvrl1 knockout mice by CRISPR/Cas9-mediated genetargeting. Mol. Cell. Probes. 2018;37:32-38.
- [Google Scholar]
- Accelerated mortality from hydrocephalus and pneumonia in mice with a combined deficiency of SPAG6 and SPAG16L reveals a functional interrelationship between the two central apparatus proteins. Cell Motil. Cytoskeleton. 2007;64(5):360-376.
- [Google Scholar]


