

Translate this page into:
The role of green peas protein hydrolysate in TGF/SMAD signaling to prevent renal fibrosis
⁎Corresponding author at: M. Kes, Jalan Prof Drg Suria Sumantri 65 Bandung 40164, Universitas Kristen Maranatha, Indonesia. meilinah.hidayat@maranatha.ac.id (Meilinah Hidayat)
-
Received: ,
Accepted: ,
This article was originally published by Elsevier and was migrated to Scientific Scholar after the change of Publisher.
Peer review under responsibility of King Saud University.
Abstract
Abstract
Objectives
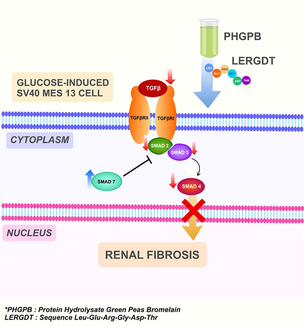
The protein of green peas (Pisum sativum) hydrolyzed by bromelain (PHGPB) shows an effective renal fibrosis therapy by improving renal function parameters in the CKD rats model. The study aimed to determine anti-fibrotic properties effects of PHGPB and LERGDT on TGF-β1 level/SMAD 2,3,4 and 7 gene expressions in a fibrosis renal cell line model, glucose-induced MES13 SV40 cells.
Methods
PHGPB was obtained using simple hydrolysis methods, LERGDT peptide was synthesized using Merryfield method, Chronic kidney model cells by glucose-induced MES13 SV40 cells. SMADs gene expression was counted using qRT-PCR, and TGF-β1 levels were measured by the ELISA method.
Results
The result showed that treatment of 20 mM glucose induction in mesangial cells (kidney sclerosis model) increased the gene expression of SMAD2, SMAD3, and SMAD4, and decreased the expression of SMAD7 genes. Provision of PHGPB and LERGDT to kidney sclerosis cells models decreased the TGF-β1 level and gene expression of SMAD2 and SMAD4 genes at all concentrations, SMAD3 with 25 µg/mL PHGPB and LERGDT treatment. Gene expression of the SMAD7 increased after administration of PHGPB and LERGDT samples in all concentrations.
Conclusion
The provision of PHGPB and LERGDT suppressed the expression of SMAD 2, 3, and 4 genes, yet increased the SMAD 7 gene. PHGPB and LERGDT have promising anti-fibrotic effects on TGF-β1 level/SMAD2, SMAD3, SMAD4, and SMAD7 gene expression in glucose-induced MES13 SV40 cells.
Keywords
Pisum sativum
TGF-β1
SMAD2
SMAD3
SMAD 4
SMAD 7

- CKD
-
chronic kidney disease
- ECM
-
extra cellular matrix
- LERGDT
-
Leu-Glu-Arg-Gly-Asp-Thre
- PHGPB
-
protein hydrolysate of green peas bromelain
- PROSPER
-
protease substrate specificity webserver
- RGD
-
arginine-glycine-aspartate
- SMAD
-
small mothers against decapentaplegic
- TGF-β1
-
transforming growth factor-beta 1
Abbreviations
1 Introduction
Renal fibrosis is the major pathological of chronic kidney disease (CKD) which is characterized by changes in the tissue construction and excessive deposition of the extracellular matrix (ECM) in the kidney. This condition is usually in conjunction with a progression of renal malfunctions (Liu, 2011). Unfortunately, there are not many effective therapies for renal fibrosis.
Therapy approaches are developed based on the signaling pathway induced in renal fibrosis. The results of several studies indicate that the key mediator in progressive CKD renal fibrosis is TGF-β (Meng et al., 2015). TGF-β activation depends on cell surface adhesion receptors of the integrin family. The binding of integrin αv to the RGD sequence in the prodomain and activation of force in this domain activates TGF-β1 which is retained in the ECM by latent TGF-β binding protein (Shi et al., 2011). Based on patent US20120003201A1, recycled RGD (Arg-Gly-Asp) is one of the compositions for treating CKD, which consists of a peptide agent linked to a nanoparticle binary dome that functions as a delivery agent. The complex consisting of integrins and RGD is a proven therapeutic target for fibrosis, thrombosis, and cancer treatments (Miller, 2016). The mechanism of RGD in preventing the formation of fibrosis is by inhibiting the adhesion between integrin vβ1 and primary mesangial cells (Goligorsky and DiBona, 1993). The main pathway of the TGF-β signaling pathway is SMAD signaling. SMAD3 and SMAD2 are the two major downstream regulators that promote TGF-β1-mediated tissue fibrosis (Kim et al., 2005). SMAD3 is very active during fibrogenesis and affects its subsequent downstream. The role of TGF-β1 in fibrogenesis is clear, it stimulates SMAD3 to mediate renal fibrosis, yet the role of SMAD2 in kidney disease remains largely unknown (Hu et al., 2018). SMAD4 plays an important role in fibrotic disease by increasing SMAD3-responsive promoter activity, whereas SMAD7 has the opposite role in preventing SMAD3-induced fibrogenesis mediating. The results of a study concluded that SMAD3 and SMAD4 were pro-fibrotic, whereas SMAD2 and SMAD7 were protective and had opposite roles as anti-fibrotic. (Xu et al., 2016). The strategy of renal fibrosis therapy can be done by increasing the expression of SMAD7 (Meng et al., 2015; Lan and Nikolic-Paterson, 2018).
Fibrosis is a condition that is difficult to treat and cure. Many researchers have tried to find therapies to treat the progression of CKD fibrosis, but more in-depth investigations are still in progress. The study of researchers in Canada showed that yellow peas in their hydrolysate form have many therapeutic effects, for example in the treatment of hypertension and CKD (Li and Aluko, 2010, Pownall et al., 2011; Li et al., 2011). Former research on the protein hydrolysate of green peas showed effective results in restoring kidney function parameters in cisplatin-induced and gentamicin-induced rats (Hidayat et al., 2019). These green peas protein is hydrolysed using the enzyme bromelain, hereinafter referred to as protein hydrolysate of green peas bromelain (PHGPB) (Hidayat, 2019b). Remarkably results from former results are RGD peptides were identified in PHGPB. By using LC/MS-MS, RGD peptide sequences were identified in the PHGPB of convicilin P13915 and P13919 proteins. Administration of PHGPB and RGD 87% showed antifibrotic potential as indicated by the decrease in fibronectin and TGF-β1 levels in glucose-induced MES13 SV40 mesangial cells (Hidayat et al., 2019). The RGD sequence peptide in PHGPB may act as an active substance that binds to integrins in the mechanism of decreasing fibronectin and TGF-β1 levels in kidney cell line models of glomerulosclerosis. In a subsequent study, using a protease specificity prediction server (PROPSPER®), proteolytic cleavage was carried out with metalloproteases and serine proteases and predicted that PHGPB would produce a peptide vault complex Leu-Glu-Arg-Gly-Asp-Thr (LERGDT) containing the RGD sequence (Hidayat, 2019). PROSPER server system is a tool for predicting the cutting site by the bromelain enzyme based on integrated features (http://lightning.med.monash.edu.au/PROSPER). The further process was model substrate specificity, followed by the construction of the model and validation to obtain the repair model (Song et al., 2012). It is hypothesized that the LERGDT peptide sequence has the most potency of anti-fibrosis effect on CKD cells.
The present study aimed to determine anti-fibrotic properties effects of PHGPB and LERGDT on TGF-β1 level/SMAD 2,3,4 and 7 genes expression in a fibrosis renal cell line model, MES13 SV40 mesangial glucose-induced cells to seek therapy for CKD.
2 Material and methods
2.1 Preparation of protein hydrolysate of green peas bromelain (PHGPB)
Green peas split 20016 (The USA. Trinidad Benham Corp. Denver, Co 80237) was hydrolyzed using the previous method (Hidayat, 2018). Dry seeds of green peas (500 g) were mashed and sieved through a 120mesh sieve, then dissolved in 2000 mL of water. To the solution was added ten percent (w/v) of bromelain (Hale et al., 2004) and then left at room temperature (25 °C–30 °C) on a stirrer for 72 h. The solution was then centrifuged for 10 min at 2500g at 4 °C (Refrigerated Centrifuge Tomy Portable MX-201). The supernatant was filtered using filter paper. The molecular weight of PHGPB was separate using Low-Molecular-Weight-Protein-Ladders of SDS-PAGE (mybiosource.com/355494) (Laemmli, 1970) furthermore analyzed with LC/MS-MS. The amount of protein of PHGPB was calculated using the Bradford method to facilitate calculations in protein intake for patients with CKD in the future (Harlow and Lane, 2006).
2.2 Preparation of LERGDT peptide
The materials in the LERGDT peptide synthesis procedure are DCM, Resin, Amino acids: Fmoc-L-Leucine, Fmoc-L-glutamate, Fmoc-L-arginine, Fmoc-L-glycine, Fmoc-L-aspartic acid, Fmoc-L-threonine, DIPEA, Piperidine, DMF, MeOH, HBTU, HOBt, and TFA 95% in water. The LERGDT peptide was synthesized according to Merrifield’s solid-phase synthesis method, initiated by the swelling process (Harlow and Lane, 2006). The sequence of amino acids synthesized were T, D, G, R, E, L. The procedure was initiated by attaching the first amino acid, Fmoc-L-threonine (T = Threonine) to the swollen 2-chlorotrytil chloride resin. This process was followed by washing and drying the resin, calculating resin loading value, capping the resin, Fmoc deprotection, and chloranil test. The next step is to couple resin-T-NH2 with the second residue Fmoc-L-aspartic acid (D = Asp) using HBTU/HOBt reagent to give resin-T-D-NHFmoc. The success of the coupling reaction was monitored by the chloranil test. The next step is to remove the Fmoc group using 20% piperidine in DMF to give resin-T-D-NH2. The following step is a repetitive coupling of the next residues and Fmoc deprotection to give resin-T-D-G-R-E-L-NH2. The procedure ends by cleavage of the peptide from the resin using 95% TFA in water. The crude material was characterized using HR-TOF-MS and analyzed by analytical RP-HPLC to check the purity. (0–95% acetonitrile in water for 30 min using Photodiode Array Detector, Waters 2998, Li Chrospher 100, column C-18 5 mm, flow rate 1 mL/min). The crude was then purified by using semi-preparative RP-HPLC (0–95% acetonitrile in water for 40 min using Photodiode Array Detector, Waters 2998, Li Chrospher 100, column C-18 10 mm, flow rate 2 mL/min) to give the purified peptide. The peptide was then characterized by HR-TOFMS and analyzed by analytical RP-HPLC (Merrifield, 1963; Maharani et al., 2020).
2.3 Cell model of chronic kidney disease
The cell model of CKD, mouse mesangial kidney cell lines MES13 SV40 cells (ATCC® CRL-1927™) from Aretha Medika Utama, Biomolecular and Biomedical Research Center, Bandung, West Java, Indonesia and plated in 6 well plates (Costar, 3516) with a total of 5 × 10³ cells/well. The medium (DMEM) (Biowest, L0103-500): F12-K Mix Nutrient (Biowest, L0135-500) (1:3)) was replaced with medium induced by glucose with a concentration of 20 mM for 5 days. The PHGPB and LERGDT were added with two different concentrations, 25 and 100 µg/ml. The glucose-induced mesangial cell without treatment was termed as the positive control, whereas the untreated cell was negative control (Prahastuti et al., 2019).
2.4 Calculation of transforming growth factor β 1 level
The conditioned medium of treated mesangial cells was used for TGF-β1 level measurement. ELISA Mouse Kit of TGF-β1 (E-EL-M0051, Elabscience) according to the protocol of manufacture with modified method were conducted. The mixture of standard, the blank solution, and 100 µL sample was incubated for 90 min at 37 °C. Subsequently, to each well were added 100 µL detection antibodies biotinylated (Ab) then incubated for 60 min at 37 °C. Horseradish peroxidase conjugate (HRP) of 100 μL was added to the plate and incubated for 30 min at 37 °C. After the liquid was removed, the plate was washed using 200 μL wash buffer five times. The substrate of 90 μL was added and incubated at 37 °C for 15 min. Stop solution of 50 μL was quickly added then the absorbance was read at 450 nm in triplicate (Prahastuti, et al., 2019).
2.5 Quantification of SMAD2, SMAD3, SMAD4 and SMAD7 gene expression
Total RNA of the treated cells was extracted from serum or cells (1 × 10⁶ cell/ml) using TRI reagent (Zymo, R2050-1-200) according to the manufacturer’s protocol and purified with RNA isolation KIT (Zymo, R2073). Subsequently, iScript Reverse Transcription Supermix for RT-PCR (Bio-Rad, 170-8841) was used to create complementary-DNA using the manufactured protocol. The expression of the gene was analyzed by qRT-PCR (Clever, GTC96S) triplicate with SsoFast Evagreen Supermix (Bio-Rad, 172-5200) (Widowati et al., 2020; Ma et al., 2015). The primer sequence (Macrogen) was shown in Table 1 and RNA concentration/purity was shown in Table 2.
Gene
Primer sequence (5′-3′)
Upper strand: sense
Lower strand: antisenseProduct size (bp)
Annealing (°C)
Cycle
Reference
GAPDH
TCAAGATGGTGAAGCAG
ATGTAGGCCATGAGGTCCAC217
59
40
NCBI Reference Sequence: NM_001289726
SMAD2 MOUSE
ATTACATCCCAGAAACACCAC
TAGTATGCGATTGAACACCAG196
59
40
NCBI Reference Sequence:
NM_001252481.1
SMAD3 MOUSE
GTAGAGACGCCAGTTCTACCT
CATCTTCACTCAGGTAGCCAG178
59
40
NCBI Reference Sequence:
NM_016769.4
SMAD4 MOUSE
GAGAACATTGGATGGACGAC
ACATACTTGGAGCATTACTCTG242
54
40
NCBI Reference Sequence:
NM_001364967.1
SMAD7 MOUSE
ACTCTGTGAACTAGAGTCTCCC
CTCTTGGACACAGTAGAGCCT241
59
40
NCBI Reference Sequence:
NM_001042660.1
Sample
RNA concentration (ng/µL)
RNA purity (260/280 nm)
Negative control
162.64
2.49
Positive control
192.08
2.26
Positive control + LERGDT 100 µg/mL
132.00
2.61
Positive control + LERGDT 25 µg/mL
262.48
2.18
Positive control + PHGPB 100 µg/mL
191.84
2.26
Positive control + PHGPB 25 µg/mL
154.24
2.23
2.6 Statistical analysis
To analyze the data was used the Statistical Package for the Social Sciences (SPSS) software version 16, with One-way analysis of variance (ANOVA). To validate the significant differences for all treatments were used post hoc Dunnet-T3 and Mann-Whitney U test (p < 0.05). Statistically was considered to indicate a significant difference if p < 0.05.
3 Results
3.1 Production of protein hydrolysate green peas bromelain (PHGPB)
After obtaining green peas protein hydrolysate, the molecular weight of PHGPB was identified using SDS PAGE, and the results are four thick bands between 8.3 and 22.62 kDa (Fig. 1). Some of the results include low molecular weight (MW) proteins, below 10 kDa, as it is known that the smaller the MW of a protein hydrolysate, the stronger its potential as an antioxidant (Pownall et al., 2010). In the results, Using LC MS-MS, two low MW proteins were identified, namely Convicilin, P13915, and P13919. The RGD peptide was found at site 1901B of convicilin P13915 and convicilin P13919. The total protein content in PHGPB calculated using the Bradford method was 49,779 mg/mL with a pH of 4.52.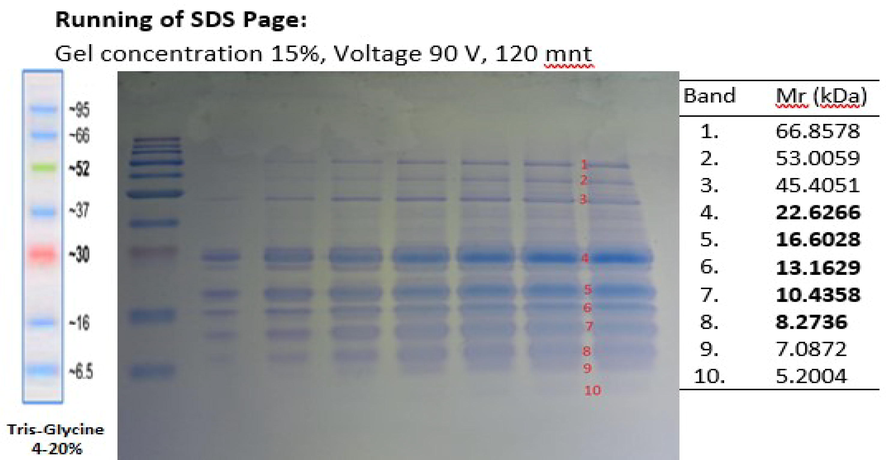
SDS PAGE of protein hydrolysate of green peas bromelain.
3.2 LERGDT peptide preparation.
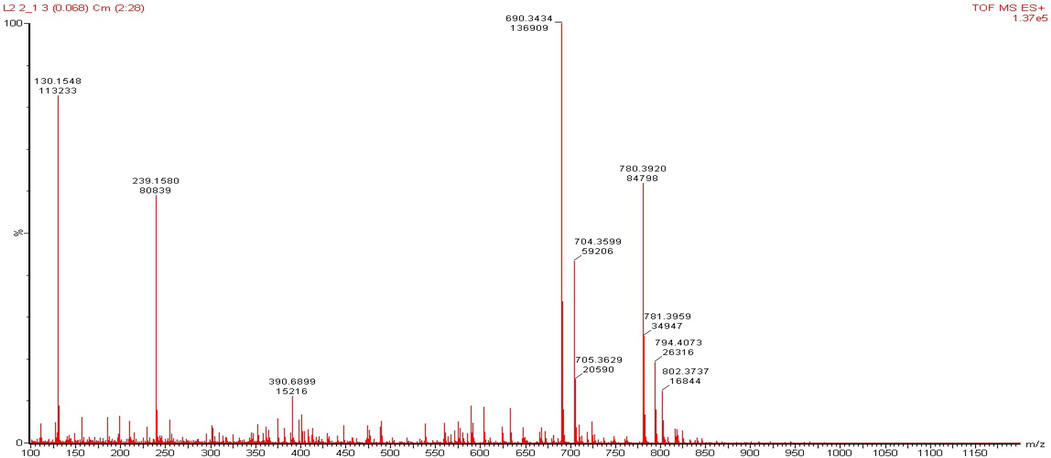
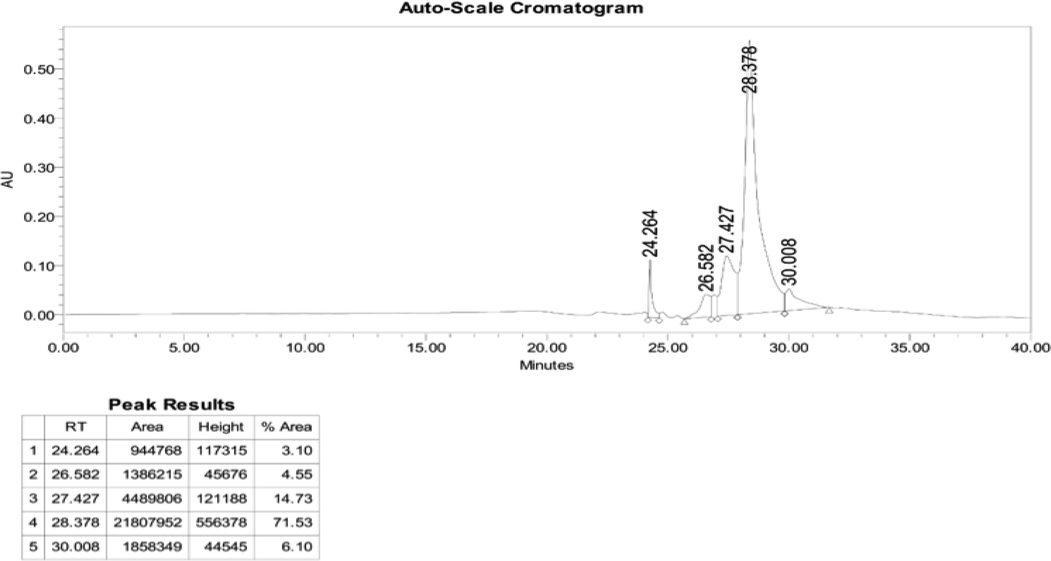
LERGDT peptide synthesis was carried out after the characterization process through HR-TOF-MS (Fig. 2), then the Analytical RP-HPLC process was carried out (Fig. 3). In the final step, the LERGDT peptide was purified using Semi-Preparative RP-HPLC (Fig. 4). After the freeze-drying process, the yield of the LERGDT peptide was 3.8 mg with a purity of 71.53%.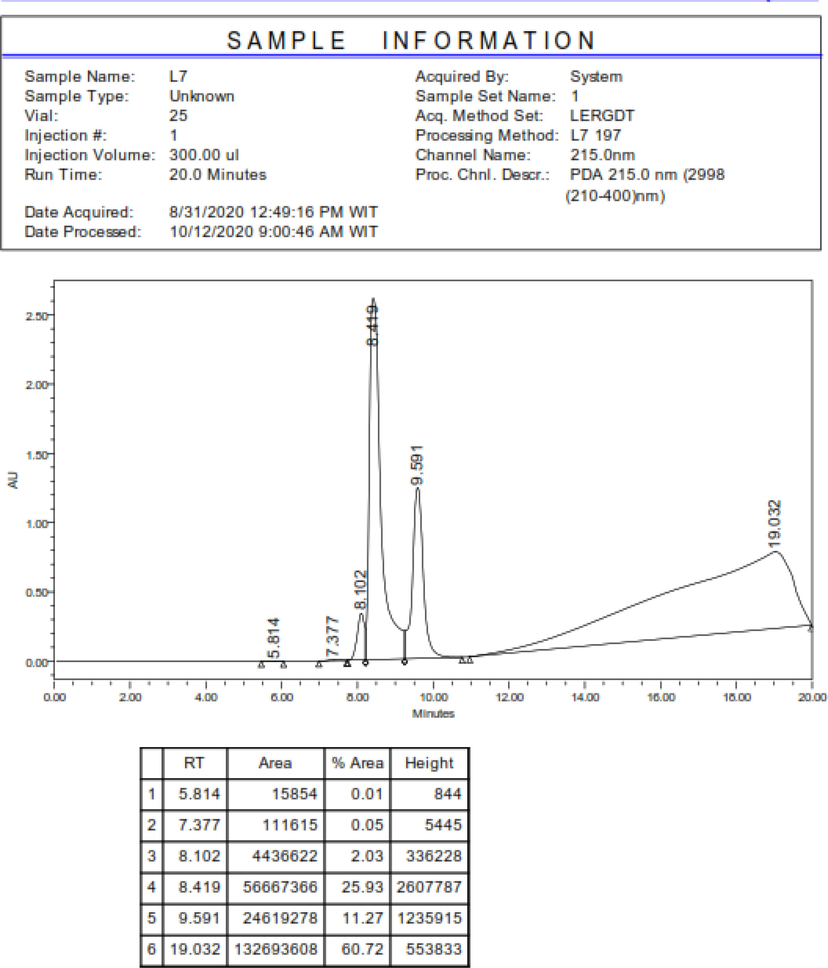
HR-TOFMS characterization.
RP-HPLC analysis of the fraction of the separation results.
Semi preparative RP-HPLC.
3.3 Effect of PHGPB and LERGDT on TGF-β1 levels
The positive control group showed a high increase in TGF-β1 levels after the mesangial cells were induced by 20 mM glucose. In the administration of PHGPB (100 and 25 g/mL) and LERGDT (100 and 25 g/mL), all results showed lower TGF-β1 levels than TGF-β1 positive controls (p < 0.05). Administration of PHGPB and LERGDT to kidney sclerosis cells models decreased by 20.95–52.66% fold the TGF-β1 level. The lowest TGF-β1 level was the group was given LERGDT 25 g/mL (83.84 ± 4.59 pg/mL) and was significantly different from the positive control (177.12 ± 8.01 pg/mL) (p < 0.05). The potency of PHGPB at doses of 100 and 25 g/mL is lower than LERGDT doses of 100 and 25 g/mL in reducing TGF-β1 levels (Fig. 5).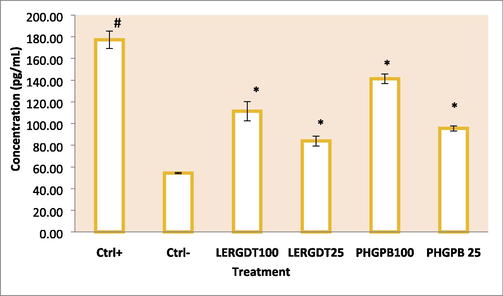
Effect of LERGDT, PHGPB toward level of TGF-β1 in CKD cells model. *Ctrl+: Positive control: glucose-induced mouse mesangial kidney cell; Ctrl-: Negative control: mouse mesangial kidney normal cells; LERGDT 100: positive control treated LERGDT 100 µg/mL; LERGDT 25: positive control treated by LERGDT 25 µg/mL; PHG 100: positive control treated PHG 100 µg/mL; PHG 25: positive control treated by PHGPB 25 µg/mL. *Data present in mean ± standard deviation, the experiment was three replication. The hashtag symbol (#) indicated a significant difference between positive control and negative control at p < 0.05, asterisk symbol (*) indicated a significant difference between the positive control and LERGDT 100, LERGDT 25; PHGPB 100, PHGPB 25 at p < 0.05 based on the Mann-Whitney U test.
3.4 Effect of PHGPB and LERGDT on SMAD gene expression
3.4.1 SMAD2 gene expression
On treatment, both PHGPB (100 and 25 g/mL) and LERGDT (100 and 25 g/mL) all showed lower SMAD2 gene expression than positive controls (p < 0.05). The provision effect of PHGPB and LERGDT caused low SMAD2 gene expression, especially at a dose of 25 g/mL, namely PHGPB 25 g/mL (4.32 ± 0.27) and LERGDT 25 g/mL (4.02 ± 0.30) and significantly different compared to the results of the negative control (29.75 ± 2.99) (p < 0.05). Both doses (100 and 25 g/mL) of LERGDT showed lower SMAD2 gene expression than PHGPB (Fig. 6a).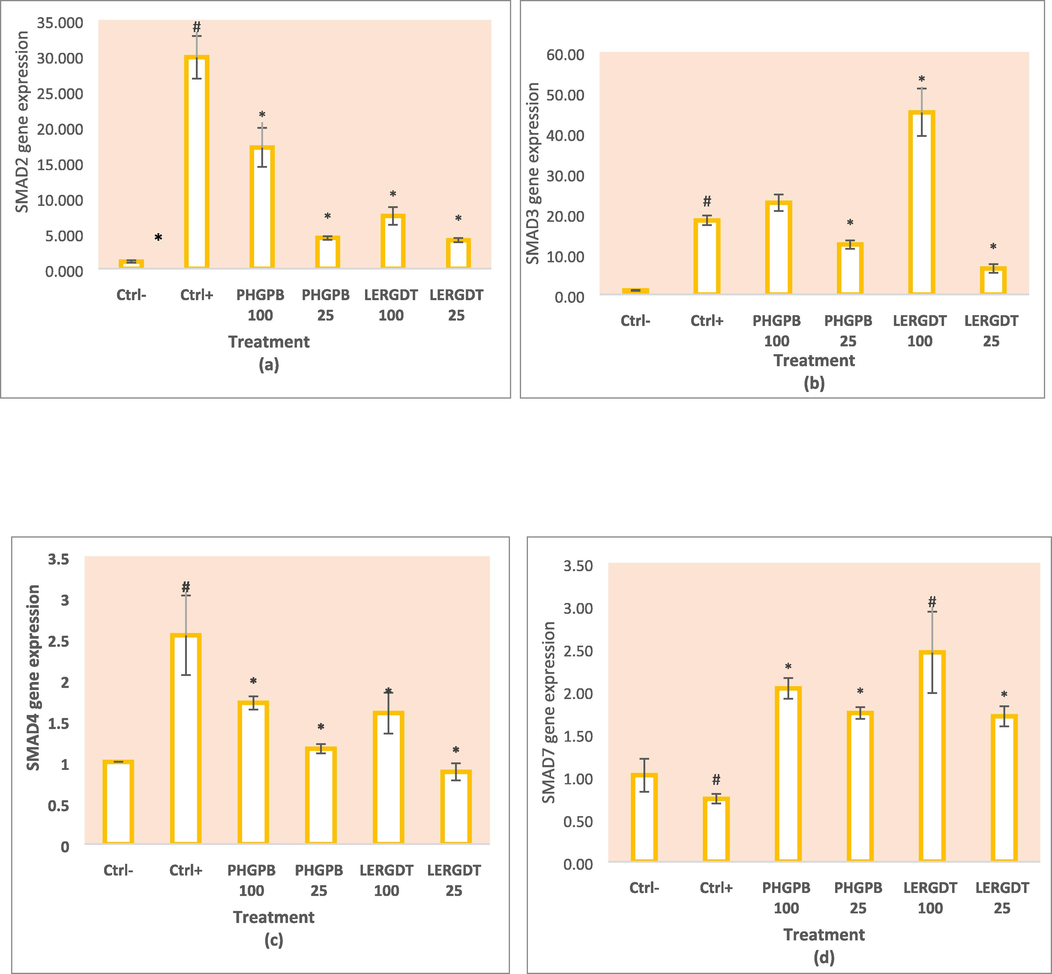
Effect of LERGDT, PHGPB toward SMAD genes expression in CKD cells model. a. Effect of LERGDT, PHGPB toward SMAD2 genes expression. b. Effect of LERGDT, PHGPB toward SMAD3 genes expression. c. Effect of LERGDT, PHGPB toward SMAD4 genes expression. d. Effect of LERGDT, PHGPB toward SMAD7 genes expression. The hashtag symbol (#) showed a significant difference between positive control and negative control at p < 0.05, asterisk symbol (*) indicated a significant difference between the positive control and LERGDT 100, LERGDT 25; PHGPB 100, PHGPB 25 at p < 0.05 based on the Mann-Whitney U test for SMAD4 gene and the Dunnet T3 post hoc test for SMAD7 gene.
3.4.2 SMAD3 gene expression
The SMAD3 gene expression in the positive control group compared to the negative control showed a very significant difference (p < 0.01). In the administration of PHGPB (100 g/mL) and LERGDT (100 g/mL), the results showed a higher SMAD3 gene expression than the positive control. However, small doses of PHGPB (25 g/mL) and LERGDT (25 g/mL) showed lower SMAD3 gene expression than positive controls, indicating suppression of SMAD3 gene expression. Administration of PHGPB 25 g/mL showed the results of SMAD3 gene expression 12.38 ± 1.04 and LERGDT 25 g/mL (6.44 ± 1.08) which were significantly different from the positive control (18.36 ± 0.17) (p < 0.05) (Fig. 6b).
3.4.3 SMAD4 gene expression
In the positive control group, there was a high expression of gene SMAD4. PHGPB (100 and 25 g/mL) and LERGDT (100 and 25 g/mL) treatments all showed lower SMAD2 gene expression than positive controls (p < 0.05). Administration of LERGDT 25 g/mL (0.88 ± 0.10) caused the lowest SMAD2 gene expression compared to positive control (2.54 ± 0.48), very significant difference (p < 0.05) and not significantly different from negative control (p > 0.05) (Fig. 6 c).
3.4.4 SMAD7 gene expression
The expression of gene SMAD7 in the positive control group showed lower results than the negative control gene expression after glucose-induced mesangial cells (Fig. 6d). In this study, both PHGPB (100 and 25 g/mL) and LERGDT (100 and 25 g/mL) all showed higher SMAD7 gene expression than positive controls (p < 0.05). Administration of LERGDT 100 g/mL (2.45 ± 0.48) the most increased SMAD7 gene expression compared to positive control (0.74 ± 0.06) and was significantly different (p < 0.05).
4 Discussion
The administration of both doses of PHGPB and LERGDT (dosage of 100 or 25 g/mL) showed lower TGF-β1 levels compared to positive controls (p < 0.05) even at a dose of 25 g/mL showed not significantly different results from negative control (p > 0.05) (Fig. 5). There were unexpected results, surprisingly the provision of low doses of PHGPB and LERGDT showed better results, possibly because the antifibrotic agent, in this case, RGD had an exact concentration that needs to be investigated further. The RGD peptide in PHGPB or LERGDT may bind to the integrin tends to decrease TGF-β1 levels in a dose-dependent mechanism. The potency of PHGPB was slightly lower than LERGDT in reducing TGF-β1 levels because the RGD peptide content in crude PHGPB solution was less than the overall RGD peptide in pure LERGDT. Higher doses do not necessarily result in lower TGF-β1 levels. Strong evidence shows that TGF-β1 can act as a negative regulator of the immune response, so necessary to carefully evaluate this key factor. On the other hand, it is needed to investigate safe measures that can prevent the RGD-integrin-TGF-β1 complex from triggering the development of renal fibrosis (Lan and Nikolic-Paterson, 2018).
Many therapeutic drug candidates have been tested to control pathological fibrosis and present challenges for current kidney disease treatment. Several natural substances show promising results to inhibit the occurrence of fibrosis through this TGF-β/ signaling pathway of SMAD, such as Quercetin, a dietary compound (Phan et al., 2004); and other natural plants, such as curcumin, gambogic acid, genistein, resveratrol, and Cinnamomum cassia extract inhibits epithelial mesenchymal-transition factor (EMT) which act on transformation factor growth of the TGF-β/ signaling pathway of SMAD (Avila-Carrasco et al., 2019).
TGF-β1 mediates its biological function in the fibrosis process through the SMAD signaling pathway and plays a central role in fibrogenesis (Kisseleva and Brenner, 2008). The first protein bound by TGF-β1, the SMAD protein, plays an important role in the transduction of receptor signals to target genes in the nucleus (Xu et al., 2016).
The TGF-β type I receptor phosphorylates the SMAD2 and SMAD3 complexes, forming a heteromeric complex with SMAD4 (Schnabl et al., 2001). On the other hand, SMAD7 effectively prevents SMAD2 and SMAD3 interactions; efficiently avoids the expression of proteins regulated by SMAD signaling (Nakao et al., 1997). SMAD7 forms a stable complex with the activated type I TGF- receptor and effectively prevents the interaction of the SMAD2 and SMAD3 complexes with the receptor and their subsequent phosphorylation, thereby efficiently preventing downstream or subsequent signaling (Heldin et al., 1997).
Glucose induction caused the expression of all SMAD genes in positive control mesangial cells except for SMAD7 gene expression which resulted in low gene expression (Fig. 6a–d). Expression of SMAD 2, 3, and 4 genes increased after cells were induced by glucose, especially in SMAD2 gene expression (Fig. 6a). Both SMAD2 and SMAD3 were detected in fibrotic kidneys in animal models and patients with CKD (Meng, Chung, and Lan, 2013). SMAD2 and SMAD3 have different functions in fibrogenesis, although they share 90% similarity in amino acid sequence. SMAD3 binds directly to the collagen promoter to stimulate its production thereby increasing renal fibrosis (Chen et al., 1999; Vindevoghel et al., 1998). SMAD2 is not able to bind to genomic DNA directly, in contradiction to SMAD3 (Dennler et al., 1998). Administration of low doses of PHGPB and LERGDT resulted in low SMAD3 and SMAD2 gene expression, it is assumed that the potency of low dosage is excellent in depressed SMAD3 and SMAD2 gene expression (Fig. 6a, b). Administration of high doses of PHGPB and LERGDT also caused low SMAD2 gene expression (Fig. 6a), however, their potency is lower than their low dosage. This condition is like the condition that occurs in the TGF-β measurements.
In this study, high SMAD2 gene expression in the positive control group was not our expectation (Fig. 6a). To date, the role of SMAD2 remains largely controversial and unclear in kidney disease and requires further investigation (Hu et al., 2018). However, one study found that increasing SMAD3 from tubular epithelial cells mediated by renal fibrosis in vivo and in vitro, was associated with increased nuclear translocation and phosphorylation of SMAD3, and binding of SMAD3 to the Col1A2 promoter caused knock-out of SMAD2 (Dennler et al., 1998). Administration of PHGPB and LERGDT respectively showed lower SMAD 2, 3, and 4 gene expression compared to positive controls, except for the administration of high doses of PHGPB and LERGDT to SMAD3 which resulted in higher gene expression than the positive control SMAD3 gene expression (Fig. 6b). This condition needs to be investigated further. TGF-β is not the only molecule that can activate SMAD (Hu et al., 2018; Dennler et al., 1998). There are many other mediators than TGF-β1 that are capable activate SMAD2 and SMAD3 independently because SMAD besides can interact with another signaling pathway like the MAP Kinase signaling pathway (ERK, JNK, p38), also acts as a signal integrator and plays a central role in the pathophysiological process of kidney disease (Lan and Chung, 2011; Wang, Koka, and Lan, 2005). In general, LERGDT potency was greater than PHGPB in increasing SMAD 2, 3, and 4 gene expression. Lower doses of LERGDT (25 g/mL) showed better potencies than higher doses (100 g/mL), as shown in TGF-β levels after LERGDT administration.
In SMAD 7 gene expression, the positive control showed a lower yield (0.74 ± 0.06) than the negative control (1.00) (Fig. 6d). It indicates that in the positive control group, a decrease of SMAD7 gene expression will cause increasing fibrogenesis considering the role of SMAD7 as a fibrosis prevention gene. An effective and rational therapeutic goal to prevent progressive fibrosis in CKD is to target the reduction of SMAD3 activity and upregulation of SMAD7, as well as specifically modulate the fibrosis-associated SMAD3-dependent miRNA (Meng et al., 2015).
5 Conclusion
Administration of low doses of PHGPB and LERGDT showed lowering TGF-β1 levels. Provision of PHGPB and LERGDT suppressed the expression of SMAD 2, 3, and 4 genes, except for the administration of high doses of PHGPB and LERGDT against SMAD3. On the other hand, the administration of PHGPB and LERGDT increased the expression of the SMAD 7 gene. PHGPB and LERGDT had promising anti-fibrotic effects on the assay of TGF-β1/SMAD 2,3,4 and 7 gene expressions in glucose-induced MES13 SV40 mesangial cells.
Funding
This research was carried out thanks to a grant from the Ministry of Education, Culture, Research, and Technology, Directorate General of Higher Education with Contract Number 8/E1/KPT/2020.
Declaration of Competing Interest
The authors declare that they have no known competing financial interests or personal relationships that could have appeared to influence the work reported in this paper.
References
- Natural plants compounds as modulators of epithelial-to-mesenchymal transition. Front. Pharmacol.. 2019;10
- [CrossRef] [Google Scholar]
- Stimulation of type I collagen transcription in human skin fibroblasts by TGF-β: Involvement of Smad 3. J. Invest. Dermatol.. 1999;112(1):49-57.
- [CrossRef] [Google Scholar]
- Direct binding of Smad3 and Smad4 to critical TGFβ-inducible elements in the promoter of human plasminogen activator inhibitor-type 1 gene. EMBO J.. 1998;17(11):3091-3100.
- [CrossRef] [Google Scholar]
- Pathogenetic role of Arg-Gly-Asp-recognizing integrins in acute renal failure. PNAS. 1993;90(12):5700-5704.
- [CrossRef] [Google Scholar]
- Proteinase activity and stability of natural bromelain preparations. Int. Immunopharmacol.. 2004;5(4):783-793.
- [CrossRef] [Google Scholar]
- Harlow E., Lane D. (2006) ‘Bradford Assay’, Cold Spring Harbor Protocols, 2006(6), p. pdb.prot4644. doi: 10.1101/pdb.prot4644.
- TGF-β signaling from cell membrane to nucleus through SMAD proteins. Nature. 1997;465–471
- [CrossRef] [Google Scholar]
- Kidney therapeutic potential of peptides derived from the bromelain hydrolysis of green peas protein. Iran. J. Basic Med. Sci.. 2019;22(9):1016-1025.
- [CrossRef] [Google Scholar]
- Hidayat, M. (2019b). Measurement and Producing Green Peas Protein Hydrolysate (Pisum sativum) as An Antifibrotic for Chronic Kidney Disease Therapy. Universitas Kristen Maranatha. Ministry of Law and Human Rights of the Republic of Indonesia. Patents. Registration number: P00201907647.
- New insights into TGF-β/Smad signaling in tissue fibrosis. Chem. Biol. Interact.. 2018;292:76-78.
- [CrossRef] [Google Scholar]
- Cleavage of structural proteins during the assembly of the head of bacteriophage T4. Nature. 1970;227(5259):680-685.
- [CrossRef] [Google Scholar]
- Transforming growth factor-β and smads. Contrib. Nephrol.. 2011;170:75-82.
- [CrossRef] [Google Scholar]
- Editorial: Advances in mechanisms of renal fibrosis. Front. Physiol.. 2018;9:284.
- [CrossRef] [Google Scholar]
- Blood pressure lowering effect of a pea protein hydrolysate in hypertensive rats and humans. J. Agric. Food. Chem.. 2011;59(18):9854-9860.
- [CrossRef] [Google Scholar]
- Identification and inhibitory properties of multifunctional peptides from pea protein hydrolysate. J. Agric. Food. Chem.. 2010;58(21):11471-11476.
- [CrossRef] [Google Scholar]
- Cellular and molecular mechanisms of renal fibrosis. Nat. Rev. Nephrol.. 2011;7(12):684-696.
- [CrossRef] [Google Scholar]
- Inhibition of hepatocyte apoptosis: an important mechanism of corn peptides attenuating liver injury induced by ethanol. Int. J. Mol. Sci.. 2015;16(9):22062-22080.
- [CrossRef] [Google Scholar]
- Synthesis, antioxidant activity, and structure-activity relationship of SCAP1 analogues. Int. J. Pept. Res. Ther.. 2021;27(1):17-23.
- [CrossRef] [Google Scholar]
- Role of the TGF-β/BMP-7/Smad pathways in renal diseases. Clin. Sci.. 2013;124:243-254.
- [CrossRef] [Google Scholar]
- Solid phase peptide synthesis. I. The synthesis of tetrapeptide. J. Am. Chem. Soc.. 1963;85(14):2149-2154.
- [CrossRef] [Google Scholar]
- Miller L.M. (2016) The development of small molecule inhibitors for fibrosis drug discovery. Available at: http://digitool.lib.strath.ac.uk:80/R/?func=dbin-jump-full&object_id=27922 (Accessed: 3 February 2021).
- Identification of Smad7, a TGFβ-inducible antagonist of TGF-β signaling. Nature. 1997;389(6651):631-635.
- [CrossRef] [Google Scholar]
- Suppression of transforming growth factor beta/Smad signaling in keloid-derived fibroblasts by quercetin: Implications for the treatment of excessive scars. J. Trauma Injury Infect. Crit. Care. 2004;57(5):1032-1037.
- [CrossRef] [Google Scholar]
- Effects of cationic property on the in vitro antioxidant activities of pea protein hydrolysate fractions. Int. Food Res. J.. 2011;44(4):1069-1074.
- [CrossRef] [Google Scholar]
- Amino acid composition and antioxidant properties of pea seed (Pisum sativum L.) enzymatic protein hydrolysate fractions. J. Agric. Food. Chem.. 2010;58(8):4712-4718. PMID: 20359226
- [CrossRef] [Google Scholar]
- Ethanol extract of jati belanda (Guazuma ulmifolia L.) as therapy for chronic kidney disease in in vitro model. J. Rep. Pharm. Sci.. 2019;8(2):229-235.
- [CrossRef] [Google Scholar]
- The role of Smad3 in mediating mouse hepatic stellate cell activation. Hepatology. 2001;34(1):89-100.
- [CrossRef] [Google Scholar]
- Song J., Tan H., Perry A.J., Akutsu T., Webb G.I., Whisstock J.C., et al. (2012). PROSPER: An integrated feature-based tool for predicting protease substrate cleavage sites, PLoS ONE. Edited by N. Srinivasan, 7(11): e50300. doi: 10.1371/journal.pone.0050300.
- SMAD3/4-dependent transcriptional activation of the human type VII collagen gene (COL7A1) promoter by transforming growth factor β. PNAS. 1998;95(25):14769-14774.
- [CrossRef] [Google Scholar]
- Transforming growth factor-β and Smad signaling in kidney diseases. Nephrology. 2005;48–56
- [CrossRef] [Google Scholar]
- Regulation of adipogenesis and key adipogenic gene expression by mangosteen pericarp extract and xanthones in 3T3-cells. Biotropia J.. 2020;27(1):24-30.
- [CrossRef] [Google Scholar]
- TGF-β/SMAD pathway and its regulation in hepatic fibrosis. J. Histochem. Cytochem. Histochem. Soc.. 2016;64(3):157-167.
- [CrossRef] [Google Scholar]


