

Translate this page into:
The possible role of vitamins E and C in reducing the toxicity of copper nanoparticles in the kidney and liver of the rats (Rattus norvegicus)
⁎Corresponding author. yshotop@gmail.com (Yahya M. Shotop),
-
Received: ,
Accepted: ,
This article was originally published by Elsevier and was migrated to Scientific Scholar after the change of Publisher.
Peer review under responsibility of King Saud University.
Abstract
This study aims to ascertain the extent of accumulation of copper in the tissue of kidneys and liver, in addition to elucidate the effects of toxic nanoparticles on the kidneys and liver’s functions. Also it aims to measure some of the standards of antioxidants. We randomly had divided 56 rats (Rattus norvegicus) weigh 120 g ± 10 g into seven treatment groups and one of them is a controller. Rats in treatment groups were given 100 mg/kg/day of copper nanoparticles and 250 mg/kg/day of vitamins E and C.
The obtained results had indicated an accumulation of copper nanoparticles in the liver and kidneys of the rats in the treatment groups. We also found that the accumulation in the liver is significantly more than in the kidneys. Treatment also resulted in the increase of ALT, AST and GGT enzymes level and serum urea and creatinine in blood serum in the copper nanoparticles treated groups. Also there’s increase in level of lipid peroxide and decrease in the level of glutathione in the liver and the kidneys. When we made a comparison between the controlled group with the treated groups by nanoparticle and vitamins, the results had confirmed the effective role of vitamins as antioxidants that reduce the accumulation of nanoparticles in tissues, and returns the level of liver enzymes, Kidney function, lipid peroxide and glutathione to almost normal levels.
Keywords
Copper nanoparticles
Vitamin E
Vitamin C
Liver
Kidney
Accumulation
Enzymes

1 Introduction
Nanotechnology is considered at the forefront of the most important science, and its applications are found in various industrial fields, which poses a real danger to human health and safety (Dziendzikowska et al., 2012).
Due to the increasing use of nanoparticles in various fields, it is important to study the biological effects that these particles that may cause damage on various organs of the human’s body. The toxicity of nanoparticles and their potential risks to human’s health are currently a matter of concern (Aruoja et al., 2009), particularly as they are widely used in medicine, agriculture, and commerce (Buzea et al., 2007).
When the body absorbs these nanoparticles, they have been found to be distributed in various organs, such as the kidneys, liver, and heart, in addition to the bone marrow (Chen et al., 2006), and they can cause oxidative stress (Jones and Grainger, 2009). The huge range of applications of nanoparticles raise concerns about human exposure and the potential direct impact on human’s health (Aueviriyavit et al., 2014).
Copper nanoparticles are one of the most common types of nanoparticles (Xu et al., 2012). They are used as antifungal, microbial, and viral agents; in the manufacture of electrical equipment; the production of cosmetics (Prabhu and Poulose, 2012); as alternatives to antibiotic treatment, in the production of polymers, inks, and lubricants; and in air purifiers and liquids (Noureen and Jabeen, 2015). Furthermore, they are often used as industrial catalysts and occur at high levels in the vicinity of factories (Kim et al., 2009).
On the other hand, we have vitamin E which is found in fruits, vegetables, legumes, oilseeds, grains, and other foods. It is important for health due to its antioxidant capacity. It can neutralize free radicals, which destroy cellular molecules, and it preserves the integrity of renal tubules. In addition to being an anti-toxin agent (Traber and Atkinson, 2007).
Vitamin C is abundant in many natural sources, including fresh fruits and vegetables. The antioxidant activity of vitamin C can reduce DNA damage and ameliorate the inflammatory response to many toxic substances (Bakhshiani and Fazilati, 2014).
This study assumes that vitamin E and C have an effective role in reducing the toxicity of copper nanoparticles including bioaccumulation of copper content in the liver and kidney enzymes.
2 Materials and methods
This experiment was conducted on the ethics’ criteria of the Animal Ethics Committee of King Saud University, Ethical Approval No. KSU-SE-19-32.
The animals which are used were male rats (Rattus norvegicus) that we obtained from the Animal House, Faculty of Science, King Saud University, Riyadh. The rats, which weigh 120 g ± 10 g were placed in special stainless cages while maintaining their diet, and they were kept at a room under the temperature of 25 °C ± 5 °C and under a 12/12 h light/dark cycle.
2.1 Experiment design:
The rats were given copper nanoparticles orally. The nanoparticles, of 99.9% purity and 10 nm in size, were bought from Sigma Aldrich, and they were given at a dose of 100 mg/kg body weight (BW)/day. The rats were given vitamins E and C at a dose of 250 mg/kg BW/day after the fourth week and until the eighth week of experimentation. The animals were divided into seven groups (n = 8) as follows: the first group served as a control; it was given drinking water without any additives. The second group was given vitamin E at a dose of 250 mg/kg BW/day, the third group was given vitamin C at a dose of 250 mg/kg BW/day, the fourth group was given copper nanoparticles at a dose of 100 mg/kg BW/day, the fifth group was given copper nanoparticles at a dose of 100 mg/kg BW/day and vitamin E at a dose of 250 mg/kg BW/day, the sixth group was given copper nanoparticles at a dose of 100 mg/kg BW/day and vitamin C at a dose of 250 mg/kg BW/day, and the seventh group was given copper nanoparticles at a dose of 100 mg/kg BW/day and both vitamin E and vitamin C at a dose of 250 mg/kg BW/day. The animals were dosed with copper nanoparticles for one month and then treated with vitamins for another month by oral gavage.
In addition, an electronic balance was used to weigh the rats when they were received from the animal house, at the end of the first month of the experiment, and at the end of the second month, weight gained was determined. After the eighth week, the animals were euthanized in the anesthesia container with carbon dioxide gas. Blood was collected by cardiac puncture, centrifuged at 20 °C, 1500 rpm for 10 min and then serum was quickly frozen at −80 °C to preserve enzymes for next assay of biochemical analysis. The animals’ kidneys and livers were obtained for antioxidants enzyme analysis.
2.2 Bioaccumulation
Samples were prepared from the liver and kidneys to measure the accumulation of copper content in different groups by Inductively Coupled Plasma Mass Spectrometry (ICP-MS) (Current Method, 2011).
2.3 Measurement of liver and kidney function efficiency:
Some measurements were taken to assess the efficiency of liver and kidney’s function in the groups of animals; these included measurements of the functional enzymes ALT and AST by the method of (Madiha et al., 2011) and GGT by the method of (Hyder et al., 2013), urea by the method of (Kaplan et al., 1965), and creatinine by the method of (Karabulut-Bulan et al., 2008).
2.4 Measurement of the levels of lipid peroxidation (LPO) and glutathione (GSH):
LPO was measured by the method of (Ohkawa et al., 1979) and GSH was measured by the method of (Noeman et al., 2011).
2.5 Statistical analysis
-The results are reported as means ± standard deviation (SD). Statistical analysis of the parameters was done using SPSS; the parameters were subjected to one-way ANOVA analysis of variance, followed by a Least Significant Difference Test (LSD) to determine trends for differences among all groups, and graphs were designed using GraphPad Prism 5.
3 Results
3.1 Rat weight
Rats treated with copper nanoparticles at a dose of 100 mg/kg BW/day exhibited a significant decrease in weight at the end of the first month of treatment compared to controlled group; however, giving rats vitamin E and C at a dose of 250 mg/kg BW/day resulted in a significant increase in weight by the end of the second month as shown in Fig. 1 .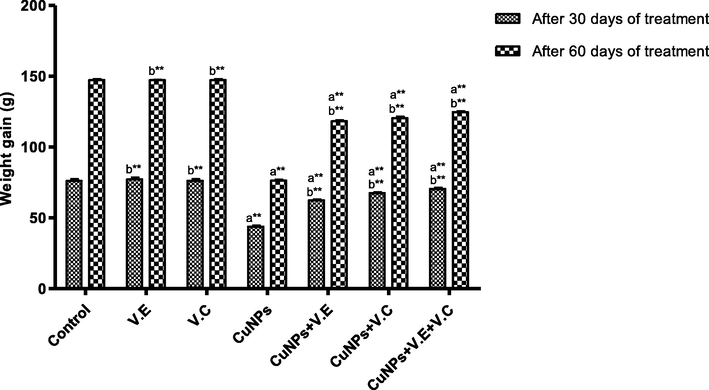
The means and SD of the effects of copper nanoparticles at 100 mg/kg BW/day and of vitamin E, vitamin C, and vitamins E and vitamin C together at 250 mg/kg BW/day on the weights of the rats. p* < 0.05, **p < .001. a: Differ significantly compared to control, b: Differ significantly compared to group of copper nanoparticles.
3.2 Bioaccumulation of copper content in the livers and kidneys of rats
The accumulative level of copper content in the liver was higher than in the kidneys. Compared with the control group, the group treated with copper nanoparticles showed a significant increase (p < 0.05) in the level of accumulation of copper, whereas we observed low levels of accumulation of copper nanoparticles when this group was treated with vitamins E and C, either on their own or together, as shown in Fig. 2.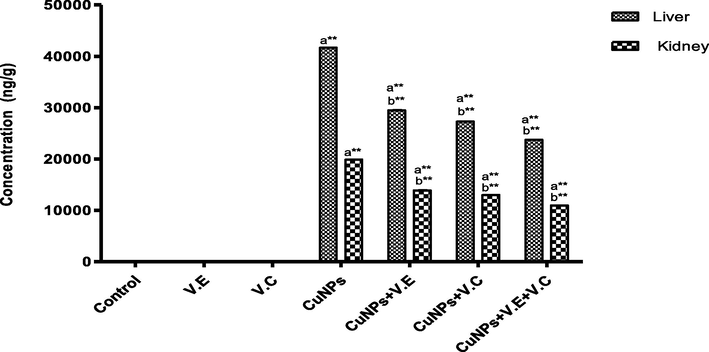
The means and SD of the effects of copper nanoparticles at 100 mg/kg BW/day and of vitamin E, vitamin C, and vitamins E and C together at 250 mg/kg BW/day on the bioaccumulation of copper content in the livers and kidneys of rats. p* < 0.05, **p < .001. a: Differ significantly compared to control, b: Differ significantly compared to group of copper nanoparticles.
3.3 Measuring the levels of liver enzymes and assess kidney function
We also detected a significant increase in the levels of liver enzymes and urea and creatinine in the blood serum of the group treated with copper nanoparticles compared to that of the control group. Treatment with vitamins E and C separately affected the results of the treatment, whereas the therapeutic role of vitamins E and C administered together was clearly seen in the reduction of the effects of copper nanoparticles on the levels of liver enzymes and serum urea and creatinine, as shown in the Figs. 3–7 ).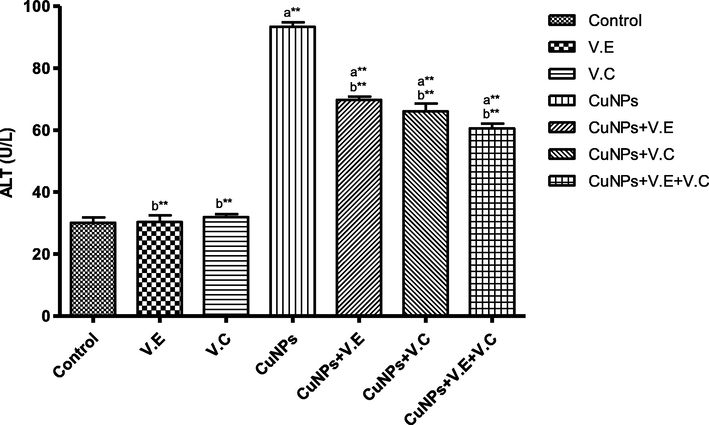
The means and SD of the effects of copper nanoparticles at 100 mg/kg BW/day and of vitamin E, vitamin C, and vitamins E and C together at 250 mg/kg BW/day on ALT enzyme activity. Significance Means: p* < 0.05, **p < .001. a: Differ significantly compared to control, b: Differ significantly compared to group of copper nanoparticles.
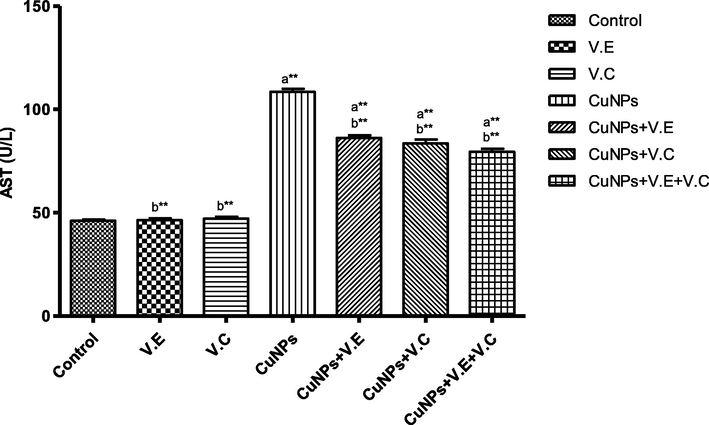
The means and SD of the effects of copper nanoparticles at 100 mg/kg BW/day and of vitamin E, vitamin C, and vitamins E and C together at 250 mg/kg BW/day on AST enzyme activity. p* < 0.05, **p < .001. a: Differ significantly compared to control, b: Differ significantly compared to group of copper nanoparticles.
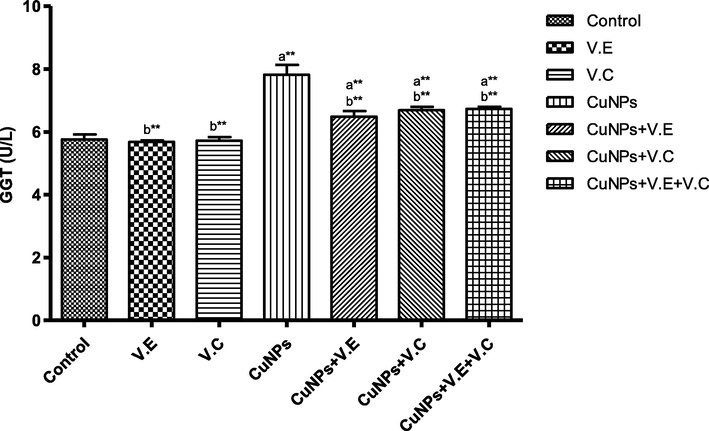
The means and SD of the effects of copper nanoparticles at 100 mg/kg BW/day and of vitamin E, vitamin C, and vitamins E and C together at 250 mg/kg BW/day on GGT enzyme activity. p* < 0.05, **p < .001. a: Differ significantly compared to control, b: Differ significantly compared to group of copper nanoparticles.
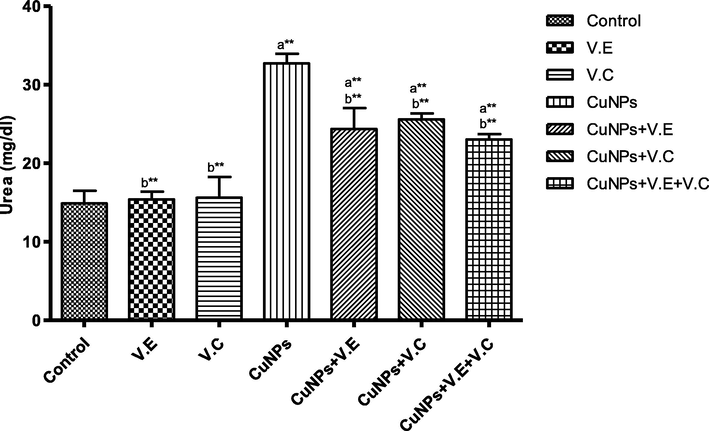
The means and SD of the effects of copper nanoparticles at 100 mg/kg BW/day and of vitamin E, vitamin C, and vitamins E and C together at 250 mg/kg BW/day on urea. Significance Means: p* < 0.05, **p < .001. a: Differ significantly compared to control, b: Differ significantly compared to group of copper nanoparticles.
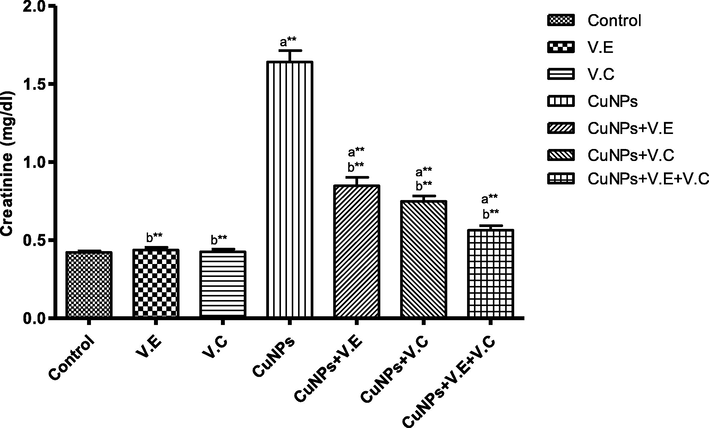
The means and SD of the effects of copper nanoparticles at 100 mg/kg BW/day and of vitamin E, vitamin C, and vitamins E and C together at 250 mg/kg BW/day on creatinine. p* < 0.05, **p < .001. a: Differ significantly compared to control, b: Differ significantly compared to group of copper nanoparticles.
The means and SD of the effects of copper nanoparticles at 100 mg/kg BW/day and of vitamin E, vitamin C, and vitamins E and C together at 250 mg/kg BW/day on lipid peroxidation. p* < 0.05, **p < .001. a: Differ significantly compared to control, b: Differ significantly compared to group of copper nanoparticles.
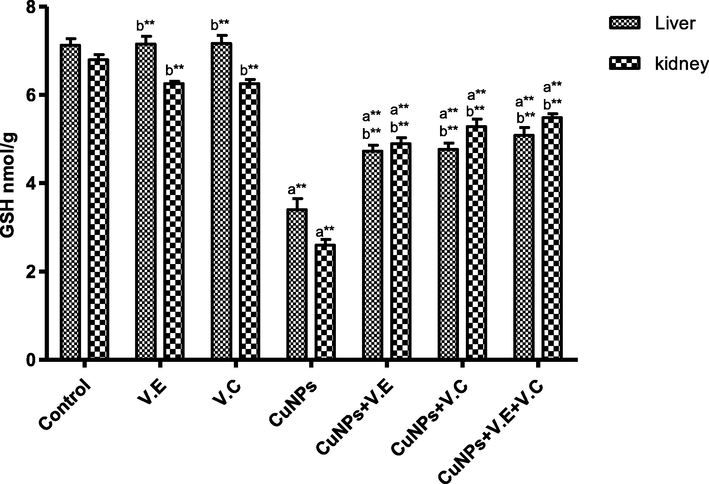
The means and SD of the effects of copper nanoparticles at 100 mg/kg BW/day and of vitamin E, vitamin C, and vitamins E and C together at 250 mg/kg BW/day glutathione. p* < 0.05, **p < .001. a: Differ significantly compared to control, b: Differ significantly compared to group of copper nanoparticles.
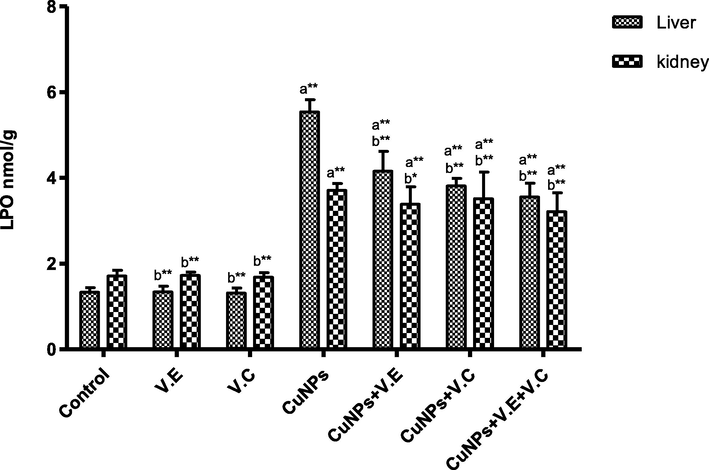
3.4 Measuring the levels of lipid peroxidation and glutathione
A significant increase was observed in the level of LPO and a significant decrease in the level of GSH in the group treated with copper nanoparticles compared to the control group. Treatment with vitamins E and C separately affected the results of the treatment, whereas the therapeutic role of vitamins E and C administered together was clearly shown in increasing the level of LPO and reducing the level of GSH in the livers and kidneys of rats treated with copper nanoparticles, as shown in the Figs. 8 and 9.
4 Discussion
4.1 Body weight
The results of the current study revealed a significant reduction in weight in the rats treated with copper nanoparticles compared to the control group. No significant change was observed in the weights of rats treated with vitamins C and E compared to the control group for the same period. We also observed a significant improvement in the weights of rats treated with copper nanoparticles for 30 days and then treated with vitamins for a further 30 days. Our findings are in line with those of (Elle et al., 2013), in that rats treated with nanoparticles may lose weight. (Fatemi et al., 2017) demonstrated that dosing rats with silver nanoparticles at a dose of 100 mg/kg BW/day resulted in a decrease in the weight of rats compared to a control group, and the results were also in agreement with the findings of (Shahare et al., 2013), that copper nanoparticles can cause wasting of adult rats.
4.2 Bioaccumulation
Our findings suggest that copper nanoparticles accumulate in both the liver and kidneys. This is similar with study (Wu and Tang, 2018), who showed that liver and kidneys are the main sites of the accumulation of nanoparticles.
Our results are also consistent with (Balasubramanian et al., 2010), who found nanoparticles in the kidneys, blood, testicles, and liver in rat, with the greatest accumulation in the liver and kidneys, and with (Tunçsoy and Erdem, 2018), who found nanoparticle accumulation to be significantly higher in liver and kidney tissue compared to the control group when studying the accumulation of copper in tissues of Oreochromis niloticus exposed to copper oxide nanoparticles and copper sulfate.
The copper nanoparticles accumulated in the liver more than in kidneys. This is similar with (Ostaszewska et al., 2018), who found the greatest accumulation of nanoparticles in the liver when studying the cytotoxicity of silver and copper nanoparticles on liver cells of fish (Oncorhynchus mykiss), and with (Jiménez-Lamana et al., 2014), who found accumulation of particles in both liver and kidney tissues in rat and whose analysis using ICP-MS showed greater accumulation of nanoparticulate in liver cells than in the kidneys. This greater accumulation in the liver than in the kidneys may be attributed to the fact that the liver can remove toxic compounds from the blood and convert them into chemical forms that can be excreted easily; thus, the nanoparticles may have an effect on the liver as a major organ of detoxification (Cheraghi et al., 2013).
The findings also suggest that vitamins E and C lower the level of accumulation of nanoparticles in both liver and kidneys. This is in line with (Yousef and Mohamed, 2015), who showed that treatment with vitamin B may protect liver tissue in rat from damage due to the toxic effects of nanoparticles.
4.3 Liver enzymes and assess kidney function
In this study, we assessed liver function through determining the levels of AST, ALT, and GGT enzymes and kidney function through determining the levels of urea and creatinine.
An important indicator in evaluating liver health is the presence of ALT and AST enzymes. However, nanoparticles can be transmitted as toxic substances to the liver, where their levels may become greater than in the blood. The enzyme GGT, which plays an important role in helping the liver metabolize drugs and other toxins, and the liver damage from a polluting substance may lead to high levels of GGT.
Our findings indicate an increase in the levels of the liver enzymes ALT and AST in the group that was treated with nanoparticles compared to the control group, which is in line with the findings of (Parang and Moghadamnia, 2018), which indicated that there were significant increases in the average levels of ALT and AST in experimental groups in adult male rats.
Our findings also indicate an increase in the levels of the enzyme GGT in the group treated with copper nanoparticles compared with the control group, which is in line with (Dharmarajan et al., 2017), who found that copper nanoparticles increased the levels of ALT, AST, and GGT in the blood, which may indicate either a partial inactivation of the enzymes or a reduction in their synthesis due to the effect of nanoparticles (Yang et al., 2008). Thus, these enzymes can be used as an indicator of pollution by copper nanoparticles.
The concentrations of urea and creatinine in the blood serum, as shown in our data, in the group that was treated with nanoparticles were high compared to those in the control group.
Our findings also indicate that vitamins E and C reduced the effects caused by nanoparticles because of their antioxidant capacity; they can neutralize free radicals. This is in line with the results of (El-Keredy et al., 2017), showing that vitamin C may reduce the harmful effects of copper nanoparticles on Nile tilapia (Oreochromis niloticus), and also with the findings of (Yousef and Mohamed, 2015) that B vitamins significantly reduced the levels of ALT and AST in rat livers.
4.4 Levels lipid peroxidation and glutathione
The findings reveal an increase in the level of LPO, which may be due to the stimulation of the fatty acetyl-CoA enzyme, which is an important molecule in the processes of metabolism and direct oxidation of fatty acids that lead to an increase in the production of endogenous hydrogen peroxide and thus contribute to the production of lipid peroxide (Basha and Sujitha, 2011). Several previous studies conducted on either experimental or in vitro animals have reported that the toxicity of nanoparticles is associated with induction of oxidative stress and Lipid peroxidation (Arora et al., 2008). According to (Gopinath et al., 2010), silver nanoparticles cause cell apoptosis and DNA damage through mechanisms related to oxidative stress and Lipid peroxidation.
Our findings showed a decline in the level of GSH in the groups treated with copper nanoparticles, which is in line with (Yu et al., 2013), who observed that treatment with silver nanoparticles at a dose of ≥ 100 mg/kg BW/day reduced the activities of catalase and GSH in mice.
The treatment with vitamins C and E at a dose of 250 mg/kg BW returned the GSH and lipid peroxide levels to almost normal levels compared to the control group, and the significant increase in GSH and the significant decrease in LPO were attributed to the active role of the vitamins in activating the enzymatic defense system (Chen and Thacker, 1984).
5 Conclusion
This study aimed to clarify the role of vitamin E and C in reducing the harmful effects of copper nanoparticles, which causing many health problems. The results confirmed the effectiveness of vitamins E and C as antioxidants that reduce the accumulation of copper nanoparticles and have proven effectiveness in restoring liver and kidney enzymes to nearly normal levels, as well as getting rid of harmful free radicals.
Acknowledgements
The authors would like to thank Deanship of scientific research in King Saud University for funding and supporting this research through the initiative of DSR Graduate Students Research Support (GSR).
Declaration of Competing Interest
The authors declare that they have no known competing financial interests or personal relationships that could have appeared to influence the work reported in this paper.
References
- Cellular responses induced by silver nanoparticles: in vitro studies. Toxicol. Lett.. 2008;179(2):93-100.
- [Google Scholar]
- Toxicity of nanoparticles of CuO, ZnO and TiO2 to microalgae Pseudokirchneriella subcapitata. Sci. Total Environ.. 2009;407(4):1461-1468.
- [Google Scholar]
- Mechanistic study on the biological effects of silver and gold nanoparticles in Caco-2 cells – Induction of the Nrf2/HO-1 pathway by high concentrations of silver nanoparticles. Toxicol. Lett.. 2014;224(1):73-83.
- [Google Scholar]
- Vitamin C can reduce toxic effects of nano zinc oxide. Int. Res. J. Biol. Sci. 2014;3:65-70.
- [Google Scholar]
- Biodistribution of gold nanoparticles and gene expression changes in the liver and spleen after intravenous administration in rats. Biomaterials. 2010;31(8):2034-2042.
- [Google Scholar]
- Chronic fluoride toxicity and myocardial damage: antioxidant offered protection in second generation rats. Toxicol. Int.. 2011;18(2):99.
- [Google Scholar]
- Nanomaterials and nanoparticles: sources and toxicity. Biointerphases. 2007;2(4):MR17-MR71.
- [Google Scholar]
- An increase in glutathione peroxidase activity induced by high supplementation of vitamin C in rats. Nutr. Res.. 1984;4(4):657-664.
- [Google Scholar]
- Acute toxicological effects of copper nanoparticles in vivo. Toxicol. Lett.. 2006;163(2):109-120.
- [Google Scholar]
- Cheraghi, J., Hosseini, E., Hoshmandfar, R., Sahraei, R., & Farmany, A. 2013. In vivo effect of Silver Nanoparticles on serum ALT, AST and ALP activity in male and female mice. Advances in Environmental Biology, 116-12
- Current Method. 2011. Analysis of Foods for As, Cd, Cr, Hg and Pb by Inductively Coupled Plasma-Mass Spectrometry (ICP-MS). CFSAN/ORS/DBC/CHCB April 25.
- State-level awareness of chronic kidney disease in the US. Am. J. Prev. Med.. 2017;53(3):300-307.
- [Google Scholar]
- Time-dependent biodistribution and excretion of silver nanoparticles in male Wistar rats: Biodistribution of nanosilver in rats. J. Appl. Toxicol.. 2012;32(11):920-928.
- [Google Scholar]
- Effect of dietary Vitamin C and β-glucan to alleviate the toxic effect of copper sulphate in tilapia fish. Alexand. J. Vet. Sci.. 2017;55(1):36-49.
- [Google Scholar]
- Dietary exposure to silver nanoparticles in Sprague-Dawley rats: effects on oxidative stress and inflammation. Food Chem. Toxicol.. 2013;60:297-301.
- [Google Scholar]
- Effects of silver nanoparticle on the developing liver of rat pups after maternal exposure. Iran. J. Pharm. Res. IJPR. 2017;16(2):685.
- [Google Scholar]
- Signaling gene cascade in silver nanoparticle induced apoptosis. Colloids Surf. B. 2010;77(2):240-245.
- [Google Scholar]
- Comparative levels of ALT, AST, ALP and GGT in liver associated diseases. Eur. J. Exp. Biol.. 2013;3(2):280-284.
- [Google Scholar]
- An insight into silver nanoparticles bioavailability in rats. Metallomics. 2014;6(12):2242-2249.
- [Google Scholar]
- In vitro assessments of nanomaterial toxicity. Adv. Drug Deliv. Rev.. 2009;61(6):438-456.
- [Google Scholar]
- Urea nitrogen and urinary ammonia. In Standard methods of clinical chemistry. 1965;Vol. 5:245-256.
- The role of vitamin C, vitamin E, and selenium on cadmium-induced renal toxicity of rats. Drug Chem. Toxicol.. 2008;31(4):413-426.
- [Google Scholar]
- Oxidative stress-dependent toxicity of silver nanoparticles in human hepatoma cells. Toxicol. In Vitro. 2009;23(6):1076-1084.
- [Google Scholar]
- Roles of N-acetylcysteine, methionine, vitamin C and vitamin E as antioxidants against lead toxicity in rats. Aust. J. Basic Appl. Sci.. 2011;5(5)
- [Google Scholar]
- Biochemical Study of Oxidative Stress Markers in the Liver, Kidney and Heart of High Fat Diet Induced Obesity in Rats. Diabetol. Metab. Syndr.. 2011;3(1)
- [CrossRef] [Google Scholar]
- The toxicity, ways of exposure and effects of Cu nanoparticles and Cu bulk salts on different organisms. Int. J. Biosci.. 2015;6(2):147-156.
- [Google Scholar]
- Assay for lipid peroxides in animal tissues by thiobarbituric acid reaction. Anal. Biochem.. 1979;95(2):351-358.
- [Google Scholar]
- Cytotoxicity of silver and copper nanoparticles on rainbow trout (Oncorhynchus mykiss) hepatocytes. Environ. Sci. Pollut. Res.. 2018;25(1):908-915.
- [Google Scholar]
- Effects of silver nanoparticles on the functional tests of liver and its histological changes in adult male rats. Nanomed. Res. J.. 2018;3(3):146-153.
- [Google Scholar]
- Silver nanoparticles: mechanism of antimicrobial action, synthesis, medical applications, and toxicity effects. Int. Nano Lett.. 2012;2(1):32.
- [Google Scholar]
- Shahare, B., Yashpal, M., & Gajendra. 2013. Toxic effects of repeated oral exposure of silver nanoparticles on small intestine mucosa of mice. Toxicology mechanisms and methods, 23(3), 161-167
- Copper Accumulation in Tissues of Oreochromis niloticus Exposed to Copper Oxide Nanoparticles and Copper Sulphate with Their Effect on Antioxidant Enzyme Activities in Liver. Water Air Soil Pollut.. 2018;229(8):269.
- [Google Scholar]
- Review of the effects of manufactured nanoparticles on mammalian target organs. J. Appl. Toxicol.. 2018;38(1):25-40.
- [Google Scholar]
- In vitro toxicity of nanosized copper particles in PC12 cells induced by oxidative stress. J. Nanopart. Res.. 2012;14(6):906.
- [Google Scholar]
- Long-term accumulation and low toxicity of single-walled carbon nanotubes in intravenously exposed mice. Toxicol. Lett.. 2008;181(3):182-189.
- [Google Scholar]
- Prophylactic role of B vitamins against bulk and zinc oxide nano-particles toxicity induced oxidative DNA damage and apoptosis in rat livers. Pak. J. Pharm. Sci.. 2015;28(1)
- [Google Scholar]
- Acute toxicity of amorphous silica nanoparticles in intravenously exposed ICR mice. PLoS ONE. 2013;8(4):e61346
- [Google Scholar]


