

Translate this page into:
The impact of Bi3+ ions on magnetization, dielectric parameters, and conductivity of soft Mg-Cu ferrite nanoparticles
-
Received: ,
Accepted: ,
This article was originally published by Elsevier and was migrated to Scientific Scholar after the change of Publisher.
Peer review under responsibility of King Saud University.
Abstract
This paper investigates the bismuth ions leverage on magnetic and dielectric features of magnesium–copper nanoferrites Mg0.5Cu0.5BixFe2-xO4 (MCBF). The Mg0.5Cu0.5Bi0.1Fe1.9O4 nanoferrite exhibits superior magnetic properties compared to the pure Mg-Cu sample. These properties include a higher magnetization of 31.31 emu/g, with an enhancing ratio of 1.50 %. Additionally, it demonstrates a higher initial permeability of 17.84, with an enhancing ratio of 55.12 %. Furthermore, their coercivity is lower at 59.90 Oe, with an enhancing ratio of 50 %. All MCBF nanoferrites exhibit a high-frequency response between 6.106 and 6.926 GHz, making them suitable for microwave technology. The dielectric parameters dispersion shows normal behavior at different frequencies and temperatures. As for dielectric parameters dependence on Bi content, it exhibited a peculiar manner. At a temperature of 297 K and a frequency of 50 Hz, the nanoferrite Mg0.5Cu0.5Bi0.1Fe1.9O4 exhibits superior dielectric properties compared to the pure Mg-Cu sample. Specifically, it demonstrates the highest dielectric constant of 360.68, with an enhancing ratio of 125.97 %. Additionally, it displays the highest conductivity of 691.4 µ(Ω.m)-1, with an enhancing ratio of 1543.23 %. Furthermore, the nanoferrite exhibits a lower dielectric loss of 6.49, with an enhancing ratio of 80.22 % compared to the pure Mg-Cu sample. The conduction mechanism of the Mg0.5Cu0.5BixFe2-xO4 nanoferrites was determined by fitting the σac results via the Jonscher power law. This conduction mechanism is attributed to correlated barrier hopping (CBH) model up to 473 K, followed by small polaron tunneling (SPT), which reaches higher temperatures. Hence, the Mg0.5Cu0.5Bi0.1Fe1.9O4 nanoferrite has a remarkable magnetic and dielectric nature, which can be used as functional soft ferrite material in transformers and high-frequency electronic devices.
Keywords
Nanoferrites
Bismuth
Magnetic properties
Dielectric properties
Conduction mechanism

1 Introduction
The fast telecommunications and information technology development has generated a need for smaller, more cost-effective, and more efficient electronic gadgets, which provide a wide range of functions to make our lives easier. For this purpose, soft ferrites, which are applicable in several fields like memory devices, microwave absorbing materials, magnet recording media, computer components, transformer cores, etc., have been studied. (Akhtar et al., 2023). Magnesium-copper (Mg-Cu) soft ferrite stands out among other ferrites as being particularly intriguing because of the variety of Mg- and Cu-ferrite varieties inside it (Balamurugan et al., 2022). Mg-ferrites acquire high electrical resistivity ∼ 107Ω.cm, low Eddy current, low cost and coercivity (Mansour & Abdo, 2017; Mansour et al., 2017a), and Cu-ferrites acquire high permeability and electrical resistivity with moderate magnetization (Mansour et al., 2018a). Hence, in this paper, Mg-Cu ferrite with a formula Mg0.5Cu0.5Fe2O4 was selected to be our pristine sample to combine the required merits of magnetization, permeability, resistivity, and coercivity for proper applications of soft ferrites.
In recent years, several research groups have worked to modify the magneto-electrical characteristics of microferrites by replacing divalent, trivalent, and binary mixtures in response to the needs of specific applications. Liu et al. investigated the microstructure effects on the Zn-Mg-Cu ferrite's magnetic parameters and investigated their application for near-field communication (Liu et al., 2016). Yue et al., declared that Zn-Mg-Cu ferrites have good magneto-electrical features, making them appropriate materials for multilayer chip inductors with superior behavior and inexpensive (Yue et al., 2001). Mulushoa and Murali reported that Mg0.5Cu0.5Fe1.5Cr0.5O4 nanoferrite could be beneficial for their possible usage in high-density recording media technology (Mulushoa & Murali, 2022). Kumar and Kumar declared that Ni-Cr substituted MgFe2O4 ferrite material is promising for recording materials (Kumar & Kumar, 2016). Junaid et al. reported that Bi3+ substitution into different ferrite systems could increase the magnetization and decrease dielectric loss (Junaid et al., 2020). Choudhari and Rewatkar declared that Bi3+ ions-doped lead hexaferrite are appropriate for wide applications like permanent magnets and high-density magnetic recording media (Choudhari & Rewatkar, 2022). Pan et al. investigated the structural and magnetic properties of Bi3+ ion doped Ni–Cu–Co nano ferrites and declared their low magnetic properties (Pan et al., 2019). Alqarni et al. (Alqarni et al., 2022) stated that the diamagnetic Bi3+ can nestle in the two sites of spinel lattice (tetrahedral and octahedral) and improve resistivity and magnetic parameters. The prime intent of the current paper is to increase magnetization (MS), permeability, and resistivity decrease coercivity (HC) and decrease electric loss of the pristine Mg0.5Cu0.5Fe2O4 ferrites to obtain a remarkable soft ferrite material. For this purpose, we aimed to improve in the Mg0.5Cu0.5Fe2O4 ferrite system by substituting the Fe3+ with Bi3+ ions, based on the declared influence of Bi3+ ions on different ferrite systems. Hence, the magnetic and dielectric features of the Mg0.5Cu0.5BixFe2-xO4 nanoferrites were investigated. In the previous paper (Almaghamsi and Basfer, 2022), the nanoferrite Mg0.5Cu0.5Bi0.1Fe1.9O4 was found to have the highest photocatalytic efficiency (95.81 %) for the elimination of rhodamine B from effluent via the study of the optical and photocatalytic characteristics of the Mg0.5Cu0.5BixFe2-xO4 system. Now, we have completed our investigation of these Mg0.5Cu0.5BixFe2-xO4 nanoferrites by determining their magnetic, dielectric, and electric modulus spectroscopy features for proper soft ferrite applications.
2 Experimental
The sol–gel auto-combustion method was utilized to prepare the Mg0.5Cu0.5BixFe2-xO4 ferrites samples (x = 0.0, 0.02, 0.04, 0.06, 0.08 and 0.1); which labeled MCBF0 (Mg0.5Cu0.5Fe2O4), MCBF1 (Mg0.5Cu0.5Bi0.02Fe1.98O4), MCBF2 (Mg0.5Cu0.5Bi0.04Fe1.96O4), MCBF3 (Mg0.5Cu0.5Bi0.06Fe1.94O4), MCBF4 (Mg0.5Cu0.5Bi0.08Fe1.92O4) and MCBF5 (Mg0.5Cu0.5Bi0.1Fe1.9O4), respectively (Almaghamsi and Basfer, 2022). The chemicals exploited for the MCBF synthesis are metal nitrates of magnesium, copper, bismuth, and iron besides citric acid and ammonium solution. These nitrates and citric acid were dispersed in distilled water with a 1:1 M ratio; then, the solution pH values were altered to 7 by ammonium solution. At a temperature of 320 °C, the solvent completely evaporated during combustion, leaving behind dry ash powder. Previous work revealed the results of x-ray diffraction (XRD) and field emission scanning electron microscope (FESEM) analyses of these MCBF samples with their optical and photocatalytic properties (Almaghamsi and Basfer, 2022). The prepared MCBF nanoferrites' crystallite size was in the range 29.75 to 44.87 nm. Fourier transform infrared (FTIR) spectra for all MCBF nanoferrites were performed in the frequency span of 200–4000 cm−1 on a desktop FTIR model of “Bruker Tensor 27″ spectrometer”. The magnetic parameters of the MCBF ferrite nanoparticles were measured via a vibrating sample magnetometer (VSM) Lake Shore 7410 USA device. The dielectric parameters and modulus of the MCBF ferrite samples were discussed with the help of a Hioki impedance analyzer model IM3570 with a measurement frequency of 4 Hz to 5 MHz at temperatures ranging from room temperature (RT = 297 K) to high temperature (T = 773 K).
3 Results and discussion
3.1 FTIR analysis
Fig. 1 displays transmittance data for MCBF nanoferrites within the frequency range 200–2000 cm−1, obtained by FTIR spectroscopy for studying the interaction of IR with the MCBF nanoparticles. The FTIR spectra manifest the existence of the O–H group and residual water in the MCBF samples, which are the main reasons for the bands around (υ3) 1630, (υ4) 2854, (υ5) 2922, and (υ6) 3425 cm−1 (Harqani and Basfer, 2022). All the spectra acquire the vibrational bands of metal–oxygen (M−O) bonds at tetrahedral (A) and octahedral (B) positions of MCBF spinels (Ahmed et al., 2011). Band υ1 is between 566.19 and 571.88 cm−1, corresponding to the A site stretching mode (Abdo et al., 2021). The second one, υ2, has values between 398.01 and 405.59 cm−1, related to the B site stretching mode (Abdo and Sadeq, 2022). Variations in the lengths of the Fe3+–O2- bonds due to differences in A and B coordination are the source of the discrepancy between υ1 and υ2 values (Abdo and Sadeq, 2021). Redistributions of cations between A and B sites are inferred from the non-constant values of υ1 and υ2 with increasing Bi3+ concentration (Al-Bassami et al., 2020). It is observed that the band ν1 moves to a lower wavenumber value for Bi3+; meanwhile, υ2 shifts to a higher wavenumber value. Spinel distortion occurs because of ion radius changes, involving Bi3+ ions and the rearrangement of Fe3+, Cu2+, and Mg2+. The Bi3+ radius is large (1.03 Å), so it is inclined to nestle the B-sites. At the same time the Mg2+ radius (0.72 Å) is greater than that of the Fe3+ ion (0.645 Å) and Cu2+ (0.57 Å). Therefore, Bi3+ ions filling B-sites will initiate some Mg2+ ions to move to A-sites, and specified Fe3+ and Cu2+ ions will migrate from A-sites to B-sites to improve the strain. Hence, a growing number of Mg2+ ions in A-sites increases the ionic radii of the A-sites and leads to the move to higher wavenumber value, with an increasing number of Cu2+ ions in B-sites decreasing the ionic radii of the B-sites and lead to the shift to lower wavenumber. Fig. 1 illustrates the values of all these bands for all MCBF nanoferrites. The lack other bands proves that all MCBF nanoferrites have a single spinel structure.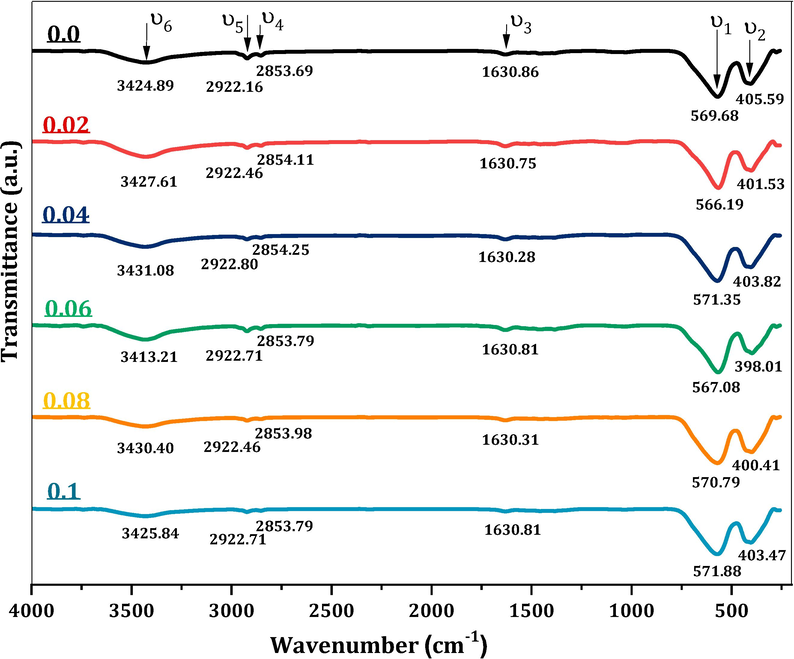
FTIR diffractograms of Mg0.5Cu0.5BixFe2-xO4; x = 0.0, x = 0.02, x = 0.04, x = 0.06, x = 0.08 and x = 0.1 nanoferrites.
3.2 Magnetic study
To determine the dominant magnetic phase and parameters, a VSM was employed to record the direct current (DC) magnetic field-dependent hysteresis loops of MCBF nanoferrites at RT. Fig. 2 shows the M(H) loops with zoomed-in depiction recorded via a field of ± 20 kOe. All the MCBF nanoferrites have ferrimagnetic characteristics with notable diverse magnitudes of saturation magnetization (MS), coercivity (HC), and remnant (Mr); see Table 1. MS has a peculiar trend; it decreased gradually from 30.84 at MCBF0 to 27.60 emu/g for MCBF3 and increased, reached 30.15 and 31.31 emu/g for MCBF4 and MCBF5, respectively. This behavior can be justified as follows. Firstly, this decreasing behavior is a logical result of the substitution process of the Bi3+ ion with a magnetic moment of 3µB at the expense of the higher magnetic ion Fe3+ of 5µB (Kumar and Kumar, 2016). Indeed, the largest Bi3+ions (1.03 Å) (Shannon, 1976) can nestle in the largest B positions. Néel's two-sublattice ferrimagnetism model states that ions on the A and B sublattices have collinear spins and anti-parallel magnetic moments. Then, the lattice's net magnetic moment is the difference between the magnetic moments of the B and A sub-lattices µB = |µB(B) - µB(A)| (Ahmed et al., 2013). So, by doping Bi3+ ions instead of Fe3+ ones in the B sites, the net magnetic moment decreases, and then MS also decreases. Secondly, for significant content of Bi3+, i.e., MCBF4 and MCBF5 nanoferrites, MS introduces an increment behavior which can be assigned for cations redistribution of nonmagnetic Mg (0µB) (Mansour et al., 2017a), and magnetic Cu (1µB) (Mansour et al., 2018a) between A and B sites, as seen above in FTIR results. Increasing Bi3+ ions in B sites at the expense of Fe3+ ions forces some of the large Mg (0.72 Å, 0µB) to migrate into the site, which in turn forces some small Cu (0.57 Å, 1µB) to migrate into B sites. This process decreases the A sites' magnetic moment and increases the B sites' magnetic moment, increasing the overall MS. Hence, Bi3+ ions substitution can tune the magnetization of pristine Mg-Cu ferrite nanoparticles. Nanoparticles have a distinguished surface-to-volume ratio; hence, the number of dangling bonds or spin tilting effects at the nanoparticles' surface rises, decreasing the allied magnetic moments number across the particles. Fig. 3 manifests the nearly direct relation between magnetization and the size of MCBF ferrite nanoparticles (Abdo and El-Daly, 2022). Also, the magnetization of the sample MCBF5 is enhanced with an improved ratio of 1.51 % compared to the pristine sample. Thus, the first aim of this paper, enhancing the magnetization with Bi3+ doping, is achieved. Also, the remnant magnetization is enhanced by decreasing its value compared with the pristine sample. The characteristic sample MCBF5 has a Mr value of 5.61 emu/g, whereas the pristine sample has Mr value of 6.36 emu/g. Hence, the remnant magnetization is decreased with a decreasing ratio of 11.83 % to the pristine sample. This was the second aim of this paper, which was also achieved.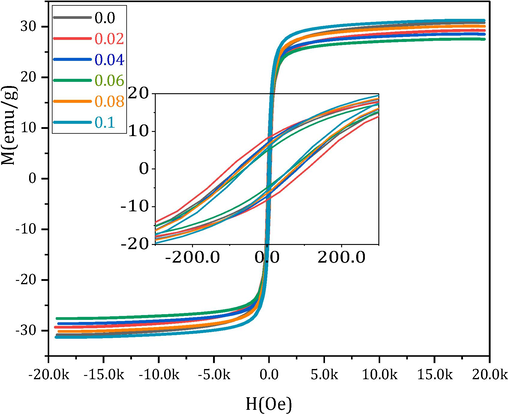
VSM of all the MCBF nanoferrites with zoomed-in picture.
x
MS (emu.g−1)
Mr (emu.g−1)
SQR
HC (Oe)
Ρ (g/cm3)
ηM(μB)
K (erg/cm3)
μi
ωM (GHz)
0
30.84
6.36
0.21
78.99
5.07
0.239
2537.65
11.50
6.82
0.02
29.31
8.19
0.28
105.61
5.16
0.226
3224.74
11.26
6.49
0.04
28.61
7.04
0.25
80.90
5.23
0.221
2410.56
14.85
6.33
0.06
27.60
4.88
0.18
62.18
5.23
0.216
1787.68
13.28
6.11
0.08
30.15
6.33
0.21
72.22
5.22
0.239
2268.39
13.69
6.671
0.1
31.31
5.61
0.18
59.90
5.40
0.244
1953.52
17.84
6.93
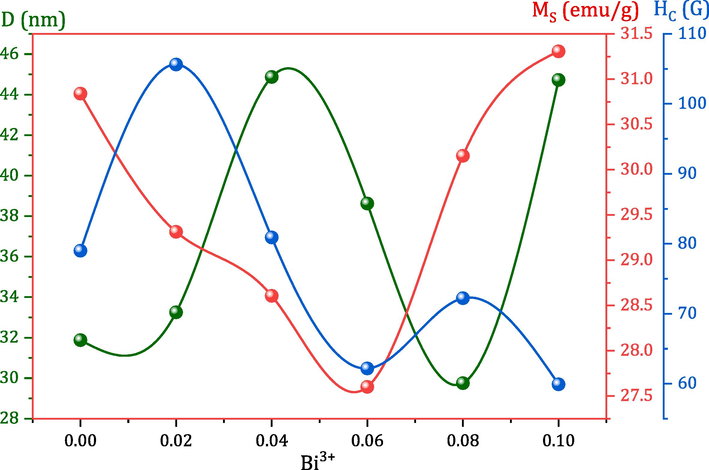
Dependence of crystallite size (Dnm), magnetization (MS), and coercivity (HC) on Bi3+ content for all MCBF nanoferrites.
The squareness ratio (SQR) is a dimensionless quantity equals Mr/MS (Mansour et al., 2021a), which notifies principally about the magnetic domain nature of the investigated magnetic samples behaving as ferri- or ferromagnetic material (Alqarni et al., 2022). According to Stoner-Wohlfarth’s theory, a value of 0.5 is necessary for nanoparticles' SQR to acquire a single-domain nature with uniaxial symmetry. The calculated SQR values of the investigated MCBF nanoferrites are within the range of 0.18 and 0.28. Hence, it is concluded that our prepared MCBF samples are ferrimagnetic nanoparticles with multi-domain nature. Another important magnetic parameter is the magnetic moment per chemical formula (ηB), which depends mainly on the MS, density (ρ), and molecular weight (MW) of each formula through the formula (Abdo et al., 2023):
As expected, ηB has the same behavior of MS and its values within the range 0.24 μB and 0.22 μB for all the MCBF nanoferrites; see Table 1. Observing the MS, Mr, and SQR results, it is simple to deduce that the presence of Bi3+ ions positively adjust the magnetization data and achieve the required mission.
On the other hand, the HC of the MCBF nanoferrites manifests a remarkable behavior within the range 105.61 and 59.90 Oe; see Table 1. As mentioned above, we aimed to decrease the HC values through the Bi/Fe substitution process. HC of the nanoferrite MCBF5 has the lowest value, 59.90 Oe, with an improving ratio of 50 %, compared to the pristine MCBF0 sample with 78.99 Oe. In fact, there are many reasons that govern HC behavior, like substitution element, size of the nanoparticle, etc. The reason for decreasing coercivity to its lowest value has two justifications. The first one is that sample has the lowest MS value; hence the required field to conquer this magnetization is also tiny, producing low HC value. The second one is the particle size effect, where the relation between HC and the nanomaterial size is an inverse one; see Fig. 3. Many authors reported an analogous inverse relation between HC and particle size (Mansour et al., 2021b; Mansour et al., 2021c; Ali et al., 2021). Additionally, there are other magnetic parameters based on MS, HC, and crystallite size (D), anisotropy constant (k), and initial permeability (μi) can be determined through the following relations (Abdo and El-Daly, 2021; Abdo et al., 2022), and listed in Table 1.
Fig. 4 displays the dependance of
on Bi3+ content.
performance is ruled by both MS and HC values but takes the general behavior of HC. Basically, magnetic anisotropy refers to the phenomenon whereby the magnetic properties of a ferrite material exhibit a dependency on the direction. Therefore, the nature of magnetic anisotropy plays a significant role in deciding whether a certain magnetic material is appropriate for a particular application. The significance of magnetic anisotropy is particularly apparent in both soft and hard magnetic materials. Due to the direct relationship between magnetic anisotropy and coercivity, soft magnetic materials typically exhibit minimal magnetic anisotropy. As seen
augmented for the nanoferrite MCBF1 (3224.74 erg/cm3) and then generally decreased for further Bi doping. Hence Bi substitution decreases the crystalline anisotropy and generates samples that are easy to demagnetize. As for
, it has a general increasing behavior, which increased from 11.50 for the nanoferrite MCBF0 to 17.84 for the nanoferrite CMCF5 with enhancing the ratio of 55.12 %. This increment confirms that the magnetic flux strengthens within the MCBF nanoferrite via the weaker magnetic ion Bi doping.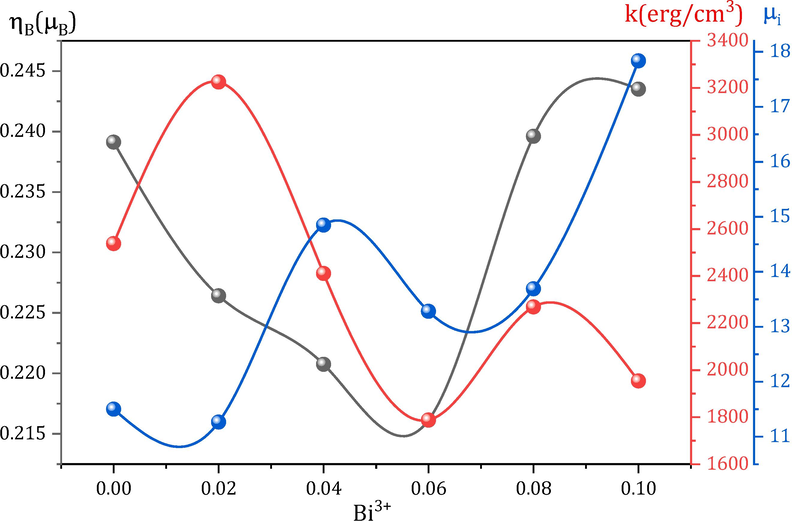
Dependence of magnetic moment per formula unit (ηM), anisotropy constant (k), and initial permeability (μi) on Bi3+ content for all MCBF nanoferrites.
3.3 Dielectric studies
3.3.1 Frequency dependence of dielectric parameters
The dielectric constant (ε′) quantifies a material's ability to retain energy in response to an alternating field. Using the following Eq. (Mansour et al., 2018a), the ε′ values of all the MCBF nanoferrites were determined.
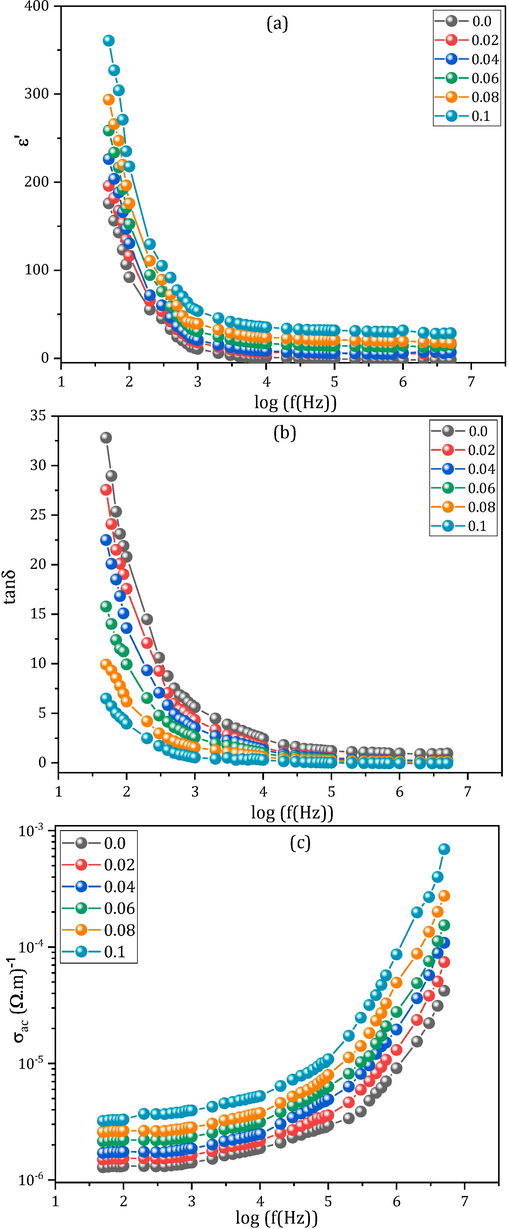
(a-c): Frequency dependence of (a) dielectric constant ε′, (b) dielectric loss tangent tanδ, and (c) conductivity σac of all the MCBF nanoferrites at RT.
The dielectric loss tangent (tanδ) is the consequence of the delayed action to the frequency, originating from diverse reasons. When a nanoferrite material is subjected to a field, the dipoles inside the material move closer and closer to the electrode. The dipoles' movement is then resisted by friction inside the ferrite material, leading to heat production and dielectric loss (shown by tanδ). The tanδ readings of all MCBF samples are directly taken from the RLC apparatus. Fig. 5(b) shows the frequency dispersion of tanδ of all the MCBF nanoferrites at RT, which displays the characteristic dispersion of all ferrite materials. Obviously, tanδ has a rapid decay in the low frequency domain (≤10 kHz) followed by a slower decay within the span 10 kHz ≤ f ≤ 5 MHz. The operation of charge carrier hopping is slowed down by GBS, leading to more absorption and more significant loss, especially at lower frequencies (Mansour et al., 2019a). Specifically, at low frequencies, the Fe2+↔ Fe3+ exchange processes need more energy, which correlates with high resistive GBS and leads to large tan values. On the other hand, the GS function is more effective at high frequencies because charge carriers hop among ions in the octahedral sites. Consequently, tanδ decreases with frequency because absorption is less at higher frequencies, where electrons need less energy at higher frequencies (Mansour et al., 2018b).
Fig. 5(c) shows the frequency-dependence of alternating current (AC) conductivity (σac) for the investigated MCBF samples at RT, where the σac values were assessed using the formula.
These results show that up to 10 kHz, σac has small values but that beyond 10 kHz, significant increments occur. Multiple reports (Mansour et al., 2019b; Mansour et al., 2023) have established that ferrite's polarization process is like its conduction approach. Usually, the conduction route in ferrites arises mainly due to the exchange process of Fe3+ ⟷ Fe2. As was previously noted, GBS becomes further effective at lower frequencies, impeding these electron exchange processes and leading to lower values for the σac. Whereas, at higher frequencies, the enhanced carrier exchange activities inside the GS are responsible for the larger σac values.
3.3.2 Bi content dependence of dielectric parameters
Fig. 6 shows the ε′ values of all MCBF nanoferrites at RT and 50 Hz. It was noticed that the ε′ value increased as the Bi3+ content increased. The nanoferrite MCBF5 has the optimum ε′ value of 365.68 with an improving ratio of 125.97 % to the pristine MCBF0 nanoferrite, which has just an ε′ value of 159.61. This remarkable behavior is justified as follows. Bi3+ replaced Fe3+ ions and occupied the B-sites, as mentioned above, forcing the B sites' iron ions to emigrate to the A sites. As a result, more Fe2+ and Fe3+ ions are in the A sites, and more electrons are hopping between Fe2+↔Fe3+ ions in the A sites. Therefore, the possibility of electron accumulation on the GBS increased in polarization and ε′ value.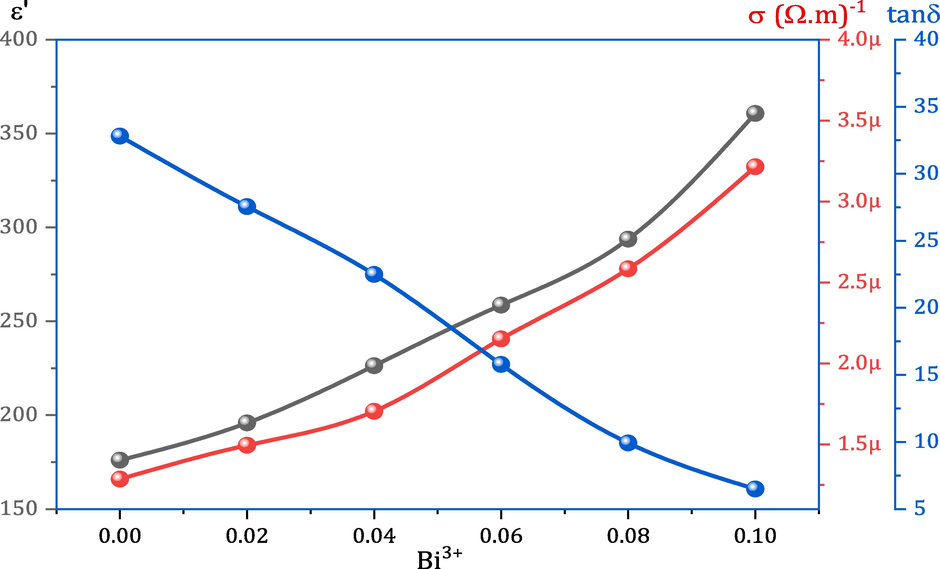
Dependence of dielectric constant ε′, conductivity σac, and dielectric loss tangent tanδ on Bi3+ content for all MCBF nanoferrites at RT.
As for σac dependence on Bi3+ content, it has an increment behavior with further Bi doping, as seen in Fig. 6. The nanoferrite MCMF5 has an σac value of 691.8 μ(Ω.m)-1, which is an outstanding outcome compared to the pure MCBF0 sample, which acquires an σac value of 42.1 μ(Ω.m)-1. It is noteworthy that the conductivity was enhanced with an enhancing ratio of 1543.23 % via Bi doping. As stated before, the causes of dielectric constant are comparable to those of conductivity in ferrite materials. So, the proposed mechanism for interpreting the ε′ results is also valid for explaining the σac results. Moreover, Jacob et al. declared that the conductivity of Mg-Cd-Bi nanoferrites was enhanced via hoping between Bi2+ and Bi3+ at octahedral sites (Jacob et al., 2023). Hence, these two reasons are the motives for enhancing conductivity of the MCBF with further increasing Bi content.
Fig. 6 also shows the tanδ values for MCBF nanoferrites at RT and 50 Hz. Amazingly, it was noticed that the loss diminished gradually with the rise of the bismuth element, which is a wonderful result. Liu et al. summed up the dielectric losses caused in dielectric materials, which can be classified into intrinsic and extrinsic roles (Liu et al., 2023). Intrinsic losses are caused by the anharmonic interaction of the applied electric field with the phonon system. Extrinsic losses, on the other hand, relate to crystal structure properties such as density, grain boundaries, porosity, etc. Then, it was declared that the relation between the system density and dielectric losses is an inverse relationship. For our MCBF samples, the substitution process is a large molecular weight element (Bi = 208.9804 g/mol) instead of a small one (Fe = 55.845 g/mol). Therefore, it is normal for the density to increase with further increasing Bi3+ content, leading to a decrease in dielectric loss. Table 1 shows all the calculated values of the MCBF densities. The nanoferrite MCBF5 has a loss of 6.49 with an enhancing ratio of 80.22 % compared with the nanoferrite MCBF0 loss of 32.81. Therefore, the dielectric parameters of the investigated CMBF nanoferrites can be remarkably tuned by Bi3+ ion doping.
3.3.3 Temperature dependence of dielectric parameters
Now, we will discuss the impact of temperature on the dielectric behavior of our MCBF nanoferrites. Fig. 7(a) manifests the ε′ temperature-dependence of the nanoferrite MCBF4 (as a model for the reminder samples) at the frequency domain 50 Hz-5 MHz. The reminder MCBF nanoferrites have a similar general performance, which displays the typical response of all ferrite materials. The ε′ values exhibit a growing disposition as the applied temperature rises. This trend may be explained by thermal energy, which causes the electrons to move more quickly and induces local dipoles to line up in the field direction, resulting in larger polarizations and ε′ values (Mansour et al., 2018c).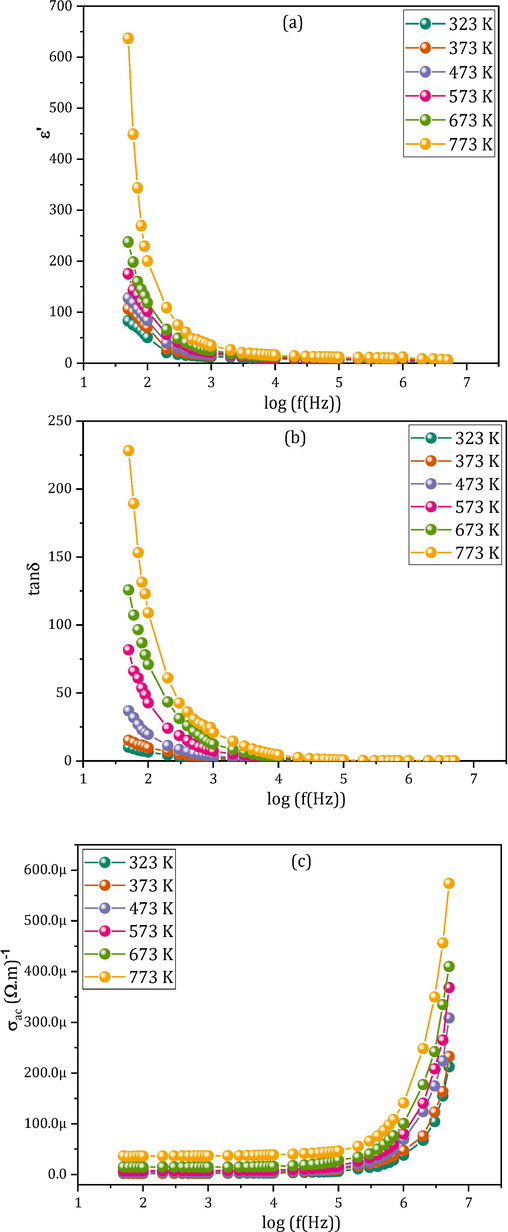
(a-c): Frequency dependence of (a) dielectric constant ε′, (b) dielectric loss tangent tanδ, and (c) conductivity σac of all the MCBF nanoferrites different temperature.
Fig. 7(b) shows the σac temperature-dispersion of the nanoferrite MCBF4 (as a model for the reminder samples) at the frequency range 50 Hz-5 MHz. The reminder MCBF nanoferrites have the same general behavior, which displays the typical response of all ferrite materials. When the applied temperature rises, σac rises, which may be ascribed to the thermal energy that increases charge carrier mobility (Mansour et al., 2023). The charge carriers’ exchanges are mainly through electron hopping between Fe3+↔Fe2+ and Bi3+↔Bi2+, besides the hole exchange between Cu2+↔Cu1+.
Fig. 7(c) shows the tanδ temperature-dependence of the nanoferrite MCBF4 (as a model for the reminder samples) at the frequency range 50 Hz-5 MHz. The reminder MCBF nanoferrites have the same general behavior, which can be understood as follows. Indeed, tanδ temperature-dependent behavior is primarily due to the existence of temperature-dependent charge carriers scattered throughout the ferrite material (Mansour et al., 2017b). Hence, the scattering of charge carriers through the mainly hopping of Fe2+↔Fe3+ and Bi3+↔Bi2+ besides exchange through the other divalent cation.
3.3.4 Conduction mechanism
As all other ferrite materials, σac for all the MCBF samples at diverse temperatures and frequencies follows Jonscher law:
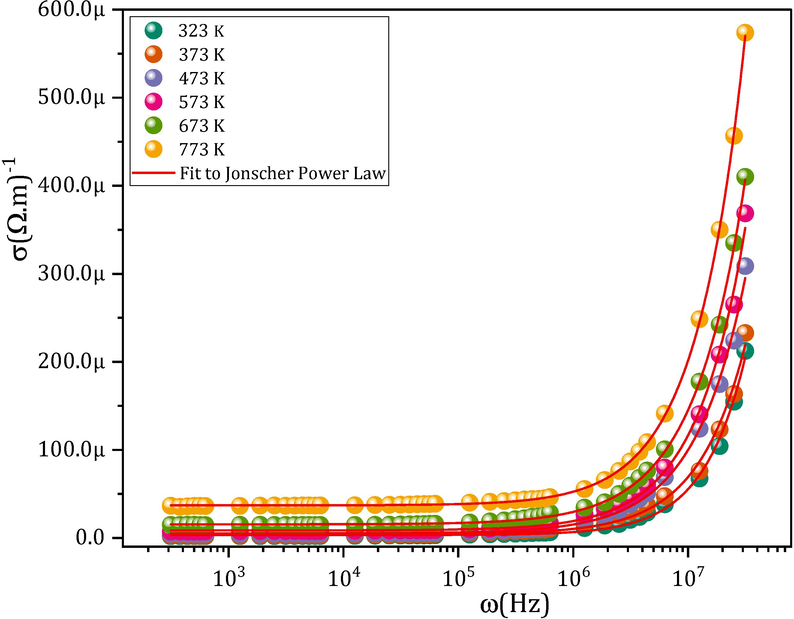
A representative graph of σac for the nanoferrite CMCF4, along with Jonscher power law fitting.
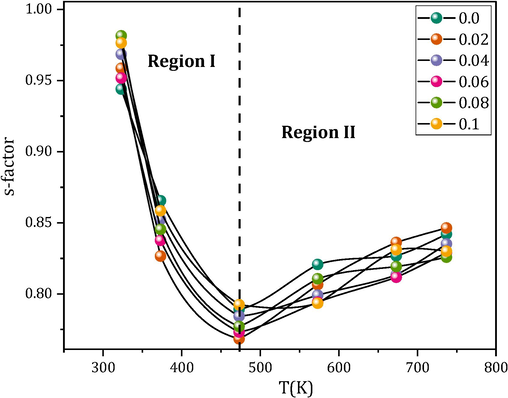
S factor for all the MCBF nanoferrite.
4 Conclusion
The present study investigates the impact of bismuth on the magnetic and dielectric characteristics of Mg0.5Cu0.5BixFe2-xO4 (MCBF) nanoferrites, where x ranges from 0.0 to 0.1. The saturation magnetization exhibits an interesting pattern, wherein it demonstrates a steady reduction from 30.84 emu/g for MCBF0 to 27.60 emu/g for MCBF3. Subsequently, it undergoes an increase, reaching values of 30.15 emu/g and 31.31 emu/g for MCBF4 and MCBF5, respectively. This action was examined via the lens of two justifications. The HC values of the nanoferrites in the MCBF exhibit a noteworthy behavior within the range of 105.61 and 59.90 Oe, leading to the classification of all samples as soft ferrite materials. Among the several nanoferrites that have been examined, it has been determined that the nanoferrite MCBF5 exhibits the most favorable characteristics. This is evidenced by its greatest values for MS (31.307 emu/g), μi (17.84), and ε′ (360.68), as well as its lower values for HC (59.90 Oe), σac (691.4 µ(Ω.m)-1), and tanδ (6.49), when compared to the pure Mg-Cu nanoferrite. The conduction mechanism of the MCBF nanoferrites is governed by two distinct types in different temperature areas. In temperature region I, the conduction mechanism is characterized by the CBH type, while in temperature region II, it is governed by the SPT type.
Declaration of competing interest
The authors declare that they have no known competing financial interests or personal relationships that could have appeared to influence the work reported in this paper.
References
- Sm-substituted copper-cobalt ferrite nanoparticles: Preparation and assessment of structural, magnetic and photocatalytic properties for wastewater treatment applications. J. Alloy. Compd.. 2021;883:160796
- [Google Scholar]
- Covalency and Racah parameters of Fe3+ in Mn–Zn–Cr nanoferrites. Ceram. Int.. 2021;47(20):28237-28239.
- [Google Scholar]
- Impact of Cr3+ substitution on the nephelauxetic ratio and Racah parameter of Cr-Mn-Zn nanoferrites. Phys. Scr.. 2022;97(1):015804
- [Google Scholar]
- The structure, correlated vibrations, optical parameters and metallization criterion of Mn–Zn–Cr nanoferrites. J. Mater. Sci. Mater. Electron.. 2021;32(12):15814-15825.
- [Google Scholar]
- Yttrium substituted Co–Cu–Zn nanoferrite: A synergetic impact of Y3+ on enhanced physical properties and photocatalysis. Ceram Int.. 2022;48(11):15314-15326.
- [Google Scholar]
- Highly efficient visible light driven photocatalytic activity of rare earth cerium doped zinc-manganese ferrite: Rhodamine B degradation and stability assessment. Ceram. Int.. 2023;49(17):29245-29258.
- [Google Scholar]
- Characterization and dramatic variations of the magnetic properties of Cu-doped nanometric Co ferrite. Phys. Scr.. 2011;84(5):055602
- [Google Scholar]
- Improvement of the physical properties of novel (1− y) Co0.8Cu0.2Fe2O4+(y) SrTiO3 nanocomposite. Mater. Res. Bull.. 2013;48(5):1796-1805.
- [Google Scholar]
- Tuning structural, electrical, dielectric and magnetic properties of Mg–Cu–Co ferrites via dysprosium (Dy3+) doping. J. Rare Earths 2023
- [Google Scholar]
- The magneto-mechanical properties of cobalt substituted Mg-Zn nanoferrites. J. Supercond. Nov. Magn.. 2020;33(10):3077-3086.
- [Google Scholar]
- Physical properties of Al-doped cobalt nanoferrite prepared by citrate–nitrate auto combustion method. J. Mater. Sci. Mater. Electron.. 2021;32(3):3092-3103.
- [Google Scholar]
- Structural, morphological and photocatalytic properties of Bi–Mg–Cu ferrites: Influence of the Bi: Fe ratio. Ceramics International; 2022.
- Structural and magnetic properties of hydrothermally synthesized Bi-substituted Ni–Co nanosized spinel ferrites. Ceram. Int.. 2022;48(4):5450-5458.
- [Google Scholar]
- Effect of copper on the electromagnetic properties of Mg–Zn–Cu ferrites prepared by sol–gel auto-combustion method. Mater. Sci. Eng. B. 2001;86(1):64-69.
- [Google Scholar]
- J. Appel, “Polarons,” in Solid State Physics, vol. 21, edited by F. Seitz, D. Turnbull, and H. Ehrenreich (Academic Press, New York, 1968), (1968), pp. 193–391.
- Natural fuel assisted synthesis of Mg–Cu ferrite nanoparticles: Evaluation of structural, dielectric, magnetic and humidity sensing properties. Ceram. Int.. 2022;48(4):4874-4885.
- [Google Scholar]
- Influence of Bi3+ ions substitution on structural, magnetic, and electrical properties of lead hexaferrite. J. Magn. Magn. Mater.. 2022;551:169162
- [Google Scholar]
- The Role of Rare Earth (Y) Ions on the Structural, Magnetic and Mechanical Properties of Co–Mg Nanoferrites. J. Supercond. Nov. Magn.. 2022;35(11):3417-3429.
- [Google Scholar]
- The influence of lanthanum concentration on microstructural and electrical properties of Mg-Cd-Bi ferrite nanoparticles. Ceram Int.. 2023;49(2):1896-1901.
- [Google Scholar]
- Structural, spectral, magnetic and dielectric properties of Bi substituted Li-Co spinel ferrites. J. Mol. Struct.. 2020;1221:128859
- [Google Scholar]
- Effect of Bi3+ ion substitution on magnetic properties of cobalt nano ferrites prepared by sol-gel combustion method. Soft Nanosci. Lett.. 2016;6(3):37-44.
- [Google Scholar]
- The effects of microstructure on the magnetic properties of MgCuZn ferrites applied in near field communication. J. Alloy. Compd.. 2016;680:328-332.
- [Google Scholar]
- Enhanced dielectric tunability and reduced dielectric loss tangent in the Mn-doped BaTi0.8Zr0.2O3 ceramics. J. Alloy. Compd.. 2023;935:167960
- [Google Scholar]
- Electrical modulus and dielectric behavior of Cr3+ substituted Mg–Zn nanoferrites. J. Magn. Magn. Mater.. 2017;428:300-305.
- [Google Scholar]
- Y3+ substituting-adjusted mechanical, dielectric, and impedance properties of cobalt copper zinc nanoferrites for high frequency applications. J. Rare Earths. 2023;41(10):1597-1605.
- [Google Scholar]
- Mansour, S.F.a, Abdo, M. A., & El-Dek, S. I. (2017). Improvement of physico-mechanical properties of Mg–Zn nanoferrites via Cr3+ doping. Journal of Magnetism and Magnetic Materials, 422, 105-111.
- Mansour, S. F.b, Ahmed, M. A., El-Dek, S. I., Abdo, M. A., & Kora, H. H. (2017). Enhancement of the physical properties of novel (1−x) NiFe2O4+(x) Al2O3 nanocomposite. Applied Physics A, 123(7), 1-11.
- Mansour, S. F.a, Abdo, M. A., & Kzar, F. L. (2018). Effect of Cr dopant on the structural, magnetic and dielectric properties of Cu-Zn nanoferrites. Journal of Magnetism and Magnetic Materials, 465, 176-185.
- Mansour, S. F.b, Hemeda, O. M., Abdo, M. A., & Nada, W. A. (2018). Improvement on the magnetic and dielectric behavior of hard/soft ferrite nanocomposites. Journal of Molecular Structure, 1152, 207-214.
- Mansour, S. F. c, Abdo, M. A., & Alwan, S. M. (2018). The role of Cr3+ ions substitution on structural, magnetic and dielectric modulus of manganese zinc nanoferrites. Ceramics International, 44(7), 8035-8042.
- Mansour, S. F.a, Al-Hazmi, F., & Abdo, M. A. (2019). Relaxation time enhancement of cobalt zinc nanoferrites via Cr3+ doping. Journal of Alloys and Compounds, 792, 626-637.
- Mansour, S. F.b, Dawood, A., & Abdo, M. A. (2019). Enhanced magnetic and dielectric properties of doped Co–Zn ferrite nanoparticles by virtue of Cr3+ role. Journal of Materials Science: Materials in Electronics, 30(18), 17262-17275.
- Mansour, S.F.a, Karamany, M. M., Al-Wafi, R., El-Dek, S. I., Almossalami, H. A., & Abdo, M. A. (2021). The effective role of diamagnetic Pb ions in tailoring the magnetic and dielectric properties of BiFeO3 nanomultiferroic. Journal of Materials Science: Materials in Electronics, 32(3), 3621-3637.
- Mansour, S.F.b, Al-Hazmi, F., AlHammad, M. S., Sadeq, M. S., & Abdo, M. A. (2021). Enhancing the magnetization, dielectric loss and photocatalytic activity of Co–Cu ferrite nanoparticles via the substitution of rare earth ions. Journal of Materials Research and Technology, 15, 2543-2556.
- Mansour, S.F.c, Zaher, H., Al-Wafi, R., Almossalami, H. A., & Abdo, M. A. (2021). Tuning of structural, magnetic and dielectric properties of M0.45La0.10Fe2.45O4;(M= Mn, Co, Cu, Mg and Zn) nanoparticles: effect of particle size and porosity. Journal of Materials Science: Materials in Electronics, 32(2), 1741-1758.
- Comparison of Structural, dielectric and magnetic investigation of Cr3+ substituted Mg-Cu, Mg-Zn, and Mg-Ni ferrites system. Inorg. Chem. Commun.. 2022;145:110033
- [Google Scholar]
- Structural and magnetic properties of Bi3+ ion doped Ni–Cu–Co nano ferrites prepared by sol–gel auto combustion method. J. Mater. Sci. Mater. Electron.. 2019;30:4644-4657.
- [Google Scholar]
- Revised effective ionic radii and systematic studies of interatomic distances in halides and chalcogenides. Acta Crystallogr. Sect. A: Cryst. Phys., Diffr., Theor. Gen. Crystallogr.. 1976;32(5):751-767.
- [Google Scholar]


