

Translate this page into:
The effect of the parameter of Morse potential on cohesive energy
⁎Corresponding author. omar@ksu.edu.sa (Omar M. Aldossary)
-
Received: ,
Accepted: ,
This article was originally published by Elsevier and was migrated to Scientific Scholar after the change of Publisher.
Peer review under responsibility of King Saud University.
Abstract
The impact of nanoparticles size on the cohesive energy was investigated by Morse potential for different metallic cubic structures. The cohesive energy of nanoparticles decreases with reducing its size, which is agree with corresponding the experimental values of the cohesive energy for Mo and W nanoparticle. It is found that if the parameter α of Morse potential increases then the range of the interatomic potential decreases.
Keywords
Cohesive energy
Morse Potential
Size-dependence of nanoparticles
Physical properties of nanoparticles

1 Introduction
The size dependence of physical properties of nanoparticles such as thermal Debye temperature (Sadaiyandi, 2009), elastic strength (Bian et al., 2014), Young modulus (Price et al., 2006), and melting point (Schlexer et al., 2019) is one of important subject. A drastical change was found in the physical properties when the dimensions of the material reduced to nano size. The most important quantity to investigate the physical properties of nanoparticles is cohesive energy. Cohesive energy is the energy required to partition the solid material into disconnected particles by breaking all its bonds, which can be used to derive most of the thermodynamical properties of materials (Qi et al., 2005).
Many potential functions were used to investigate the size dependence of cohesive energy such as Lennard-Jones (or LJ (12-6)) potential (Qi and Wang, 2004) and Mie-type potential (Barakat et al., 2007). Moreover, a hypothetical model about the effect nanoparticle size on the cohesive energy has been studied by Qi, 2005.
The experimental values of the cohesive energy for Molybdenum (Mo) and Tungsten (W) were reported respectively as follow −410 kJ/mol (with size 2000 atoms) and −619 kJ/mol (with size 7000 atoms) (Kim et al., 2002). However, the bulk cohesive energy of Mo is −598 kJ/mol and W is −824 kJ/mol (Edgar, 1993). The observed values of the cohesive energy show that the decreasing of nanoparticles size leads to decreasing the cohesive energy of nanoparticles.
The structure of this paper is as follows: theory and model of the calculation of cohesive energy for nanoparticles using Morse potential in Section 2. The numerical results discussions will be presented in Section 3.
2 Theory and model
In current model, it is affirmed that the nanoparticle has initially cubic structure: simple cubic (SC), body-centered cubic (BCC) or face-centered cubic (FCC). The atoms within the nanoparticle are all in equilibrium and the two atoms
and
separated by a distance
in nanoparticle are interacting with each other via Morse potential function (Morse, 1929).
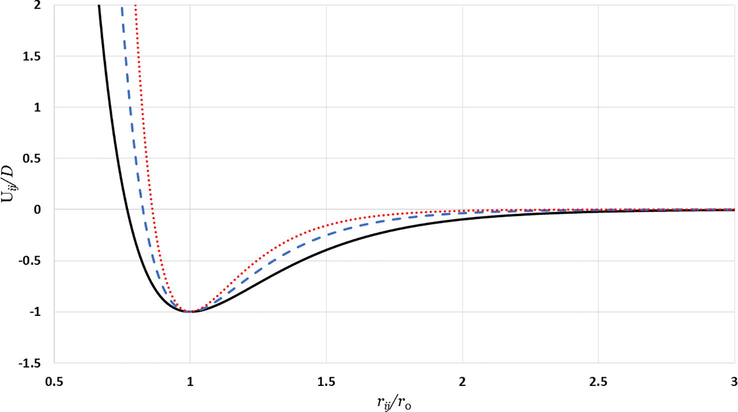
Morse potential curves for different values of
:
is represented by the solid black line,
is represented by the dashed blue line, and
is represented by the dotted red line.
The cohesive energy of nanoparticles equal to the total energy of all
atoms in the nanoparticles is given by
Inserting Eq. (1) into Eq. (2);
( is the nearest distance between two atoms), and is reduces nearest distance between two atoms. The terms and are represented to the long-range and short-range terms respectively (Lim, 2007).
The cohesive energy of the nanoparticle with
atoms in equilibrium configuration should be obtained by minimizing the entire energy of the nanoparticle regarding to the reduced space between nearest two atoms
as follows
The cohesive energy that given by Eq. (3) is for
atoms. However, the cohesive energy per atom in equilibrium configuration is
The relative cohesive energy (which is free from the parameter
) of the nanoparticle is the proportion of cohesive energy for n atoms to the corresponding cohesive energy of bulk material
is
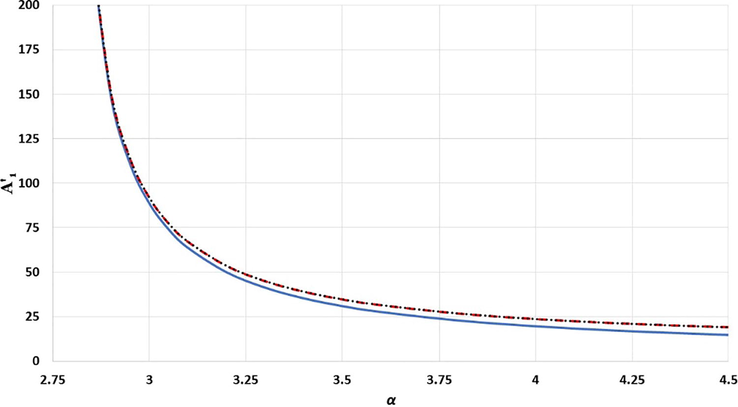
The effect of
parameter in the long range term
for different structures: simple cubic is represented by solid blue line, body-centered cubic is represented by black dotted line, and face-centered cubic is represented by red dashed line.
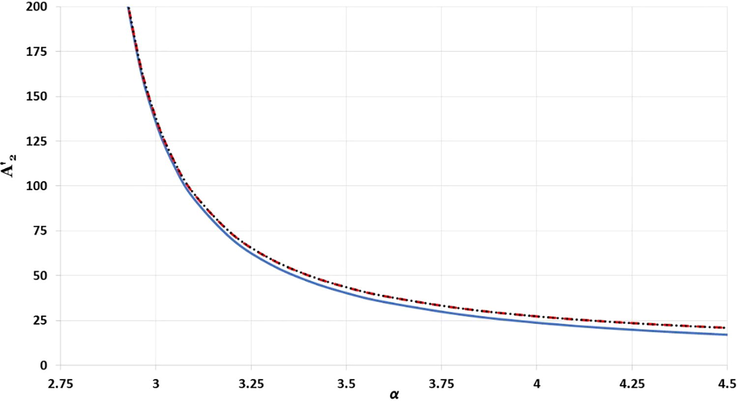
The effect of
parameter in the short range term
for different structures: simple cubic is represented by solid blue line, body-centered cubic is represented by black dotted line, and face-centered cubic is represented by red dashed line.
3 The numerical results and conclusions
The curves in Figs. 4–6 represent the relative cohesive energy of nanoparticle as function of n-atoms are obtained from Eqs. (5) and (7). The relative cohesive energy curves are calculated for different cubic metallic structures and different values of the
parameter. The red cycles in Fig. 6 are denoted for experimental values of relative cohesive energy for Mo nanoparticle which is 0.6856 in the size
and W nanoparticle which is 0.7512 in the size
(Kim et al., 2002).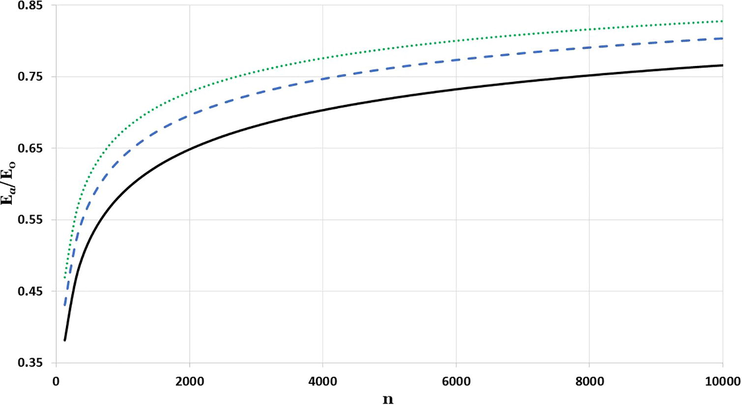
The impact of particle size in the relative cohesive energy of simple cubic nanoparticles with diverse values of
parameters:
is represented by solid black line,
is represented by dashed blue line, and
is represented by dotted green line.
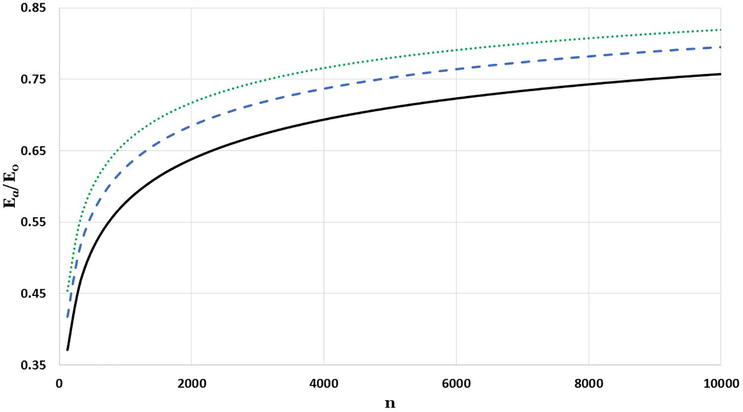
The impact of particle size in the relative cohesive energy of body-centered cubic nanoparticles with diverse values of
parameters:
is represented by solid black line,
is represented by dashed blue line, and
is represented by dotted green line.
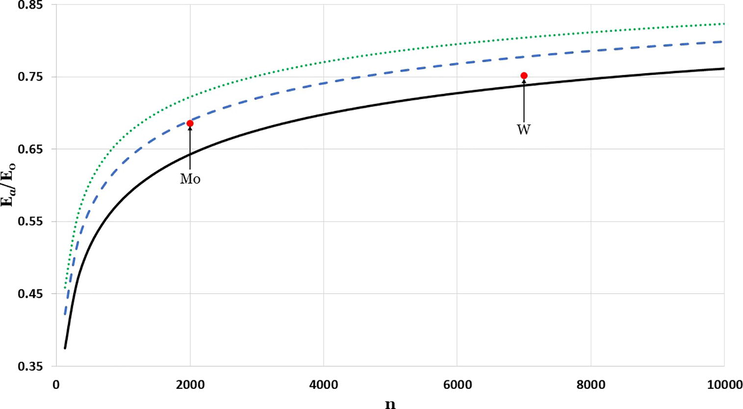
The impact of particle size in the relative cohesive energy of face-centered cubic nanoparticles with diverse values of
parameters:
is represented by solid black line,
is represented by dashed blue line, and
is represented by dotted green line. The red circles are denoted for experimental values (Kim et al., 2002).
The results in the Figs. 4–6 show the size impact of nanoparticle on the cohesive energy, where the relative cohesive energy increases as the nanoparticle size increases, and lean towards the corresponding cohesive energy of bulk metal. The higher the parameter, the lower the potential reaction range, which resembles the effect of reducing the size of nanoparticles that destabilize the coherent energy as found in Barakat et al., 2007. After systematic search to find the possible candidate values of the parameter to predict the experimental values for the relative cohesive energy of Mo and W nanoparticles. It is found that the candidate values of the parameter for Mo and W nanoparticles respectively are 3.03 and 3.095.
In conclusion, Morse potential is used to study the impact of the size of the nanoparticles on the cohesive energy for different metallic cubic structures. It is found that the range of atom–atom interaction in Morse potential can be controlled only by one parameter rather than two parameters in Mie-type potential (Barakat et al., 2007). The present calculations show that Morse potential is a powerful candidate to study the thermodynamical properties of nanoparticle, where the calculated results of the cohesive energy are consistent with corresponding the experimental values of the cohesive energy for Mo and W nanoparticle.
Acknowledgment
Researchers supporting project number (RSP-2019/61), King Saud University, Riyadh, Saudi Arabia.
Declaration of Competing Interest
The authors declare that they have no known competing financial interests or personal relationships that could have appeared to influence the work reported in this paper.
References
- The effect of mie-type potential range on the cohesive energy of metallic nanoparticles. Int. J. Nanosci.. 2007;6:461-466.
- [Google Scholar]
- The strongest particle: size-dependent elastic strength and debye temperature of PbS nanocrystals. J. Phys. Chem. Lett.. 2014;5:3688-3693.
- [Google Scholar]
- Edgar E.L., 1993. Periodic Table of the Elements, Gaston, Oregon.
- Application of the Morse potential function to cubic metals. Phys. Rev.. 1959;114:687-690.
- [Google Scholar]
- The cluster size dependence of thermal stabilities of both molybdenum and tungsten nanoclusters. Chem. Phys. Lett.. 2002;354:165-172.
- [Google Scholar]
- The relationship between Lennard-Jones (12–6) and Morse potential functions. Z. Naturforsch. A. 2003;58:615-617.
- [Google Scholar]
- Long range relationship between Morse and Lennard-Jones potential energy functions. Mol. Phys.. 2007;105:1013-1018.
- [Google Scholar]
- Diatomic molecules according to the wave mechanics. II. Vibrational levels. Phys. Rev.. 1929;34:57-64.
- [Google Scholar]
- Measuring the size dependence of Young's modulus using force modulation atomic force microscopy. J. Phys. Chem. A. 2006;110:1382-1388.
- [Google Scholar]
- Size and shape dependent melting temperature of metallic nanoparticles. Mater. Chem. Phys.. 2004;88:280-284.
- [Google Scholar]
- Surface-area-difference model for thermodynamic properties of metallic nanocrystals. J. Phys. D. 2005;38:1429-1436.
- [Google Scholar]
- Size dependent debye temperature and mean square displacements of nanocrystalline Au, Ag and Al. Mater. Chem. Phys.. 2009;115:703-706.
- [Google Scholar]
- Size‐dependence of the melting temperature of individual Au nanoparticles. Part. Part. Syst. Charact.. 2019;36:1800480. (1–7)
- [Google Scholar]


