Translate this page into:
The effect of Li2O and LiF on structural properties of cobalt doped borate glasses
⁎Corresponding author. a.m_abdelghany@yahoo.com (A.M. Abdelghany)
-
Received: ,
Accepted: ,
This article was originally published by Elsevier and was migrated to Scientific Scholar after the change of Publisher.
Peer review under responsibility of King Saud University.
Abstract
Two glassy (LiF–B2O3) and (Li2O–B2O3) systems containing different content of CoO dopants (0.05, 0.1, 0.15, 0.2 wt%) were prepared. UV/Vis optical absorption of base glasses reveals a strong UV absorption bands attributed to unavoidable contaminated trace iron impurities. CoO-doped glasses show extra three visible bands due to both octahedral and tetrahedral Co2+ ions related to the little variation between energies of ligand field stabilization between the two coordination states. Fluoride containing glasses show limited variations in the spectral properties due to the different ligand strength of the anions (F− and O2−). FTIR spectra display characteristic modes of vibrations due to triangular and tetrahedral borate groups. It is assumed that LiF acts as Li2O in promoting the formation of tetrahedral (BO3F) units which possess the same wavenumber position for vibrations of (BO4) units in the range of 800–1200 cm−1. CoO causes no distinct variations in number or position of characteristic IR vibrational bands due to their low dopant level (0.05–0.2%). A new suggested trial has been utilized to calculate the percent of four coordinated borons from both optical and FTIR spectra to give more insight on the role of CoO as dopant on these spectral properties and on the calculated parameters.
Keywords
Borate glass
CoO
Optical
FTIR
LiF
Li2O
Four coordinated boron
1 Introduction
The combination of fluoride ions in various oxide glasses introduces special oxyfluoride variety of vitreous materials that gathered optical characters of fluorides with physical and chemical characteristics of oxide glasses to obtain the best properties of both constituents; the low phonon energy and refractive index of fluorides and durability or stability toward devitrification of the oxide glasses (Matthew, 1998; Gan, 1995).
Mixed phosphate and fluoride glasses often combine many desirable properties of the pure fluoride as well as the metaphosphate glasses such as a high transmission from ultraviolet to infrared, a low partial dispersion good laser properties and the capability to incorporate high concentration of transition metals or rare earth ions (Ehrt et al., 2000; Moncke et al., 2005).
Gressler and Shelby (1988, 1989) have extensively studied mixed fluoroborate glasses and investigated their physical properties. Alkali fluoroborate glasses that contain up to 45 mol% alkali fluoride (LiF, NaF or KF) showed properties trends comparable to that of alkali oxide borate glasses. (Shelby and Ortolanor, 1990; Shelby and Baker, 1998) have suggested a structural model based NMR examinations of sodium fluoroborate glasses the suggested model reveals a replacement of BO3F tetrahedra instead of BO4 tetrahedra.
Doweidar et al. (2012) have studied the properties and structure of binary CaF2-B2O3 glasses (30–45 mol% CaF2). They have assumed that CaF2 partially modified B2O3 forming (CaBO3F) units and the CaF2 considered to build an amorphous network of CaF4 tetrahedra. The IR spectra of the studied calcium fluoroborate glasses are similar to that published by Kamitsos (2003) for alkali oxide borate and alkaline earth oxide borate glasses in the presence of tetrahedral borate units and trivalent borate units in their specific wavenumbers.
Cobalt like nickel belongs to 3d transition metals which can dissolve in the form of its oxide (CoO) in glasses and their ions exhibit brilliant distinctive colors and are known from ancient Egyptian times to be used in colored glazes as well as glasses (Bamford, 1997; Newton and Davison, 1989). These specific cobalt and nickel ions are considered to be present mainly in the divalent states in case of glasses melted under atmospheric conditions with octahedral and tetrahedral coordination’s. Co2+ is the only known ion from 3d TMs having the 3d7 configuration. The familiar observation of both tetrahedral and octahedral coordination’s of divalent cobalt ions in several glasses is attributed to the little variation between energies of ligand field stabilization between the two coordination states (Doweidar et al., 2012; Kaewnuam et al., 2016). Optical absorption spectra of glasses containing cobalt ions have been interpreted in view of the equilibrium between the two possible coordination states of Co2+ (Carvalho et al., 2010; Yusub et al., 2016; Abdelghany et al., 2014), based on the nature of glass under investigation, their nominal composition and condition of melting.
The main goal of the present work is to compare collective optical and FTIR spectral properties of prepared glassy systems (Li2O–B2O3), (LiF, B2O3) containing successive CoO (0.05, 0.1, 0.15 or 0.2) to have brilliant colors which are suitable for UV–visible measurements. This study will enable to make a correlation between the variations of the coordination state of Co2+ ions in these two glass systems in relation to the percent of four-coordinated borons and the role governing this relation. Also, the present study is expected to specify the specific effects of Li2O or LiF on the percent of tetrahedral borate units formed.
2 Experimental
Glasses of the two systems with the basic composition (Li2O-3B2O3) and (LiF-3B2O3) were prepared from pure laboratory chemicals of orthoboric acid H3BO3 (99% purity from Rayasan chemicals Co.) for B2O3, Li2CO3 for Li2O and LiF (Riedel-De Haen AG) as such. Cobalt oxide was added in these percents (0.05, 0.1, 0.15 and 0.2% CoO). The batches were melted in platinum crucibles at 1050 °C for 120 min. with continuous rotating of the melts at fixed intervals to stimulate complete mixing and homogeneity. The melts were cast into warmed stainless steel molds of the required dimensions. The same prepared samples were annealed in a muffle furnace regulated at 380 °C and then cooled slowly to room temperature inside the muffle. Optical absorption spectra of prepared samples with constant thickness (2 mm ± 0.1 mm) were recorded by spectrophotometer (JASCO 430, Japan) in the spectral range of 200–1100 nm. FTIR spectra of the prepared samples were recorded using spectrometer (Nicolet is10, USA) with the KBr disk technique. Each sample was measured twice to confirm the accuracy of the positions of the vibrational bands.
3 Results
Fig. 1a and b shows the optical (UV/Visible) absorption spectra of base undoped and CoO-doped LiF–B2O3 glasses (a) and Li2O–B2O3 glasses (b).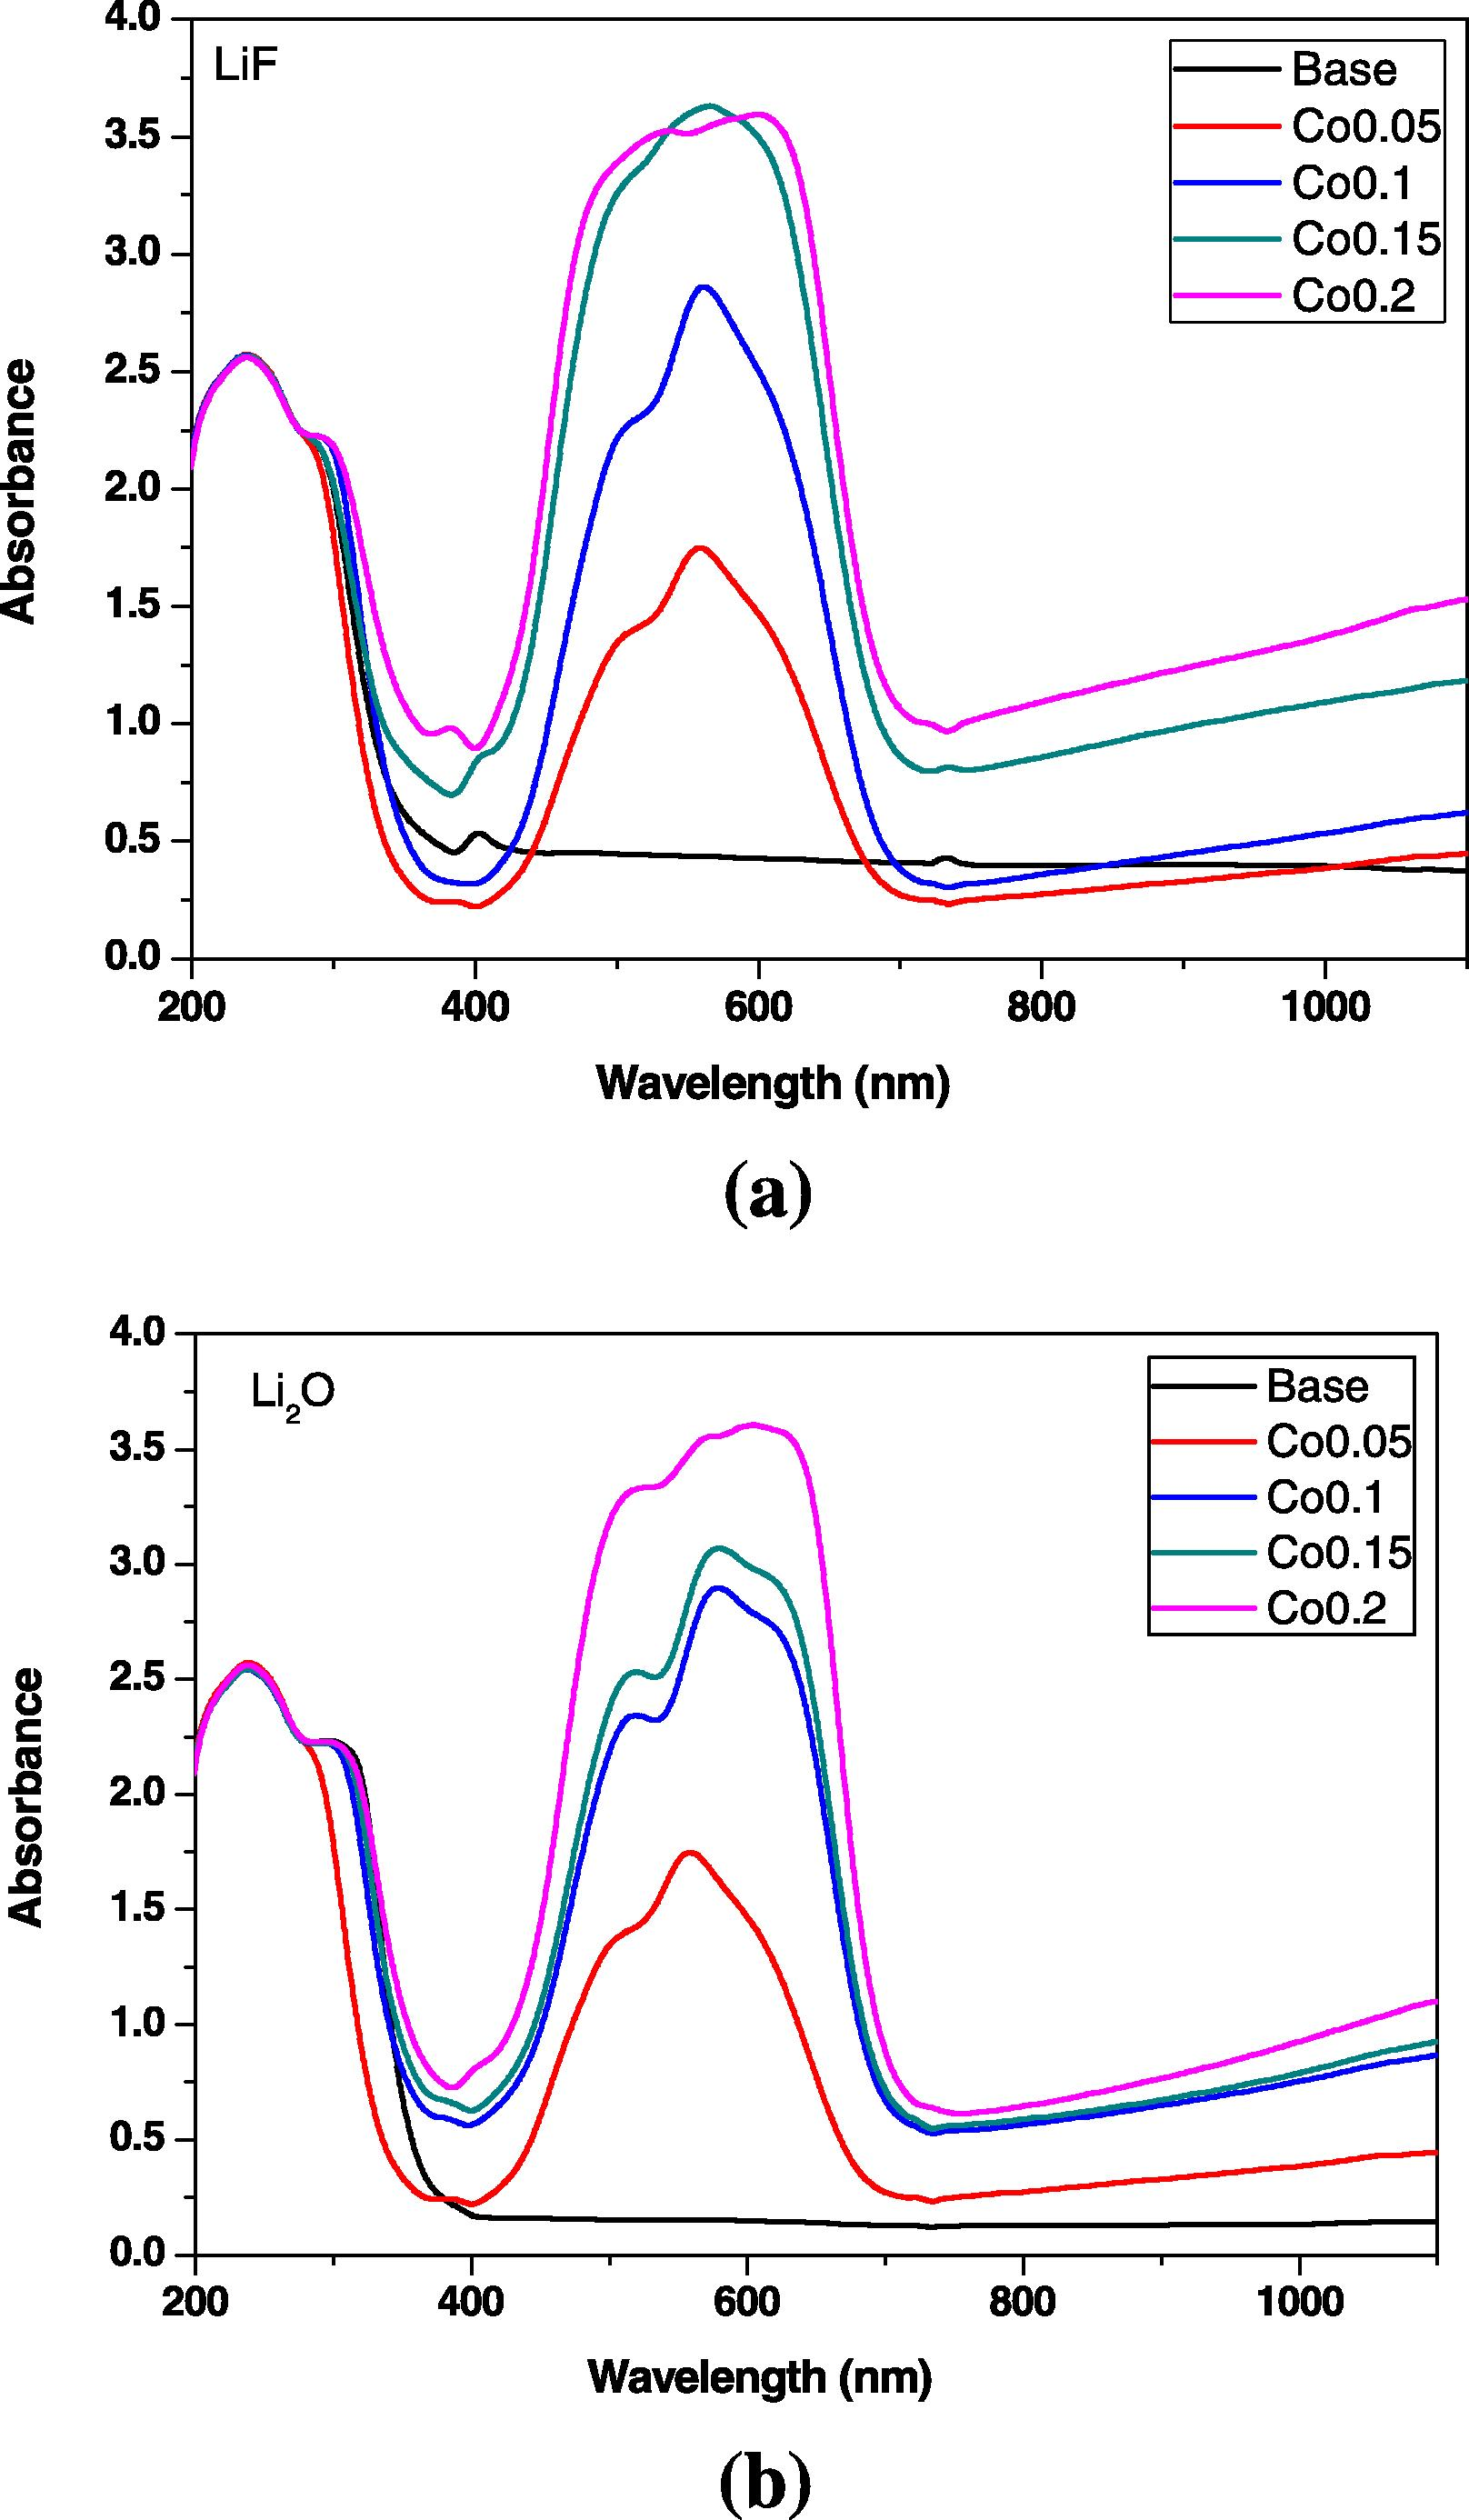
(a, b) Optical absorption spectra of CoO-doped LiF–B2O3 and Li2O–B2O3 glasses.
The comparison of the optical spectra of the two systems indicates some general resemblance of the spectral features with the increase in CoO. However, the detailed optical (UV/Vis) absorption of the two systems reveals some limited variations as can be outlined as follows:
3.1 UV/Vis optical absorption spectra of the system LiF–B2O3
The optical absorption spectrum of the base LiF–B2O3 glass shows strong UV absorption consists of two diverse peaks at ∼235 and 295 nm tailed by a curvature at 380 nm and a small peak at 420 nm and with no further absorption bands in the visible region till 1100 nm. On introducing 0.05% CoO, the UV absorption spectrum remains almost unchanged with the same two peaks while the visible region of spectrum shows a broad and extended band from about 420–700 nm with three peaks located at about 520, 575 and 620 nm with the middle peak highest than the others. Further increase in CoO to 0.1% in the same UV absorption spectrum is retained and the visible peak increases in intensity with nearly the same position for the three peaks. The two last glasses containing 0.15 and 0.2% CoO exhibit the same UV spectrum as the previous samples but the visible spectra are very intense and nearer to each other and the peaks are closer in intensity.
3.2 Optical spectra of Li2O–B2O3 glasses
The optical spectrum of the base Li2O–B2O3 glass reveals nearly similar strong UV absorption spectrum but with the two distinct peaks at 235 and 310 nm and with a slight curvature at about 380 nm and without any further absorption peaks to the end of measurement at 1100 nm. The glass containing 0.05% CoO reveals nearly the same spectral characteristics as that of LiF–B2O3 glass containing the same CoO content except that the second UV peak shifts to about 295 nm. With progressive increasing of CoO content, the broad visible band exhibits strong tri-split peaks and is observed to increase continuously in intensity with the increase in CoO content and with the highest peak shifts to reach 630 nm with the maximum content of CoO (0.2%).
3.3 FTIR absorption spectra
Fig. 2a and b illustrates the infrared absorption spectra of the glasses from the two systems (LiF–B2O3) and (Li2O–B2O3). The detailed spectral characteristics are summarized as follows.
3.3.1 FTIR absorption spectra of LiF–B2O3 glasses
Fig. 2a shows the FTIR spectra of prepared glasses in the system of basic composition (LiF–B2O3). FTIR spectrum of such glass consists mainly of three small peaks in the far-IR region at about 420, 465 and 515 cm−1. A strong and sharp peak is observed at about 690 cm−1. A broad band in the region 800–1200 cm−1 resolved into four peaks located at 785, 925, 1030 and 1070 cm−1 which are observed in addition to a second broad band in the region 1220 to 1650 cm−1 with four resolved peaks at 1240, 1380, 1540 and 1650 cm−1. A near IR broad band is observed to be centered at 3425 cm−1. The introduction of CoO into the glassy matrix results in a decrease of the intensity of the band at 690 cm−1, decrease of the intensity of the second broad band especially within the spectral region 1380–1550 cm−1 and finally a decrease of the intensity of the near IR broad band.
3.3.2 FTIR spectra of Li2O–B2O3 glasses
The infrared spectra of the prepared glasses from this system (Fig. 2b) include three successive connected far infrared peaks at 420, 460 and 530 cm−1, medium band at 700 cm−1, a broad and strong band extending from 780 to 1200 cm−1 with rounded peak centered at 970 cm−1 and a curvature at 1080 cm−1, broad and strong band extended from 1250 to 1650 cm−1 with two rounded peaks at 1370 and 1520 cm−1 followed by a curvature at about 1640 cm−1, and finally, a broad near IR band is observed to be centered at 3426 cm−1.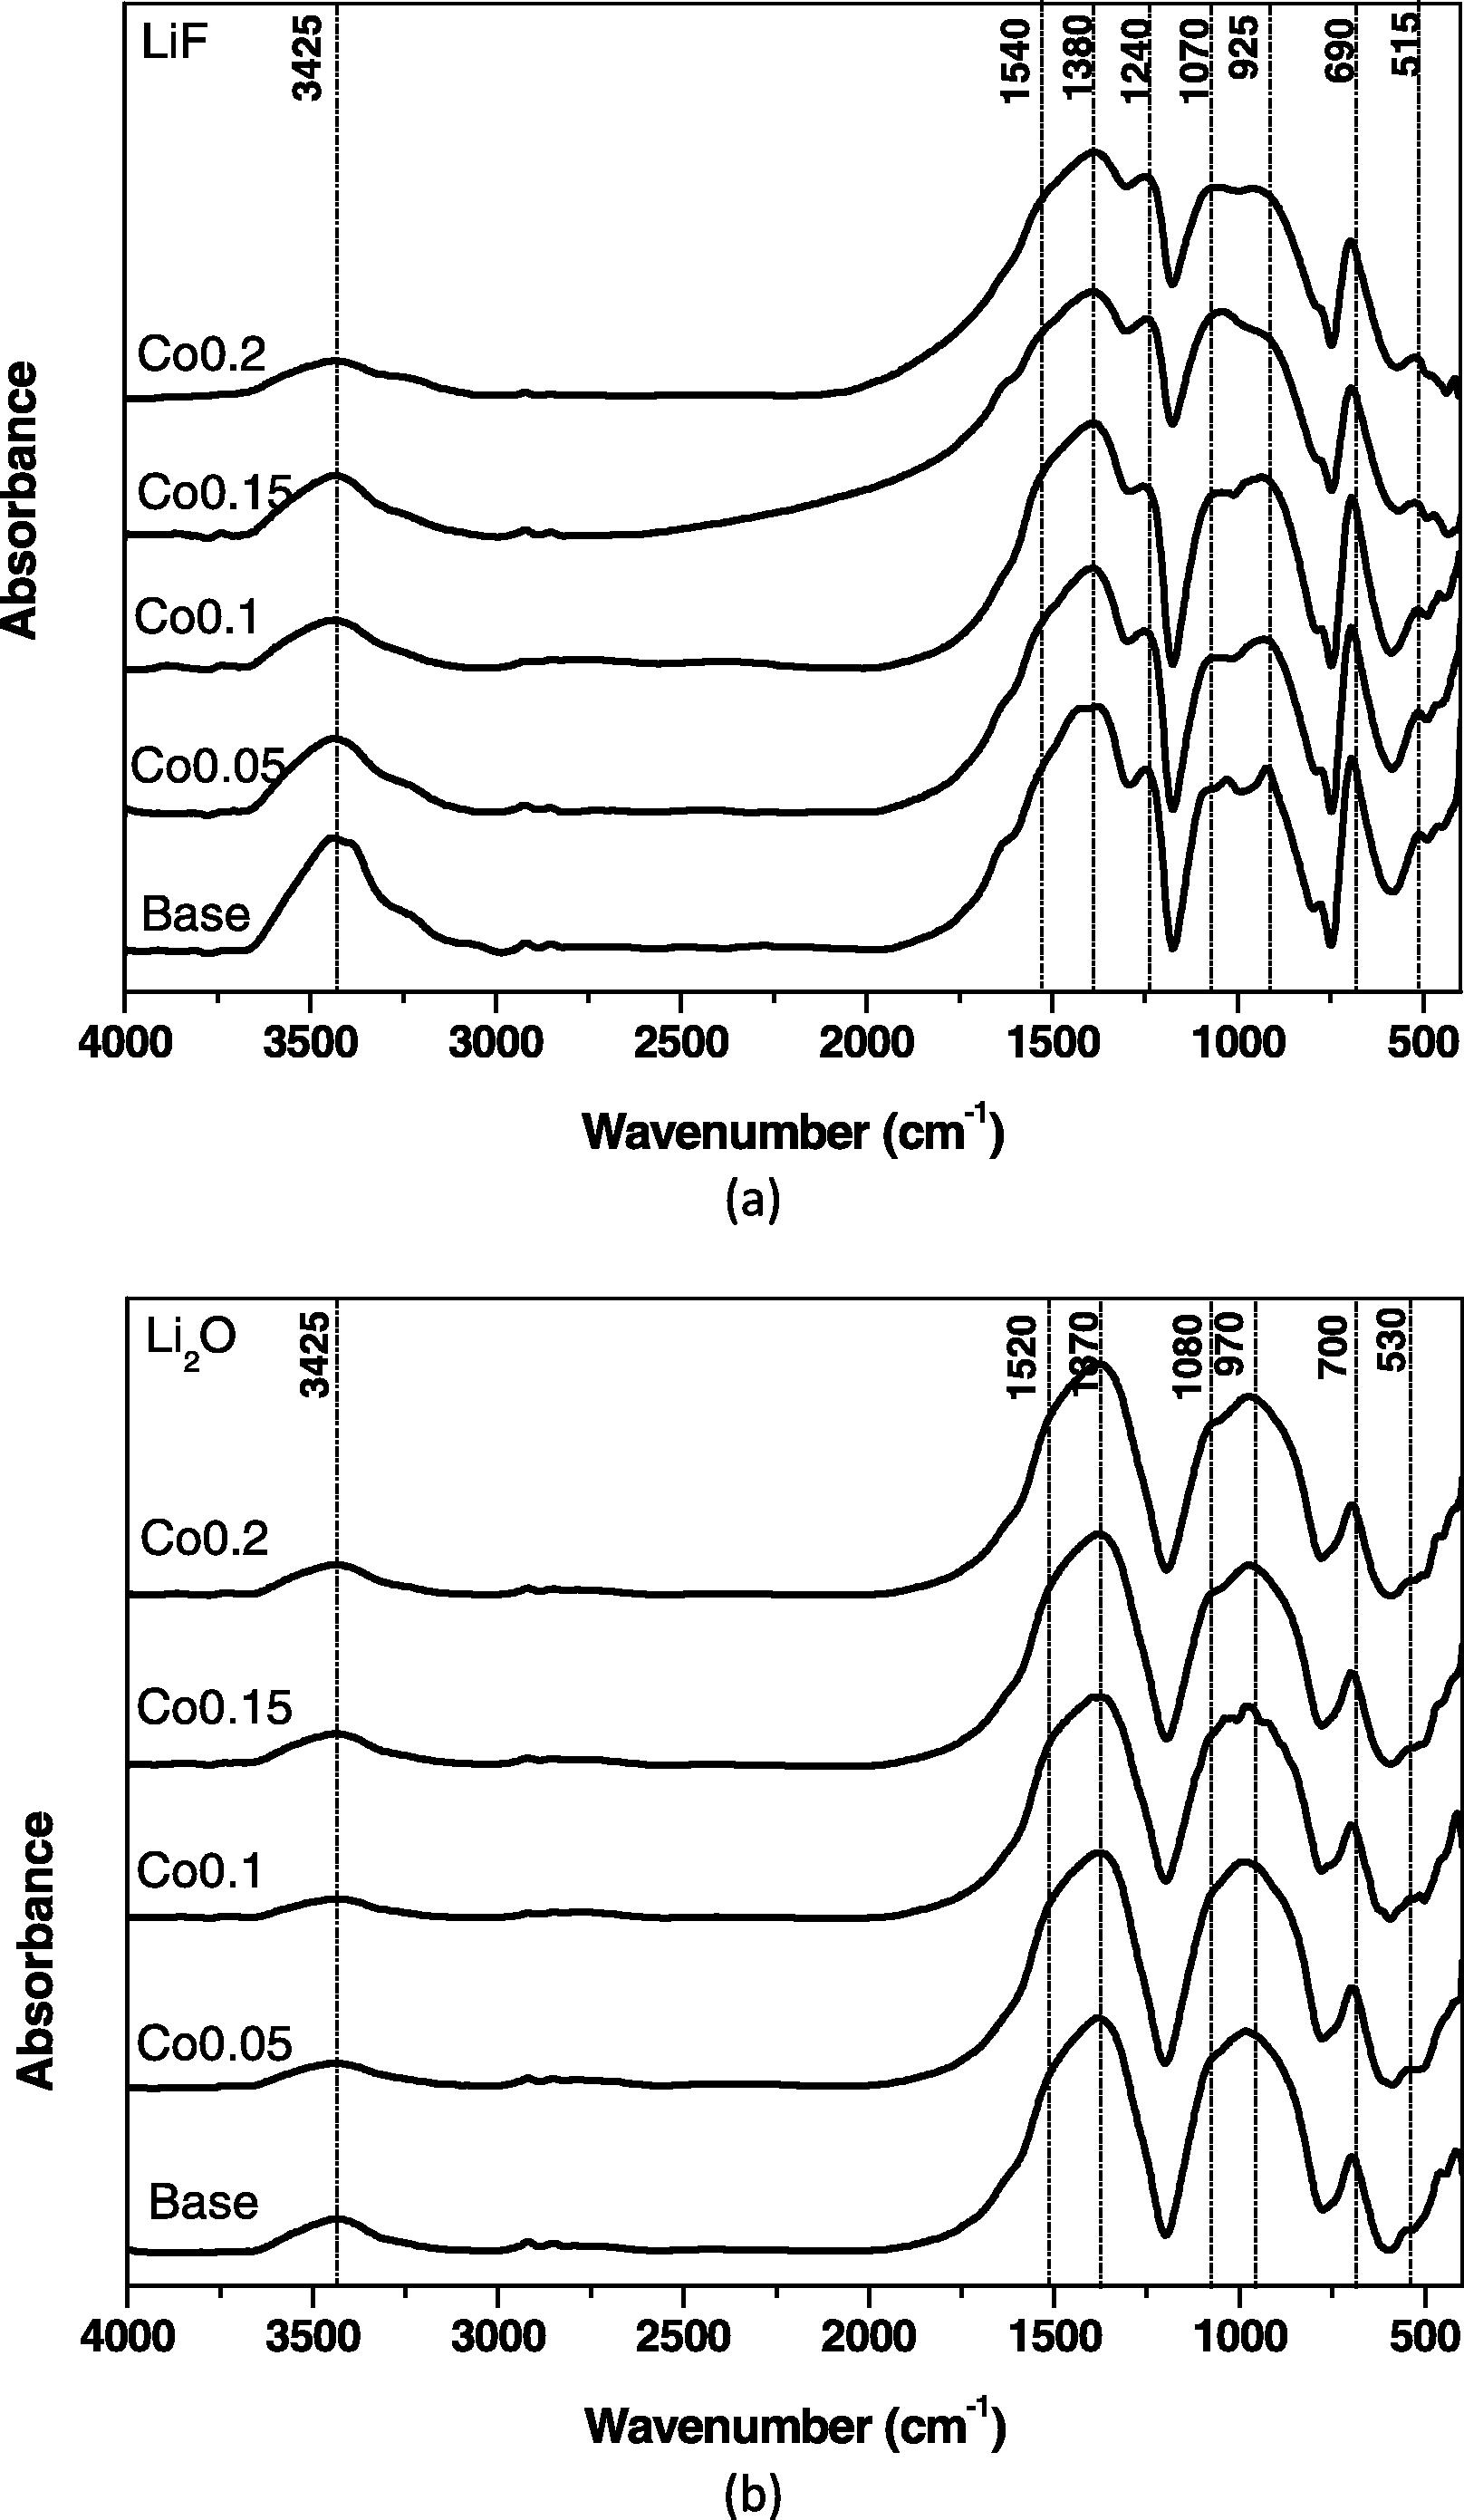
(a, b) FTIR spectra of CoO-doped LiF–B2O3 glasses and Li2O–B2O3 glasses.
3.4 A suggested specific method for calculation of N4 from optical spectra
A suggested new method for calculating the most important parameter in borate glass (N4) was introduced. N4 defined as the fraction of 4-coordinated boron to the total amount of boron [N4 = BO4/(BO3 + BO4)].
The spectrum was corrected for dark current noises and bad signals taking into consideration the linear baseline and normalized scale suitable for quantities analysis. The spectrum was classified into three major sections concerning spectral regions, region I with area AI related to the UV portion with three peaks at about 199, 235 and 288 nm related to the basic glassy matrix and their contamination even in ppm level. The second region II starts from visible band with ascending lobe in the range 490–560 nm with area AII. The last region III attributed to the presence of Co ion in specified coordination state around 610 nm with area AIII as shown in Fig. 3. This method can be applied only for the doped glasses.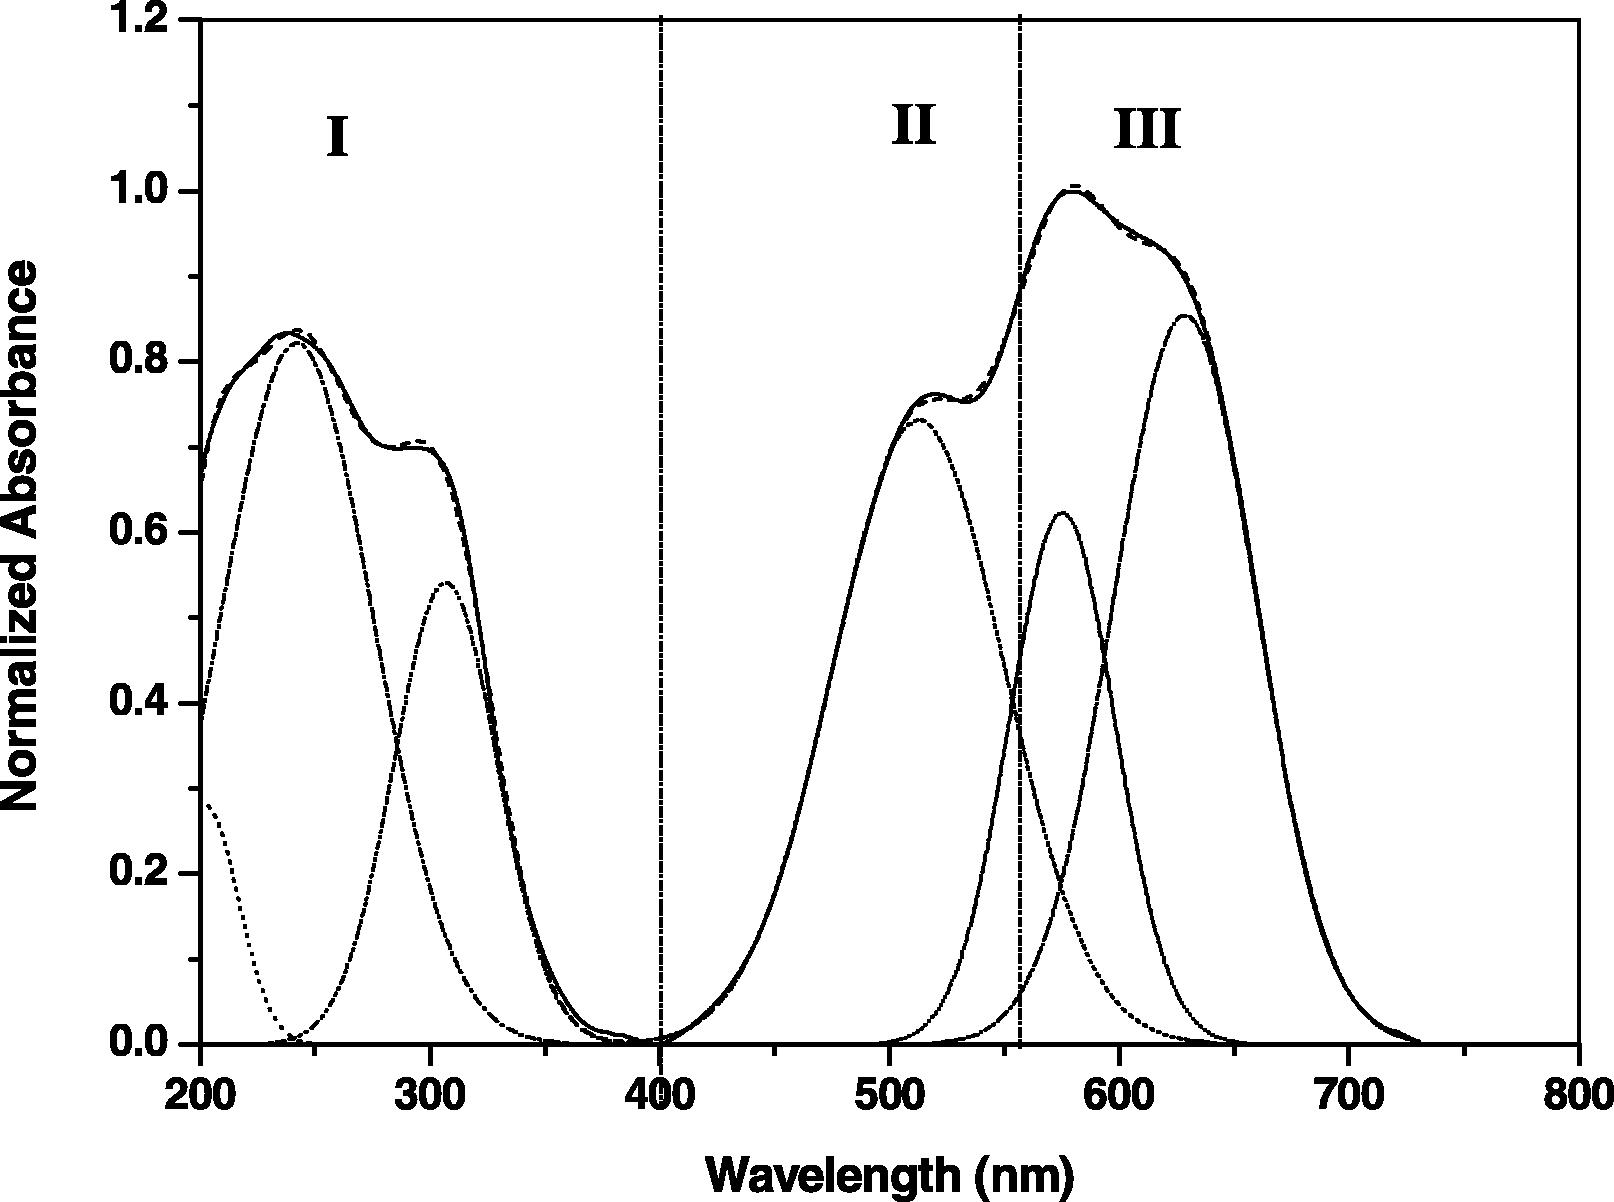
Selected example for UV/Vis data fitting for N4 calculations.
The effect of increasing CoO content on the IR spectra is very limited. The number and position of the mentioned main vibrational band observed within the base undoped glass remain unchanged. The second broad band (1250–1650) cm−1 is observed to be slightly higher in intensity than the first broad band (800–1200) cm−1. Also, the near IR broad band at 3425 cm−1 is slightly decreased.
Fig. 4 illustrates the calculated variation of tetrahedral BO4 relative to total BO3 and BO4 (N4) with the increase in CoO. The data indicate that for Li2O–B2O3 glass, the increase in CoO from 0.05% to 0.10% causes nearly no variation in the percent of N4 and after which further increase to 0.15 CoO decreases the N4 percent and then attains stability with 0.2 CoO%. For the LiF–B2O3 glass, the N4 percent progressively increases with CoO from 0.05% to 0.15% and then stabilizes with further increase to 0.2% CoO.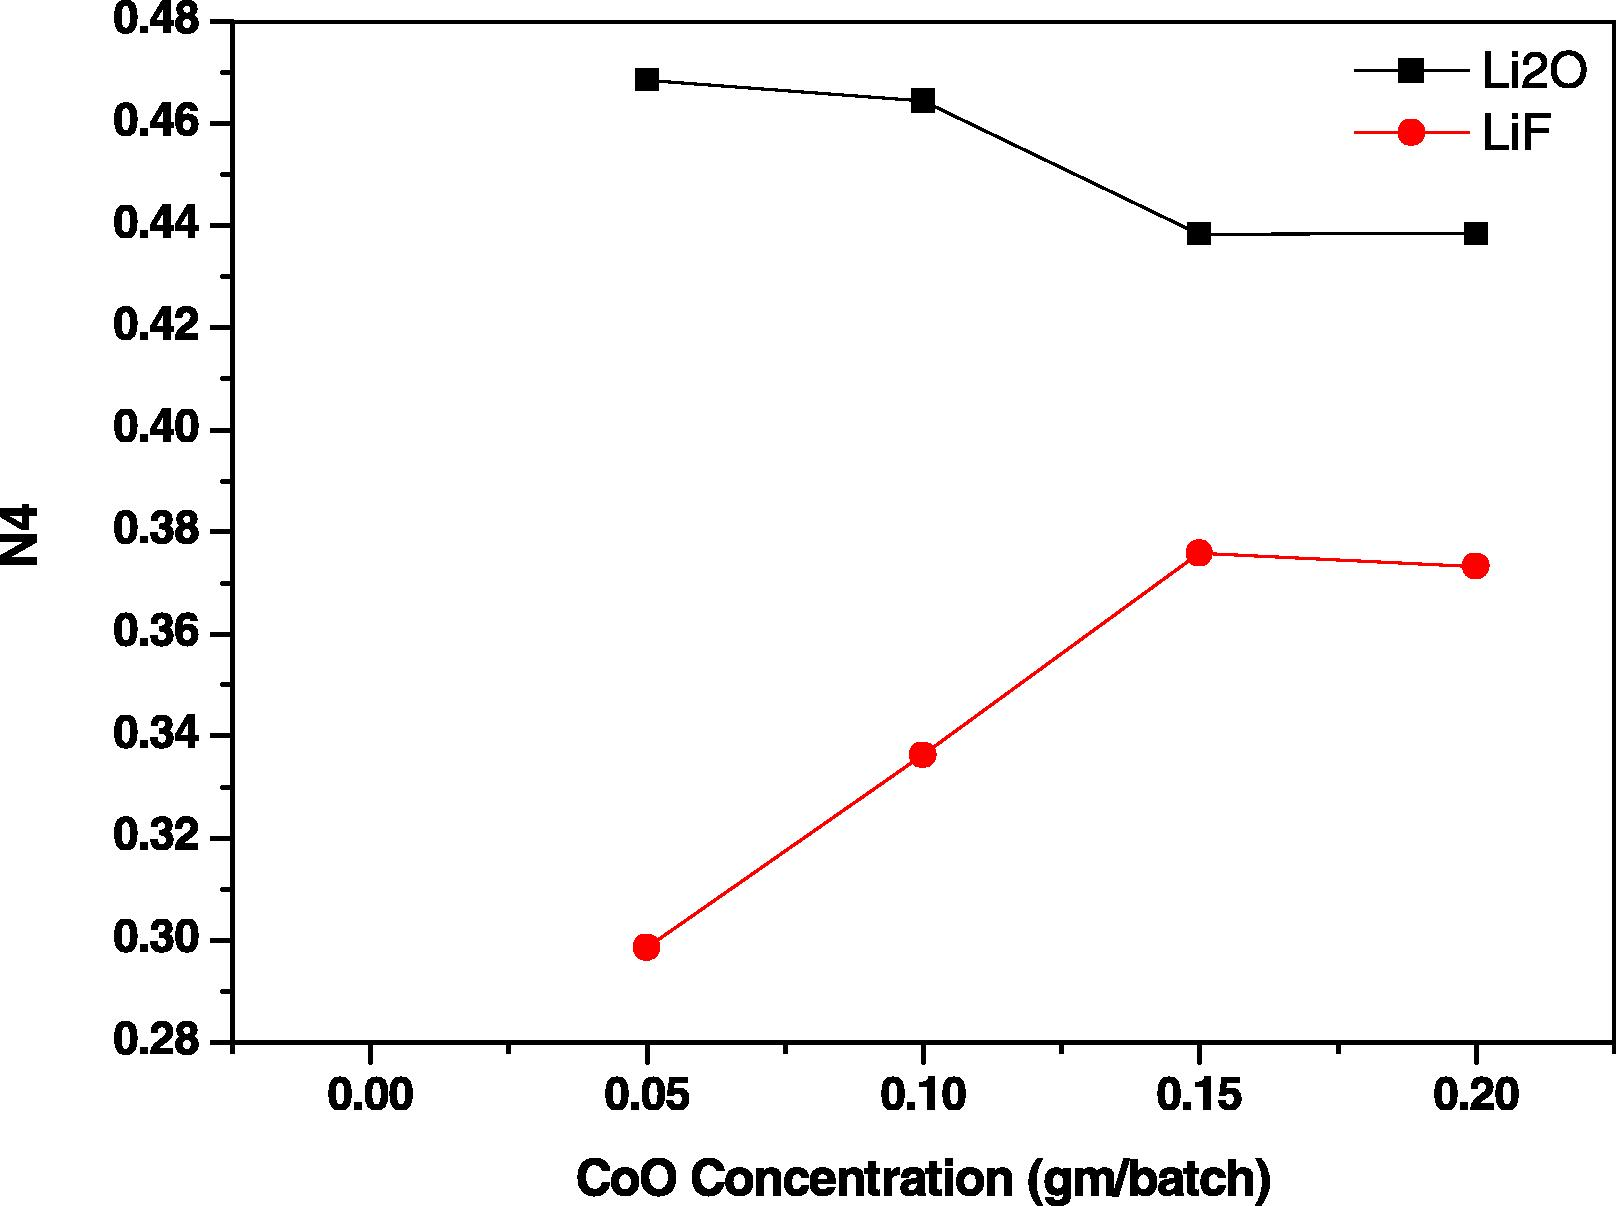
Variation of N4 for prepared samples.
3.5 Approximation for calculation of N4 from UV/Vis. optical absorption data
Fig. 5a and b reveals fitted plot of both areas under the curve in the visible region ascribed to the presence of Co ions in case of LiF (a) and Li2O (b) combined with the calculated value of N4 in both cases for triplicate samples. It is found that the behavior is very similar to that calculated using FTIR spectra as previously mentioned by Moncke et al. (2005) and Kamitsos (2003). The calculated values are found to fall within the precise results and the extents of variations are within the experimental errors.
4 Discussion
4.1 Interpretation of the UV absorption spectra from pristine LiF–B2O3 and Li2O–B2O3 glass
Sigel and Ginther (1968) and Sigel (1977) have assumed that some undoped commercial glasses exhibit UV charge transfer absorption due to the presence of unavoidable trace iron impurities (mainly Fe3+ ions). (Duffy, 2001) has classified charge transfer spectra in glasses and he has also considered that certain transition metal (TM) ions (e.g. Cr6+, Fe3+) even if present in the ppm level could produce strong UV absorption. He has attributed the absorption to result from an electron transfer mechanism including the transition of an electron from the orbital of a coordinating oxygen atom to an orbital of the metal ion.
Abdelghany et al. (2015) and Abdelghany and ElBatal (2016) have recognized strong UV charge transfer absorption bands in different undoped borate glasses. The existing detected strong UV absorption bands can thus be ascribed to the presence of trace iron impurities (mainly Fe3+ions) impurities in the chemicals involved in the preparation process of the two mentioned borate glasses.
4.2 Elucidation of the absorption spectra of CoO-doped glasses
The CoO-doped glasses exhibit distinct bluish color but with slight variations between the glasses containing Li2O or LiF. The absorption spectra of the two varieties of glasses show the same strong UV absorption indicating the presence of trace ferric ions impurities in both glasses. Also, the two types of borate glasses show the appearance of distinct visible bands that indicate the presence of cobalt ions in the divalent state with two coordinations, namely, tetrahedral and octahedral forms.
It can be assumed based on previous studies on CoO-doped glasses (Bamford, 1997; Paul, 1990; Abdelghany et al., 2014; Naresh et al., 2012): that
-
The band at about 520 nm is attributed to octahedral form of Co2+ ions through the transition 4T1g(F) → 2T1g(H).
-
The two other visible bands at about 575 and 620–630 nm are related to the two transitions 4A2(4F) → 4T1(4P) and 4A2(4F) → 4T1(4F) within tetrahedral coordination (Zaman et al., 2016a,b).
-
The effect of replacing the oxygens by fluoride anions reveals some limited changes in the optical spectra and they can be explained in view of change in the ligand field strength, and thus a shift in the position of the absorption bands with no change in their number or relative positions. It is assumed that the ligand field strength of the common anions decreases in the order O2 > F− > Cl− > Br− > I−. Shelby and Baker (1998) has pointed out that in many cases, the transition metals appear to prefer to be associated with halide ions instead of oxygen ions. This causes the color due to Co2+ ions to change from a dark blue-purple to lighter green due to a small shift in the absorption band position.
4.3 Interpretation of the FT infrared absorption spectra
The experimental FTIR absorption spectra can be realized and interpreted on the following basis as seen in Table 1:
-
The basic chemical composition of the two glass systems contains high glass-forming oxide percent (75% B2O3) and therefore, it is expected that the network structural units within the glasses are mainly based on borate groups with both triangular and tetrahedral coordinations.
-
The network backbone element is boron which has the lightest mass in all traditional glass forming elements and the vibrations of the constitutional groups are therefore identified within the mid region 600–1400 cm−1 and are separated from the vibrations of modifier cations which are generally active below 500 cm−1.
-
The close similarity of the number and position of the characteristic vibrational bands obtained from glasses of the two systems (LiF–B2O3) and (Li2O–B2O3) with only minor variations in the splitting or sharpness of the first group and this behavior can be related to the boron oxide constituting the main effective percent on the IR spectra. The observed similarity is not affected by the modifier oxide or fluoride.
-
The IR results support and confirm the assumptions advanced by several authors (Shelby and Baker, 1998; Doweidar et al., 2012; Hager and El-Hofy, 2003) that LiF modifies the B2O3 like Li2O and initiates the formation of tetrahedral borate groups of the suggested formula (BO3F) and which possess the same vibrational wavenumber like (BO4) within the range of 800–1200 cm−1.
-
The observed absorption broad band with several peaks extending within the region 800–1200 cm−1 is related to vibrations of tetrahedral (BO3F) or tetrahedral (BO4) groups in the first and second system, respectively (Shelby and Baker, 1998; Kamitsos, 2003).
-
The observed absorption broad band with several peaks extending from 1250–1600 cm−1 can be related to stretches of B-O bending in (BO3) or (BO2O−) units (Kamitsos, 2003).
-
The absorption bands at about 700 cm−1 can be related to bending vibrations of B-O in various borate groups while the bands in the region 400–550 cm−1 can be related to vibrations of modifier cations (Li+) (Abdelghany et al., 2015; Abdelghany and ElBatal, 2016).
| Vibrational mode | Wavenumber (cm−1) |
|---|---|
| Molecular water or BOH vibrations | 3400 |
| BO3 and BO4 (or BO3F) | <600 |
| B-O in BO3 or (BO2O−) | 1200–1600 |
| B-O bond stretching vibrations of BO4 | 800–1200 |
| Bending mode vibrations of various borate units | 670–690 |
| Li+ ions | 400–550 |
4.4 Interpretation of UV/Vis optical absorption data for N4 calculation
Recently many authors (Sabri et al., 2016; Dias et al., 2016; Rao et al., 2016) have devoted their efforts to understand the role of modifier oxide in the structural variations of glassy matrix. They have calculated the ratio of N4 that specifies portions of different boron coordination in glassy matrix and their variation with structure. A new approach for N4 calculation from UV/Vis was introduced taking into account different valences of the modifier ion.
A semi-empirical equation for calculation of the N4 ratio from previously explained data is introduced in terms of the relative areas in the analyzed regions in Fig. 5 as follows;
where b is a constant depending on the main matrix composition. The experimental data are found to be compatible and confirm the values obtained using different techniques.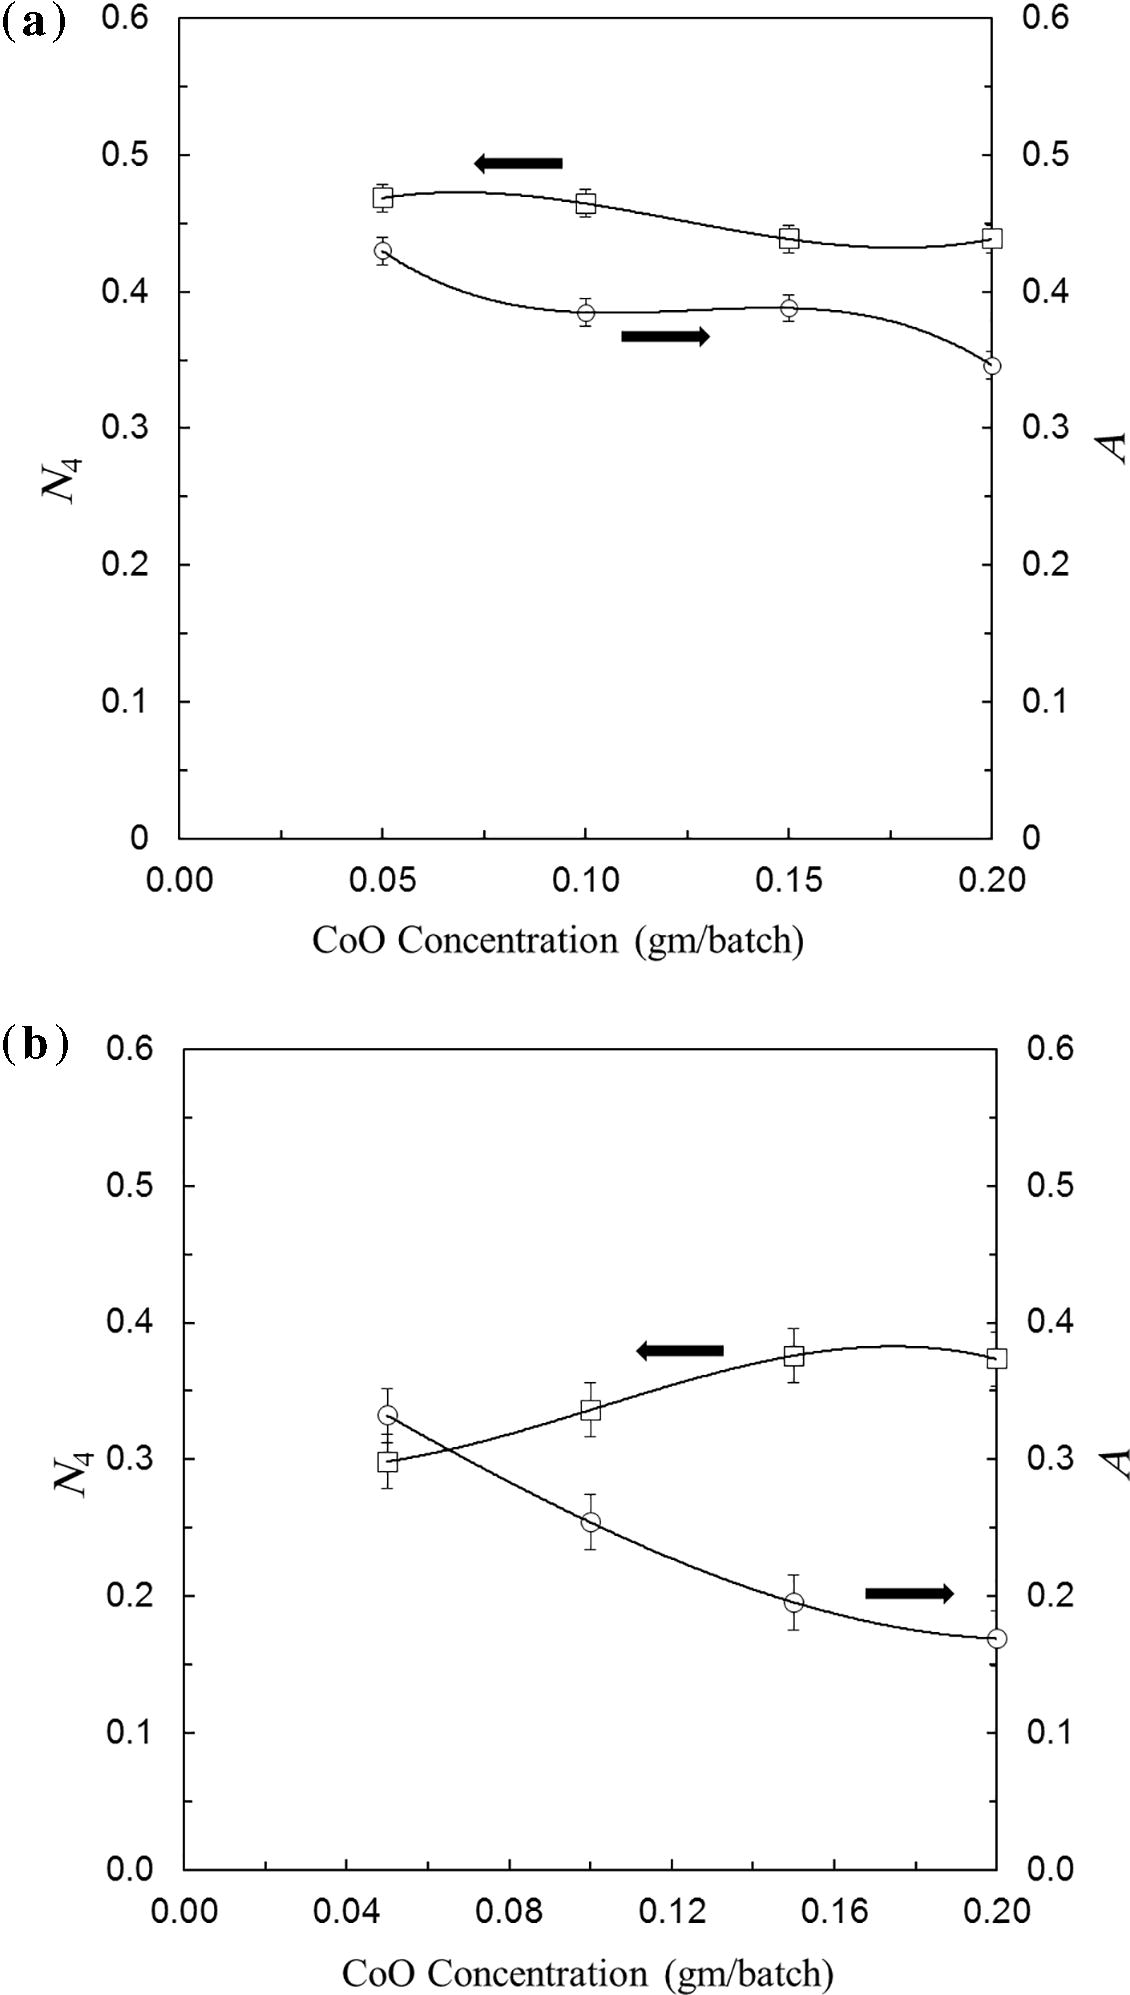
Calculated values of N4 and correlation with area under visible band result from CoO both in case of LiF (a) and Li2O (b).
5 Conclusions
Optical absorption spectra of LiF–B2O3, Li2O–B2O3 glasses reveal the appearance of two strong UV absorption related to trace ferric ions contaminated within the chemicals used for glass preparation. Co-doped glasses show additional distinct broad triply split connected bands, the first peak is related to octahedral coordination of divalent cobalt ions while the two other peaks are correlated with tetrahedral coordination of Co2+ ions. The presence of the dual coordination’s is related to the little variation in the stabilization energies of the two coordination states. Infrared absorption spectra show the appearance of combined triangular and tetrahedral borate groups in their specific wavenumbers at 1200–1600 cm−1 and 800–1200 cm−1 respectively. The presence of fluoride anions brings the formation of suggested tetrahedral (BO3F) groups in the same wavenumber sites as familiar tetrahedral (BO4) groups. Fraction of four coordinated borons was calculated from FTIR Spectra and correlated to UV/Vis measurements.
References
- Optical and μ-FTIR mapping: a new approach for structural evaluation of V2O5-lithium fluoroborate glasses. Mater. Des.. 2016;89:568-572.
- [Google Scholar]
- Optical and FTIR structural studies of CoO-doped sodium borate, sodium silicate and sodium phosphate glasses and effects of gamma irradiation-a comparative study. J. Mol. Struct.. 2014;1074:503-510.
- [Google Scholar]
- Influence of CuO content on the structure of lithium fluoroborate glasses: spectral and gamma irradiation studies. Spectrochim. Acta A. 2015;149:788-792.
- [Google Scholar]
- Bamford C.R., 1997. “Colour Generation and Control in Glasses” Glass Science and Technology, vol. 2, Elsevier, Amsterdam.
- Photocatalyst TiO2–Co: the effect of doping depth profile on methylene blue degradation. J. Mater. Sci.. 2010;45:5698-5703.
- [Google Scholar]
- Thermal and structural properties of Nd2O3-doped calcium boroaluminate glasses. J. Rare Earths. 2016;34:521-528.
- [Google Scholar]
- Ultraviolet transparency of glass: a chemical approach in terms of band theory, polarisability and electronegativity. Phys. Chem. Glasses. 2001;42(5):151-157.
- [Google Scholar]
- UV transmission and radiation-induced defects in phosphate and fluoride–phosphate glasses. J. Non-Cryst. Solids. 2000;263–264:240-250.
- [Google Scholar]
- Optical properties of fluoride glasses: a review. J. Non-Cryst. Solids. 1995;184:9-20.
- [Google Scholar]
- Properties and structure of PbO-PbF2-B2O3 glasses. J. Appl. Phys.. 1989;66:1127-1131.
- [Google Scholar]
- Investigation of spectral absorption and elastic moduli of lithium haloborate glasses. Phys. Status Solidi A. 2003;198:7-17.
- [Google Scholar]
- The photoluminescence, optical and physical properties of Sm3+-doped lithium yttrium borate glasses. Phys. Chem. Glasses. 2016;57:85-89.
- [Google Scholar]
- The luminescence and structure of novel transparent oxyfluoride glass-ceramics. J. Non-Cryst. Solids. 1998;239:149-155.
- [Google Scholar]
- Structure and properties of mixed phosphate and fluoride glasses. Phys. Chem. Glasses. 2005;46(2):67-71.
- [Google Scholar]
- Influence of ligand coordination of cobalt ions on structural properties of ZnO–ZnF2–B2O3 glass system by means of spectroscopic studies. Phys. B. 2012;407:712-719.
- [Google Scholar]
- Conservation of Glass. London: Butterworths; 1989.
- Chemistry of Glasses (second ed.). New York: Elsevier; 1990.
- Transport and spectroscopic properties of nickel ions in ZnO–B2O3–P2O5 glass system. Optik – Int. J. Light Electron Optics. 2016;127:2920-2923.
- [Google Scholar]
- Anomalous elastic behaviour of xSrO-10PbO-(90-x)B2O3 glass system. J. Non-Cryst. Solids. 2016;444:55-63.
- [Google Scholar]
- Properties and structure of NaF–Na2O–B2O3 glasses. Phys. Chem. Glasses. 1990;31:25-31.
- [Google Scholar]
- Sigel G.H., 1997. In: Tomozawa M., Doremus R.H. (Eds.), in Treatise in Materials Science and Technology, vol. 12, Academic Press, San Diego, CA, pp. 5–50.
- Effect of Iron on Ultraviolet Absorption of High Purity Soda-Silica Glass. Glass Tech.. 1968;9:66.
- [Google Scholar]
- Ionic conductivity, dielectric and optical properties of lithium lead borophosphate glasses combined with manganese ions. J. Alloy. Compd.. 2016;663:708.
- [Google Scholar]
- Optical and luminescence properties of Li2O–Gd2O3–MO–B2O3–Sm2O3 (MO = Bi2O3, BaO) glasses. J. Alloy. Compd.. 2016;676:275-285.
- [Google Scholar]
- Investigation of luminescence and laser transition of Dy3+ in Li2O–Gd2O3–Bi2O3–B2O3 glasses. Opt. Mater.. 2016;55:136.
- [Google Scholar]


