

Translate this page into:
The combined effect of nitrogen and biochar amendments on the yield and glucosinolate contents of the Chinese cabbage
⁎Corresponding authors. ok5382@cnu.ac.kr (Taek-Keun Oh), mhyoon@cnu.ac.kr (Min-Ho Yoon)
-
Received: ,
Accepted: ,
This article was originally published by Elsevier and was migrated to Scientific Scholar after the change of Publisher.
Peer review under responsibility of King Saud University.
Abstract
Nitrogen plays an important role in plant growth as an essential nutrient. When crops are grown on biochar applied soil, their growth be positive affected. Biochar has been announced as a soil amendment to improve nitrogen (N) use efficiency. The present study aimed to investigate the combined effect of nitrogen fertilizer and biochar amendment on the growth of Chinese cabbage including its glucosinolates (GSLs) functional compounds. Acidic (AB), neutral (NB) and basic (BB) biochars produced at 330 °C, 400 °C and at 600 °C, respectively were employed in the study with each of them applied to the soil at a rate of 1% (w/w). N fertilizer in form of urea was split applied to the soil at three different rates of 160, 320, 640 kg ha−1. The Chinese cabbage yield was highest in the 320 kg ha−1 nitrogen amendment and all the biochar amendments decreased yield in comparison to the 320 kg ha−1 nitrogen amendment. The Chinese cabbage yield in the biochar amended soils increased with increasing amount of nitrogen applied to the soil. The GSLs content was highest in the Chinese cabbage grown on the 320 kg ha−1 N amendment in all the treatments. Except, BB, biochar amendments generally produced Chinese cabbage with higher GSLs content than the urea only amendment.
Keywords
Biochar
Chinese cabbage
Glucosinolate
HPLC analysis
Nitrogen fertilizer

1 Introduction
Chinese cabbage (Brassica rapa L. ssp. pekinensis) is one of the Brassica vegetables, very important as ingredient of kimchi, which is mainly used in Korea (Cartea et al., 2011; Cho et al., 1999). Chinese cabbage has several classes of secondary metabolites such as glucosinolates (GSLs), carotenoids and other phytochemicals. Their compositions and contents were depended on the genotype and agricultural factors (Podsedek et al., 2007; Reif et al., 2013; Chun et al., 2017; Cuong et al., 2017). In particular, interest in the study of GSLs is increasing, because of its health-promoting effects (Axelsson et al., 2017). GSLs are converted to isothiocyanates, thiocyanates, or nitriles by enzymatic hydrolysis with myrosinase and responsible for the flavor, pathogen defense system, anticarcinogenic, and other pharmacological effects (Mithen et al., 2000; Seo et al., 2014;). GSLs were classified as aliphatic, indolic, aromatic contributing with their amino acid precursor methionine, tryptophan, and phenylalanine respectively (Fahey et al., 2001; Lee et al., 2016; Arasu et al., 2017; Kwak et al., 2017). Because GSLs are nitrogen-(N) and sulfur-(S) containing secondary metabolites derived from amino acids, their metabolism in vegetables is influenced by the N and S fertilization and also by the balance between them (Falk et al., 2007; Kim et al., 2015; Kim et al., 2016; Groenbaek et al., 2016; Jeon et al., 2017).
In soil-crop system, N fertilizer is the most widely used fertilizer and the primary source. However, either shortage or excess of N fertilizer can result in low product quality, the amount of N fertilizer rates should be carefully determined (Bergman, 1986; Li et al., 2017; Park et al., 2016a,b,c). Insufficient supply of N results in lower yields and smaller vegetable heads, while excess of this mineral nutrient leads to a high concentration of nitrates in the heads (Magnusson, 2002; Wang & Li, 2004; Min et al., 2015). Chinese cabbage is particularly an N fertilizer demanding crop (Vavrina and Obreza, 1993; Park et al., 2017a; Park et al., 2017b).
Rice is the most consumed crop in Korea and cultivated in many countries. As a result, more than 160 million tons of rice hulls are produced around the world annually. Effective recycling of rice hulls is important to solve the problem of agricultural waste (Park et al., 2017; Ebe et al., 2019). There are many advantages of converting these rice hull to biochar such as energy production carbon sequestration, improvement of soil quality, and enhancement of crop yields (Abrishamkesh et al., 2015). Biochar has been proven to increase crop productivity, soil structure and nutrient adsorption. In particular, biochar has been found to alter soil N dynamics and water availability affecting N uptake by plants and plant growth and nutritional status (Fiorentino et al., 2019; Liu et al., 2017; Park et al., 2018). However, little information is available about how biochar could affect plant secondary metabolism (Viger et al., 2015).
The objective of this study was to assess the combined effect of biochar and nitrogen fertilization on the Chinese cabbage yield and its GSL contents.
2 Materials and methods
2.1 Preparation and analysis of the soil and biochar
The study was conducted through a field experiment that was set up at Chungnam National University experimental farm, located at the Daejeon, Korea (latitude, 127°35’E; longitude, 36˚36́N). The soil at the farm is a sandy loam and belongs to the Inceptisol and Udepts order and suborder, respectively according to the IUSS working group WRB classification (Table 1). Soil pH and EC were determined in water by paying strict adherence to the method outlined by Benchtop Meter (ORION™ Versa Star Pro™, Thermo Scientific Inc., Waltham, Massachusetts, USA). The soil cations were determined with ICP-OES (ICAP 7000 series ICP spectrometer, Thermo Scientific Inc., Waltham, Massachusetts, USA) after extraction from the soil with 1.0 M neutral ammonium acetate solution (pH 7.0). Total carbon and nitrogen were assessed with the CHN Elemental Analyzer (TruSpec Micro, Leco, Michigan, USA). Both total and available phosphorus were determined by UV/Vis-spectrophotometer (GENESYS 50, Thermo Scientific Inc., Waltham, Massachusetts, USA) using a Lancaster method (RDA, 1988). Abbreviations: D·H2O, Distilled water; EC, Electrical Conductivity; Av. P2O5, Available Phosphate; T-C, Total Carbon; T-N, Total Nitrogen.
Treatment
pH
EC
Av. P2O5
T-C
T-N
Ca2+
K+
Mg2+
Na+
(1:5, D.W)
(ds m−1)
(mg kg−1)
(%)
(cmolc kg−1)
Initial soil
7.0 ± 0.2
0.35 ± 0.05
94.10 ± 21.08
0.71 ± 0.19
0.11 ± 0.05
4.50 ± 0.21
0.21 ± 0.03
1.24 ± 0.11
0.17 ± 0.00
The biochar used in the study was purchased from Purnnature (Suncheon, Korea) and Yoogi Lnd (Gochang, Korea) and was prepared by charring rice hull, a readily available agricultural waste in South Korea, at different temperatures of 330 °C, 400 °C and 550 °C. The biochars produced at 330 °C were acidic while those produced at 400 °C and 550 °C were neutral and basic, respectively. The pH and EC were determined by Benchtop Meter with pH and EC (ORION™ Versa Star Pro™, Thermo Scientific Inc., Waltham, Massachusetts, USA) in distilled water at a ratio 1:5 (w/w) and stirring for 1 h. The total carbon and nitrogen were assessed with the CHN elemental analyzer (LECO, TruSpec, USA). The total phosphorus was determined by Vanadate method (Tandon et al., 1968) and UV/Vis-spectrophotometer (GENESYS 50, Thermo Scientific Inc., Waltham, Massachusetts, USA). The concentration of cations in the biochar was quantified by ICP-OES ICAP 7000series ICP spectrometer, Thermo Scientific Inc., Waltham, Massachusetts, USA). The properties of biochar obtained from the analysis are given in Table 2. Abbreviations: Temp., Temperature; D·H2O, Distilled water; EC, Electrical Conductivity; T-C, Total Carbon; T-N, Total Nitrogen; T-P2O5, Total Phosphate.
Treatment
Temp.(°C)
Time (min)
pH (1:10, D.W)
EC (dS m−1)
T-C (%)
T-N
T-P2O5
CaO
K2O
MgO
Na2O
Biochar
330
15
6.1
11.49 ± 1.62
41.3 ± 0.0
0.4 ± 0.0
0.14 ± 0.03
0.09 ± 0.03
0.36 ± 0.12
0.04 ± 0.02
0.03 ± 0.01
400
15
7.1
9.50 ± 0.83
44.1 ± 0.0
0.4 ± 0.0
0.06 ± 0.01
0.08 ± 0.02
0.47 ± 0.07
0.04 ± 0.02
0.03 ± 0.01
600
30
11.0
6.59 ± 0.13
54.9 ± 0.2
0.6 ± 0.0
0.21 ± 0.00
0.16 ± 0.05
0.78 ± 0.29
0.07 ± 0.04
0.04 ± 0.01
2.2 Experimental set up and crop management
The study was set up in a completely randomized design and each treatment was replicated thrice. Each replicate was set up on a 3 m × 2.5 m plot which translates to an area of 7.5 m2. The protection bands, 1 m in width, were left to prevent the contamination of the plots with fertilizers from the neighboring sectors. The Chinese cabbage variety grown was ‘Chunkwang’ which was purchased from SAKATA KOREA (Seoul, Korea) and the spacing adopted was 0.4 m within the plants rows. Each plot was planted with only one row of Chinese cabbage. The study was laid out with twelve treatments which included the following; Nitrogen fertilizer applied at the recommended rate (1.0 N), nitrogen fertilizer applied at half the recommended rate (0.5 N), nitrogen fertilizer applied at double the recommended rate (2.0 N) as well as the combined applications of biochars with nitrogen fertilizers i.e. AB + 1.0 N, AB + 0.5 N, AB + 2.0 N, NB + 1.0 N, NB + 0.5 N, NB + 2.0 N, BB + 1.0 N, BB + 0.5 N and BB + 2.0 N. Biochar was applied to the soil at a rate of 1% (w/w) following the recommendations of the previous study by Oh et al. (2017). Urea, phosphorus pentoxide and potassium oxide were utilized to supply nitrogen, phosphorus and potassium, respectively and for the 1.0 N amendment, the quantities of the nutrients applied were 320, 78 and 198 kg/ha of nitrogen, phosphorus and potassium, respectively. Split application of nitrogen and potassium was adopted where a third of the nutrients were applied at the transplanting stage. The next 1/3rd of the nutrients were applied 15 days after transplanting and the remaining 1/3rd were applied at 30 days after transplanting. The plots were irrigated after each fertilizer application to prevent water stress. The parameters studied included; plant weight, water content, head diameter, head length, leaves diameter, leaves length, chlorophyll (SPAD). The weight of Chinese cabbages was measured after harvest. Plant height was determined by ruler, the three highest leaves were used to measure leaf length and diameter. After cutting the head in half, diameter and length were estimated. The chlorophyll contents of plant were determined by MINOLTA Chlorophyll meter (SPAD-502, Konica Minolta, Tokyo, Japan).
2.3 Glucosinolate analysis using by HPLC
Desulfo (DS) – GSLs were extracted according to the procedure of Chun et al. (2018) and ISO 9167-1 (1992). Freeze-dried plant powders (100 mg) were extracted by 1.5 ml of 70 % (v/v) boiling methanol in water bath at 5 min. After centrifugation at 12,000 rpm for 10 min, the resulting supernatant was collected, and the residues were re-extracted twice by repeating the above mentioned process. The combined supernatant was taken as the crude of GSLs. Separately 0.5 mg of sinigrin (external standard) was dissolved in 5 ml water. Desulfation of the crude extracts and sinigrin were performed on DEAE anion exchange column which was prepared by Sephadex A-25 previously activated with 0.5 M sodium acetate. The crude GSL extracts were loaded into a pre-equilibrated column and rinsed two times with 1 ml of water. 75 µl of Aryl sulfatase solutions (E.C.3.1.6.1) was then loaded into each column. After 16 hrs of desulfation reaction at room temperature, the desulfated GSLs were eluted with 1.5 ml of water. The supernatants were filtered through a 0.45 µm PTFE syringe filter and analyzed by HPLC. GSLs were analyzed by 1260 Infinity HPLC system (Agilent Technologies, CA, USA) equipped with an Inertsil ODS-3 column (150 × 3.0 mm ID, particle size 3 µm) (GL Science, Tokyo, Japan). The HPLC analysis was carried out with a column oven temperature of 40 °C and a wavelength of 227 nm. The solvent system employed was solvent (A) water and (B) 100 % acetonitrile. The gradient elution program was as follows with a flow rate of 0.4 ml/min, 0–2.0 min, 0% B; 2.0–7.0 min, 10% B; 7.0–16 min, 31% B; 16–19 min, 31% B; 19–21 min, 0% B and 21–27 min, 0% B. Individual GSLs were identified with previously data (Chun et al, 2018) and quantified according to their peaks of HPLC area and response factor by comparison to those of an external standard sinigrin solution (ISO 9167-1, 1992; Clarke, 2010).
2.4 Statistical analysis
All the data were subjected to a one-way analysis of variance (ANOVA) using IBM SPSS statistical software (version 26 for Windows, SPPS Inc., Chicago, IL, USA). The significantly different data at P ≤ 0.05 were subjected to the Duncan’s multiple range test to quantify the differences between the different treatments.
3 Results and discussions
3.1 Changes in the chemical characteristics of soil
Chemical properties of soil after experiment were shown in Table 3. The pH and EC of soli are important factors of the nutrient availability of plant. The soil pH of BB + 1.0 N amendment was the highest value (pH 7.8). In all biochar amendments were increased to compare with initial soil and urea fertilizer only treatments. The pH of soils tended to decrease as the inorganic fertilizer application (Eo et al., 2016). Shin et al (2019) reported rice hull biochar could be used to improve acid soil effectively increasing soil pH and CEC. Soil EC values has increased by amendments with biochars (Park et al, 2020). But, soil EC values are thought to have no effect by biochar, increasing N tends to increase the EC. Total carbon contents in initial soil were 0.99%, and after the experiment, it decreased in the urea fertilizer only treatments and as the total carbon contents of biochar amendment was increased. The exchangeable cations, Ca2+, Mg2+, K+ and Na+ were increased after treatment with fertilizer and biochar. Abbreviations: EC, Electrical Conductivity; T-C, Total Carbon; T-N, Total Nitrogen; Av. P2O5, Available Phosphate.
Treatment
pH
EC
T-C
T-N
Av. P2O5
Ca2+
K+
Mg2+
Na+
(1:5, H2O)
(dS m−1)
(%)
(mg kg−1)
(cmolc kg−1)
Only urea
0.5 N
7.16 ± 0.36
1.49 ± 1.00
0.61 ± 0.19
0.06 ± 0.02
133.38 ± 13.90
4.59 ± 0.10
0.23 ± 0.04
1.86 ± 0.55
0.28 ± 0.12
1.0 N
6.80 ± 0.17
2.25 ± 0.58
0.66 ± 0.13
0.09 ± 0.03
117.40 ± 57.31
4.62 ± 0.05
0.77 ± 0.45
1.51 ± 0.17
0.20 ± 0.01
2.0 N
6.59 ± 0.18
2.33 ± 1.07
0.74 ± 0.18
0.11 ± 0.03
122.74 ± 19.97
4.09 ± 0.30
0.94 ± 0.08
1.48 ± 0.18
0.22 ± 0.02
Acidic Biochar
0.5 N
7.19 ± 0.18
0.52 ± 0.09
1.03 ± 0.12
0.07 ± 0.02
140.69 ± 39.79
4.60 ± 0.13
0.63 ± 0.52
1.74 ± 0.12
0.21 ± 0.06
1.0 N
7.09 ± 0.49
1.15 ± 0.34
1.19 ± 0.06
0.08 ± 0.02
159.69 ± 29.63
4.93 ± 1.05
0.73 ± 0.38
1.76 ± 0.29
0.22 ± 0.04
2.0 N
7.22 ± 0.43
1.90 ± 0.97
1.44 ± 0.17
0.10 ± 0.03
112.08 ± 21.34
4.90 ± 0.37
0.58 ± 0.04
1.59 ± 0.08
0.22 ± 0.01
Neutral Biochar
0.5 N
7.26 ± 0.22
1.62 ± 0.65
1.64 ± 0.37
0.07 ± 0.01
107.99 ± 27.98
5.54 ± 0.57
0.41 ± 0.09
1.72 ± 0.03
0.20 ± 0.00
1.0 N
7.04 ± 0.36
2.05 ± 0.74
1.78 ± 0.68
0.08 ± 0.01
140.56 ± 21.74
4.66 ± 0.21
1.27 ± 0.73
1.55 ± 0.25
0.22 ± 0.04
2.0 N
7.13 ± 0.69
2.33 ± 1.01
2.26 ± 0.49
0.10 ± 0.01
143.44 ± 56.80
4.76 ± 0.52
1.13 ± 0.94
1.45 ± 0.08
0.25 ± 0.09
Basic Biochar
0.5 N
7.45 ± 0.21
0.87 ± 0.16
3.69 ± 0.58
0.10 ± 0.01
113.42 ± 6.23
5.33 ± 0.07
0.32 ± 0.04
1.65 ± 0.02
0.19 ± 0.02
1.0 N
7.84 ± 0.22
0.53 ± 0.04
4.06 ± 1.23
0.12 ± 0.03
154.40 ± 54.19
5.01 ± 0.34
1.51 ± 0.75
1.58 ± 0.11
0.27 ± 0.06
2.0 N
7.24 ± 0.64
1.41 ± 0.48
4.76 ± 1.44
0.11 ± 0.02
137.17 ± 34.87
4.57 ± 0.55
0.40 ± 0.16
1.37 ± 0.08
0.20 ± 0.02
3.2 Effects of the different treatment on yield
The comparative effects of the different amounts of nitrogen fertilizer on Chinese cabbage growth and different rice hull biochar amendments were assessed and the result are shown in Table 4. While the 1.0 N amendment produced higher yields than the 2.0 N treatment, there was no statistical significance difference between the yield produced with the recommended and the double rates of nitrogen treatments, but applying nitrogen at half the recommended rate reduced yield. Lee et al (2012) reported that there was no significant difference in the yield when plants were grown with different levels of nitrogen fertilizer. And also, Staugaitis et al (2008) investigated that lower nitrogen rates the yield decreased and the Chinese cabbage heads were smaller and the yield was lower. Similarly, in our study the recommended and the double rates of nitrogen treatments produced well in the width and length of the leaves and heads, and the chlorophyll contents of the leaves increased. Within each column, values followed by the same letters are not significantly different at p < 0.05, using Duncan’s multiple-range test (n = 3).
Treatment
Head
Leaf
Chlorophyll
Water contents
Fresh weight
Height
Width
Length
Width
(g)
(mm)
(mm)
(SPAD)
(%)
Only urea
0.5 N
3077.3 ± 138.4b
87.7 ± 0.7ab
143.0 ± 2.9bc
332.6 ± 4.6avc
230.2 ± 6.7ab
36.2 ± 0.1d
87.7 ± 0.7ab
1.0 N
3859.3 ± 110.0a
87.7 ± 2.9ab
168.7 ± 3.7a
333.9 ± 21.7abc
228.1 ± 17.8abc
39.2 ± 4.0 cd
87.7 ± 2.9ab
2.0 N
3635.3 ± 419.4a
86.8 ± 1.1abc
153.3 ± 10.9b
348.1 ± 9.4ab
249.0 ± 13.3a
41.7 ± 3.7bcd
86.8 ± 1.1abc
Acidic Biochar
0.5 N
1943.2 ± 41.8e
84.0 ± 0.4c
111.7 ± 4.8f
315.2 ± 7.6c
193.9 ± 3.0d
36.2 ± 1.0d
84.0 ± 0.4c
1.0 N
2572.7 ± 36.0c
86.1 ± 1.4abc
127.3 ± 5.4 cd
322.3 ± 14.8bc
210.0 ± 12.2abc
40.9 ± 0.9bcd
86.1 ± 1.4abc
2.0 N
2473.5 ± 83.4 cd
85.6 ± 2.0bc
126.0 ± 7.1de
319.2 ± 10.6c
207.3 ± 6.1abc
48.6 ± 4.7a
85.6 ± 2.0bc
Neutral Biochar
0.5 N
2210.7 ± 203.0de
85.4 ± 1.1bc
127.7 ± 6.3 cd
323.2 ± 12.3bc
203.8 ± 5.9 cd
38.1 ± 2.5d
85.4 ± 1.1bc
1.0 N
2777.3 ± 73.1bc
86.6 ± 0.9abc
130.9 ± 12.0 cd
332.7 ± 19.6abc
211.6 ± 16.8abc
39.3 ± 2.4 cd
86.6 ± 0.9abc
2.0 N
2846.5 ± 84.1bc
86.6 ± 1.1abc
141.3 ± 6.8bcd
342.8 ± 7.9abc
225.6 ± 10.2abc
46.0 ± 1.5ab
86.6 ± 1.1abc
Basic Biochar
0.5 N
2634.1 ± 130.7c
86.2 ± 2.1abc
129.2 ± 7.8 cd
326.3 ± 10.6bc
200.1 ± 7.7d
36.1 ± 1.2d
86.2 ± 2.1abc
1.0 N
3628.5 ± 153.1a
89.1 ± 0.3a
151.7 ± 1.7b
357.2 ± 5.5a
243.7 ± 5.5a
40.3 ± 2.8bcd
89.1 ± 0.3a
2.0 N
3647.3 ± 134.5a
85.1 ± 1.2bc
15.7 ± 7.1ab
360.8 ± 6.1a
244.9 ± 9.9a
44.8 ± 2.5abc
85.1 ± 1.2bc
To confirm the effectiveness of biochar amendment in growing Chinese cabbage, a comparison to urea fertilizer only treatments was performed and it was found that the Chinese cabbage yield was reduced in acidic and neutral biochar treatments whereas there were no statistical significant differences between the urea fertilizer only and basic biochar treatments. Biochar has generally a very high pH and contains nutrient elements. These elements could be used for plant nutrition. However, only in few plant growth trials the nutrients presented in biochar were taken into account when it was used as a growing medium (Prasad et al., 2020). Numerous papers have evaluated biochar’s positive effects on plant growth but, few authors have reported negative effects (Woo, 2013, Lee et al., 2018).
3.3 Glucosinolates profile and contents
GLSs content in the Chinese cabbage leaves was quantified and the results are shown Table 5. Six aliphatic GSLs including progoitrin, sinigrin, glucoalyssin, gluconapoleiferin, gluconapin and glucobrassicanapin, three indolyl GSLs including glucobrassicin, 4-methoxyglucobrassicin and neoglucobrassicin as well as one aromatic GSLs (gluconasturtiin) were identified based on the HPLC chromatogram. Each of the peaks and retention time coincided with those reported in Chun et al (2018). In Chinese cabbage leaves, a statistically significant increase in total GSLs were observed in biochar treatment compared to the urea only treatment except for BB as shown in Fig. 1. The aliphatic GSL contents were increased in all biochar treatments, however, in the case of sinigrin, known as a functional component, there was no statistically significant difference. Indolic GSLs containing glucobrassicin were increased significantly in the NB treatment. Indole-3-carbinol is a phytochemical that is derived from the breakdown of the glucobrassicin. It has been reported to contain diverse promising biological properties, with anti-atherogenic, antioxidant, anti-carcinogenic, and anti-inflammatory activities by Kim and Park (2018). The contents of aromatic GSL, gluconasturtiin which is precursor of phenethyl isothiocyanate with efficient therapeutic properties (Soundararajan and Kim, 2018; Thwe et al., 2016) was increased in the biochar treatments. Garcia-Ibañez et al. (2020) reported that the biochar amendments enhanced the GSLs concentration in broccoli. In our study, NB and AB amended soils produced the Chinese cabbage with the highest contents of GSL (Table 6). No., the elution order of glucosinolates from HPLC chromatograms in Fig. 2. Within each column, values followed by the same letters are not significantly different at p < 0.05, using Duncan’s multiple-range test (n = 3). Abbreviations: GSL, Glucosinolate; PRO, Progoitrin; SIN, Sinigrin; GAL, Glucoalyssin; GNP, Gluconapoleiferin; GNA, Gluconapin; GBN, Glucobrassicanapin; GBS, Glucobrassicin; 4-MGBS, 4-Methoxyglucobrassicin; NGBS, Neoglucobrassicin; GNST, Gluconasturtiin.
No.
Retention time
Trivial name
Chemical name
Structure of R group
Compound group
Response factor
1
9.11
Progoitrin
2-Hydroxy-3-butenyl-
CH2=CH-CH(OH)-CH2-
Aliphatic
1.09
2
9.87
Sinigrin
2-Propenyl-
CH2=CH-CH2-
Aliphatic
1.00
3
10.76
Glucoalyssin
5-Methylsulfinylpentyl-
CH3-SO-CH2-CH2-CH2-CH2-CH2-
Aliphatic
1.07
4
11.13
Gluconapoleiferin
2-Hydroxy-4-pentenyl-
CH2=CH-CH2-CH(OH)-CH2-
Aliphatic
1.00
5
12.42
Gluconapin
But-3-enyl-
CH2=CH-CH2-CH2-
Aliphatic
1.11
6
14.72
Glucobrassicanapin
Pent-4-enyl-
CH2=CH-CH2-CH2-CH2-
Aliphatic
1.15
7
15.86
Glucobrassicin
Indol-3-ylmethyl-
Indole-3-CH2-
Indolic
0.29
8
16.77
4-Methoxyglucobrassicin
4-Methoxy-indol-3-ylmethyl-
Indole-4-OCH3-
Indolic
0.25
9
17.15
Gluconasturtiin
2-Phenylethyl-
C6H5-CH2-CH2-
Aromatic
0.95
10
18.91
Neoglucobrassicin
1-Methoxy-indol-3-ylmethyl-
Indole-1-OCH3-
Indolic
0.25
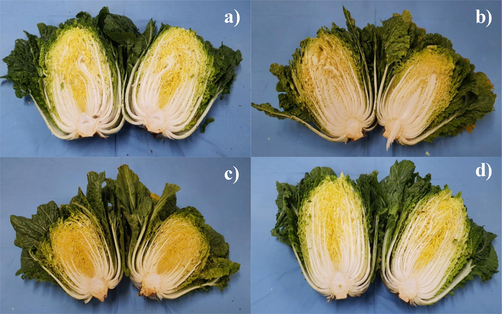
Chinese cabbage by biochar treatment. a), Only urea; b), Acidic Biochar; c), Neutral Biochar; d), Basic Biochar.
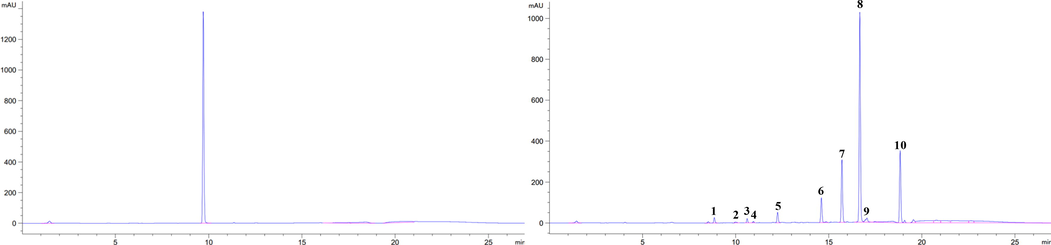
HPLC chromatogram of sinigrin standard and Glucosinolate in Chinese cabbage.
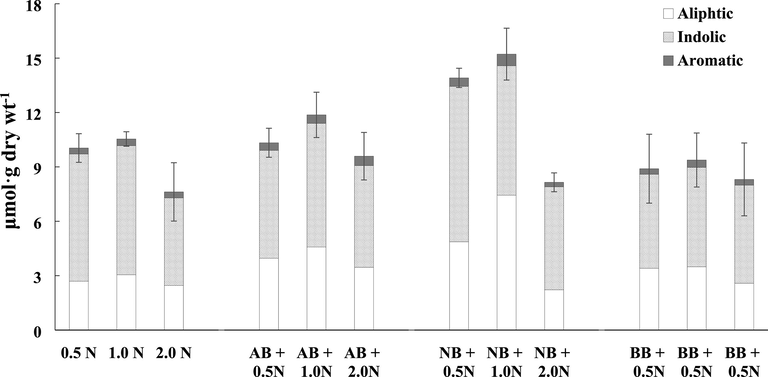
Glucosinolate portions divided into three groups in Chinese cabbage. Within each column, values followed by the same letters are not significantly different at p < 0.05, using Duncan’s multiple-range test (n = 3). Abbreviations: N, Nitrogen fertilizer; AB, Acidic Biochar; NB, Neutral Biochar; BB, Basic Biochar.
Treatment
Aliphatic GSL
Indolic GSL
Aromatic GSL
Total
PRO
SIN
GAL
GNP
GNA
GBN
GBS
4-MGBS
NGBS
GNST
Only urea
0.5 N
0.41 ± 0.08bc
0.12 ± 0.02a
0.32 ± 0.03bc
0.17 ± 0.07a
0.43 ± 0.09d
1.23 ± 0.19d
1.86 ± 0.20ab
3.35 ± 0.36ab
1.82 ± 0.30bcd
0.33 ± 0.07bcd
10.04 ± 0.79cde
1.0 N
0.33 ± 0.08bcde
0.09 ± 0.02a
0.22 ± 0.08bc
0.09 ± 0.02bcd
0.64 ± 0.19d
1.66 ± 0.43bcd
1.24 ± 0.16 cd
3.95 ± 0.12a
1.92 ± 0.83abc
0.37 ± 0.16bcd
10.54 ± 0.40 cd
2.0 N
0.22 ± 0.09e
0.11 ± 0.03a
0.29 ± 0.08bc
0.06 ± 0.01 cd
0.57 ± 0.21d
1.21 ± 0.30d
0.91 ± 0.40d
3.00 ± 0.44ab
0.92 ± 0.14de
0.33 ± 0.07bcd
7.63 ± 1.61d
Acidic Biochar
0.5 N
0.44 ± 0.05b
0.06 ± 0.03a
0.32 ± 0.04bc
0.12 ± 0.02abc
0.93 ± 0.05bcd
2.11 ± 0.13bcd
1.04 ± 0.18d
3.49 ± 0.34ab
1.42 ± 0.20bcde
0.42 ± 0.05bcd
10.33 ± 0.80 cd
1.0 N
0.43 ± 0.05b
0.08 ± 0.01a
0.43 ± 0.20bc
0.10 ± 0.01bcd
1.21 ± 0.34bc
2.33 ± .50bc
1.40 ± 0.21bcd
3.62 ± 0.62ab
1.80 ± 0.63bcd
0.47 ± 0.03bcd
11.87 ± 1.25bc
2.0 N
0.40 ± 0.09bcd
0.10 ± 0.06a
0.55 ± 0.51ab
0.10 ± 0.02bcd
0.78 ± 0.16 cd
1.53 ± 0.28bcd
1.03 ± 0.15d
3.04 ± 0.91ab
1.54 ± 0.48bcde
0.52 ± 0.15ab
9.59 ± 1.31cde
Neutral Biochar
0.5 N
0.43 ± 0.11bc
0.07 ± 0.05a
0.37 ± 0.07bc
0.07 ± 0.04 cd
1.36 ± 0.71b
2.56 ± 1.29b
2.04 ± 0.77a
3.79 ± 0.36ab
2.75 ± 0.64a
0.47 ± 0.15abc
13.91 ± 0.53ab
1.0 N
0.61 ± 0.10a
0.08 ± 0.02a
0.79 ± 0.18a
0.11 ± 0.01bc
2.05 ± 0.24a
3.80 ± 0.57a
1.68 ± 0.43abc
3.35 ± 0.71ab
2.11 ± 0.81ab
0.64 ± 0.11a
15.22 ± 1.43a
2.0 N
0.26 ± 0.06cde
0.11 ± 0.02a
0.18 ± 0.04c
0.06 ± 0.04 cd
0.50 ± 0.30d
1.10 ± 0.37d
1.20 ± 0.07 cd
2.63 ± 0.67b
1.85 ± 0.48abcd
0.25 ± 0.03d
8.16 ± 0.52 cd
Basic Biochar
0.5 N
0.48 ± 0.18ab
0.07 ± 0.08a
0.33 ± 0.19bc
0.14 ± 0.05ab
0.72 ± 0.37 cd
1.66 ± 0.74bcd
1.16 ± 0.16 cd
2.93 ± 0.36ab
1.10 ± 0.33cde
0.31 ± 0.13 cd
8.90 ± 1.90 cd.
1.0 N
0.36 ± 0.07bcde
0.10 ± 0.07a
0.25 ± 0.05bc
0.09 ± 0.02bcd
0.84 ± 0.10bcd
1.85 ± 0.37bcd
0.99 ± 0.11d
3.66 ± 0.54ab
0.83 ± 0.21e
0.41 ± 0.09bcd
9.39 ± 1.49 cd
2.0 N
0.24 ± 0.04de
0.09 ± 0.02a
0.28 ± 0.03bc
0.04 ± 0.04d
0.61 ± 0.13d
1.33 ± 0.38 cd
0.92 ± 0.37d
3.73 ± 1.06ab
0.76 ± 0.30e
0.32 ± 0.09bcd
8.30 ± 2.01 cd
The GSL contents were the highest in all treatments that were fertilized with nitrogen at a recommended rate of 320 kg ha−1, followed by half and double the recommended rates of nitrogen application. Chen et al (2006) and Li et al (2007) reported that increasing N tends to decrease the total GSL contents in Brassica crops. Generally, the content of GSLs and the bitter taste have a significant relationship with the degradation products. Above all, the amount of gluconapin and glucobrassicanapin in B. rapa is related to the bitterness (Padilla et al., 2007). Their content accounted for approximately 73% of the aliphatic GSL contents, and the tendency to increase and decrease due to nitrogen fertilizers was similar to that of the total and aliphatic GSLs. The indolic GSLs tended to decrease with increasing nitrogen application, while the aromatic GSL contents did not exhibit any relationship to the rates of nitrogen applied to the soil (Fig. 3).
4 Conclusions
Chinese cabbage is an important ingredient in the diet of Koreans. Strategy of improving its productivity and quality is important. This study was conducted to explore the optimal nitrogen fertilization regimes in order to increase productivity and quality of the Chinese cabbage with or without biochar amendments. The results revealed that the yield was applying nitrogen at half the recommended rate negatively impacted yield while doubling the recommended nitrogen rate had no significant effect on yield in comparison with the recommended nitrogen. Additionally, acidic and neutral biochar amendments had negative impacts on the Chinese cabbage yields while the basic biochars didn’t have any impact on yield in comparison with the recommended nitrogen rate. The GSL content, known as the functional ingredient in brassica vegetables, was highest in the recommended rate of nitrogen treatments, and decreased as nitrogen input increased. When treated with neutral biochars, the amount of GSL, including glucobrassicin and gluconsturtiin, which have anticancer effects, increased. The effects of biochar amendment on soil physico-chmical properties, alters soil nutrition dynamic including nitrogen and have agronomic benefits. According to this study, biochar and nitrogen fertilizer can be effectively used to improve the quality and yield of Chinese cabbage.
Acknowledgement
This study was supported by Chungnam National University (2019-2020).
Declaration of Competing Interest
The authors declare that they have no known competing financial interests or personal relationships that could have appeared to influence the work reported in this paper.
References
- Effects of rice husk biochar application on the properties of alkaline soil and lentil growth. Plant Soil Environ.. 2015;61:475-482.
- [Google Scholar]
- Variation of glucosinolates on position orders of flower buds in turnip rape (Brassica rapa) Saudi J. Biol. Sci.. 2017;24(7):1562-1566.
- [Google Scholar]
- Sulforaphane reduces hepatic glucose production and improves glucose control in patients with type 2 diabetes. Sci. Transl. Med.. 2017;9:1-12.
- [Google Scholar]
- Glyoxylate induced changes in the carbon and nitrogen metabolism of the cyanobacterium Anabaena cylindrical. Plant Physiol.. 1986;80(3):698-701.
- [Google Scholar]
- Effect of nitrogen and sulfur supply on glucosinolates in Brassica campestris spp. chinensis. Agric. Sci. China. 2006;5:603-608.
- [Google Scholar]
- In vitro anticancer effect of chinese cabbage kimchi fractions. J. Korean Soc. Food Sci. Nutr.. 1999;28(6):1326-1331.
- [Google Scholar]
- Molecular characterization of glucosinolates and carotenoid biosynthetic genes in Chinese cabbage (Brassica rapa L. ssp. pekinensis) Saudi J Biol. Sci.. 2018;25(1):71-82.
- [Google Scholar]
- Combined effect of nitrogen, phosphorus and potassium fertilizers on the contents of glucosinolates in rocket salad (Eruca sativa Mill.) Saudi J. Biol. Sci.. 2017;24:436-443.
- [Google Scholar]
- Medically important carotenoids from Momordica charantia and their gene expressions in different organs. Saudi J. Biol. Sci.. 2017;24:1913-1919.
- [Google Scholar]
- Promotion of lipopeptide antibiotic production by Bacillus sp. IA in the presence of rice husk biochar. J. Pest. Sci.. 2019;44(1):33-40.
- [Google Scholar]
- Effect of Continuous use of Inorganic Fertilizer on the Soil Organisms and Food Chain. Korean Journal of Environmental Agriculture. 2016;35(1):39-45.
- [CrossRef] [Google Scholar]
- The chemical diversity and distribution of glucosinolates and isothiocyanates among plants. Phytochemistry. 2001;56(1):5-51.
- [Google Scholar]
- The effect of sulfur nutrition on plant glucosinolate content: physiology and molecular mechanisms. Plant Biol.. 2007;9(5):573-581.
- [Google Scholar]
- Interactive priming of soil N transformations from combining biochar and urea inputs: A 15N isotope tracer study. Soil Biol. Biochem.. 2019;131:166-175.
- [Google Scholar]
- Olive tree pruning derived biochar increases glucosinolate concentrations in broccoli. Sci. Horticult.. 2020;267:109329.
- [Google Scholar]
- Nitrogen split dose fertilization, plant age and frost effects on phytochemical content and sensory properties of curly kale (Brassica oleracea L. var. sabellica) Food Chem.. 2016;197:530-538.
- [Google Scholar]
- International Standards Organization (ISO). 1992. Rapeseed: Determination of glucosinolates content – Part 1: Method using High performance liquid chromatography. ISO 9167-1:1992 (E). pp. 1–9. Geneva, Switzerland.
- De novo transcriptome analysis and glucosinolate profiling in watercress (Nasturtium officinale R. Br.) BMC Genomics. 2017;18(1):401.
- [Google Scholar]
- Current results on the biological and pharmacological activities of Indole-3-carbinol. EXCLI J.. 2018;17:181-185.
- [Google Scholar]
- Variation of aminoacid contents of pale green purple Kohlrabis (Brassica oleracea var. gongylodes) Asian J. Chem.. 2015;27(7):2675-2677.
- [Google Scholar]
- Metabolomics of differently colored Gladiolus cultivars. Appl. Biol. Chem.. 2016;59(4):597-607.
- [Google Scholar]
- Variation of quercetin glycoside derivatives in three onion (Allium cepa L.) varieties. Saudi J. Biol. Sci.. 2017;24(6):1387-1391.
- [Google Scholar]
- Effect of different types of biochar on the growth of Chinese cabbage (Brassica chinensis) Kor. J. Agric. Sci.. 2018;45(2):197-203.
- [Google Scholar]
- Prediction of Chinese cabbage yield as affected by planting date and nitrogen fertilization for spring production. J. Bio-Environ. Control.. 2012;21(3):271-275.
- [Google Scholar]
- LED lights enhance metabolites and antioxidants in Chinese cabbage and kale. Braz. Arch. Biol. Technol.. 2016;59(0):e16150546.
- [Google Scholar]
- Glucosinolate concentration in turnip (Brassica rapa ssp. rapifera L.) roots as affected by nitrogen and sulfur supply. J. Agric. Food. Chem.. 2007;55(21):8452-8457.
- [Google Scholar]
- Ethephon-induced phenylpropanoid accumulation and related gene expression in tartary buckwheat (Fagopyrum tataricum (L.) Gaertn.) hairy root. Biotechnol. Biotechnol. Equip.. 2017;31(2):304-311.
- [Google Scholar]
- Biochar particle size, shape, and porosity act together to influence soil water properties. PLoS ONE 2017:1-19.
- [Google Scholar]
- Mineral fertilizers and green mulch in Chinese cabbage [Brassica pekinensis (Lour.) Rupr.]: effect on nutrient uptake, yield and internal tipburn. Soil Plant Sci.. 2002;52:25-35.
- [Google Scholar]
- Identification and quantification of quercetin glycosides present in different color onions (Allium cepa L.) Res. J. Biotechnol.. 2015;10(9)
- [Google Scholar]
- Review: The nutritional significance, biosynthesis and bioavailability of glucosinolates in human foods. J. Sci. Food Agric.. 2000;80:967-984.
- [Google Scholar]
- Effect of biochar application on growth of Chinese cabbage (Brassica chinensis) Korean J. Agric. Sci.. 2017;44(3):359-365.
- [Google Scholar]
- Variation of glucosinolates in vegetable crops of Brassica rapa. Photochemistry.. 2007;68(4):536-545.
- [Google Scholar]
- Metabolic profiling of pale green and purple kohlrabi (Brassica oleracea var. gongylodes) Appl. Biol. Chem.. 2017;60(3):249-257.
- [Google Scholar]
- Park C.H., Shicheng Zhao, Hyeon Ji Yee, Ye Eun Park, Thanislas Bastin Baska, Arasu M.V., Naif Abdullah Al-Dhabi, Sang Un Park. 2017b. Comparison of different strains of agrobacterium rhizogenes for hairy root induction and betulin and betulinic acid production in Morus alba. Nat. Prod. Commun. 12(4), 479–482.
- Evaluation of ammonia (NH3) emissions from soil amended with rice hull biochar. Korean J. Agric. Sci.. 2020;47(4):1049-1056.
- [Google Scholar]
- Effect of different proportion of sulphur treatments on the contents of glucosinolate in kale (Brassica oleracea var. acephala) commonly consumed in Republic of Korea. Saudi J. Biol. Sci.. 2018;25:349-353.
- [Google Scholar]
- Transcriptome and metabolome analysis in shoot and root of Valeriana fauriei. BMC Genomics. 2016;17(1)
- [CrossRef] [Google Scholar]
- Park C.H., Thanislas Bastin Baskar, Soo-Yun Park, Sun-Ju Kim, Arasu M.V., Naif Abdullah Al-Dhabi, Jae Kwang Kim, Sang Un Park. 2016b. Metabolic profiling and antioxidant assay of metabolites from three radish cultivars (Raphanus sativus). Molecules. 21: 157.
- Park,CH., Aye Aye Thwe, Sun Ju Kim, Jong Seo Park, Arasu M.V., Naif Abdullah Al-Dhabi, Nam Il Pank, Sang Un Park. 2016a. Effect of auxins on anthocyanin accumulation in hairy root cultures of tartary buckwheat cultivar Hokkao T10. Nat. Prod. Commun. 11(9): 1283-1286.
- Plant nutrient availability and pH of biochars and their fractions, with the possible use as a component in a growing media. Agronomy. 2020;10:10.
- [Google Scholar]
- Lutein and β-carotene content of green leafy Brassica species grown under different conditions. LWT-Food Sci. Technol.. 2013;53(1):378-381.
- [Google Scholar]
- Methods of Soil Chemical Analysis. RDA, Suwon: National Institute of Agricultural Science and Technology; 1988.
- Phenylalanine and LED lights enhance phenolic compound production in Tartary buckwheat sprouts. Food Chem.. 2014;177(15):204-213.
- [Google Scholar]
- Acidic soil improvement and physicochemical characteristics using red-mud and biochar. J. Korean Soc. Environ. Eng.. 2019;41(9):483-493.
- [Google Scholar]
- Anti-carcinogenic glucosinolates in cruciferous vegetables and their antagonistic effects on prevention of cancers. Molecules. 2018;23(11):2983.
- [Google Scholar]
- Optimization of application of nitrogen fertilizers to increase the yield and improve the quality of Chinese cabbage heads. Acta Agric. Scand. Sect. B - Soil Plant Sci.. 2008;58(2):176-181.
- [Google Scholar]
- An acid-free vanadate-molybdate reagent for the determination of total phosphorus in soils. Soil Sci. Soc. Am. Proc.. 1968;32(1):48-51.
- [Google Scholar]
- Effect of different Agrobacterium rhizogenes strains on hairy root induction and phenylpropanoid biosynthesis in tartary buckwheat (Fagopyrum tataricum Gaertn) Front. Microbiol.. 2016;7:318.
- [Google Scholar]
- Response of Chinese cabbage to nitrogen rate and source in sequential Planthins. Hort. Sci.. 1993;28(12):1164-1165.
- [Google Scholar]
- More plant growth but less plant defence? First global gene expression data for plants grown in soil amended with biochar. Glob. Change Biol.. 2015;7(4):658-672.
- [Google Scholar]
- Effects of nitrogen and phosphorus fertilization on plant growth and nitrate accumulation in vegetables. J. Plant Nutr.. 2004;27(3):539-556.
- [Google Scholar]


