

Translate this page into:
Temperature-based prediction and validation of pink bollworm, Pectinophora gossypiella infestation on cotton crop
⁎Corresponding author. drsabir.agri@mckru.edu.pk (Sabir Hussain)
-
Received: ,
Accepted: ,
This article was originally published by Elsevier and was migrated to Scientific Scholar after the change of Publisher.
Peer review under responsibility of King Saud University.
Abstract
Pink bollworm Pectinophora gossypiella infestation on cotton now a days found to be a major alarm to cotton crop in Pakistan. The effect of past and future temperatures climatic factors on the infestation rate of pink bollworm needs to be extensively studied. Field visits were organized in different areas across 17 main districts of Punjab, Pakistan, for eight consecutive years from 2012 to 2019. Based on past data, the pink bollworm infestation rate for the year 2040 was estimated. Our results showed an extensive infestation of pink bollworm on cotton throughout the visited locations between 0.1 and 35.7 % range above the economic threshold level, that cause reasonable cotton productivity losses. Based on the results of historical data of infestation rate, the nine of the 17 districts (53 %), Bahawalnagar, Bahawalpur, Faisalabad, Jahang, Mianwali, Multan, Muzaffargarh, Rahimyar Khan, and Lodhran, showed significantly (p < 0.05) higher pink bollworm infestation rate than the other cotton-growing areas. Moreover, the systematic increase level of pink bollworm infestation was predicted in 2040, especially in the five districts, Bhakar, Jahang, Khanewal, Faisalabad, and Vehari. Considering the importance of biological parameters, different temperature regimes (21 °C, 28 °C, and 35 °C) were tested for the validity of temperature-based prediction. Our results showed that growth capacity of P. gossypiella were increased at 28 °C. It revealed that, variation in weather due to current climatic condition with decreases of temperature increases P. gossypiella infestation on cotton crop. In this investigation, the effects of a severe outbreak of pink bollworm infections in Punjab's cotton-growing regions are discussed.
Keywords
Pink bollworm
Infestation
Prediction
Climatic variables
Life tables parameters

1 Introduction
Pakistan exhibit position fourth in cotton productivity and third in cotton consumption across the globe and approximately 2 % of economy of country rely on cotton crop (Bakhsh et al., 2009; Sial et al., 2015). In Pakistan, cotton is cultivated on 2,527 thousand hectares with average productivity of 9.178 million bales during 2019–20 (Economical Survey of Pakistan, 2020). But this crop was continuously infested by insect's pests during seedling to harvesting. Every year cotton insects can cause about 15–20 % economic damage, sometime reach 80 % in Pakistan (Shah et al., 2022). Thus, the management of cotton insects pests is vital for the optimum growth of cotton, which help to produce more than 900,000 tons of cotton every year (CUI Jin-jie, 2007).
The pink bollworm (PBW) Pectinophora gossypiella (Saunders) (Lepidoptera: Gelechidae) has achieved a status of upcoming pandemic for cotton production in Pakistan. Before the use of insecticides and the introduction of the Bt cotton hybrid, this pest reduced Pakistan's cotton crop's output by 20 % to 90 %. (G.M. cotton) (Ghramh et al., 2022). The Bt cotton cultivation started by Pakistan in 2002, followed by a radical transformation of cotton cultivation (Shuli et al., 2018). Bt cotton provided better control of bollworm in start as stated by researcher previously (Sankaranarayanan et al., 2010). But, in the current farmers field situation showed the serious infestation of PBW may be due to irregular monsoon rains and increase in temperature.
There are many factors which hinders the production of cotton mainly abiotic and biotic stresses (Shuli et al., 2018). Climatic factors variations may increase or decrease any insect population in the field. Abrupt change in weather conditions may be the constant progression of pests in such a way that make pests adaptive current prevailing conditions, which severely affected the cotton productivity in term of quantity and quality (KongMing, 2009). Arthropod occurrence is significantly influenced by temperature and relative humidity under climatic conditions, thus it is crucial to understand how they respond to variations in temperature and relative humidity in order to modify pest management strategies as a result of climate change (Shrestha, 2019). It seems that climate change induces host plant resistance against diseases and pests and also pest population corelate with the climatic variations (Sankaranarayanan et al., 2010). The resistance level may be decreased due to rapid diseases life cycles and changing physiological behaviors of insects. Therefore, exploring connection among insects pests and climatic variables is important to produce environment based forecasting models and may be improve the long duration prediction of pests (Xiao et al., 2019).
Being able to forecast pest levels and interpret the dynamics of pest infestations is a difficult task because a variety of factors affect pest abundance (Li et al., 2012; Yonow et al., 2004; ZALUCKI and FURLONG, 2005). Insecticide budgets, crop scout hiring, and strategic crop planting decisions could all be aided by timely forecasts. A severe attack of PBW observed in the Punjab cotton grown areas district for many years in Pakistan. We have hypothesized that temperature and relative humidity affect the PBW infestation. For this purpose, we have used past and future temperature and relative humidity climatic variables to predict the PBW infestation in Punjab Pakistan. To validate the prediction, we have also tested the effect of different temperature regimes on the biological aspects of pink bollworm.
2 Materials and methods
2.1 Study sites and sampling plan of PBW infestation
The farmers areas were visited in intensive cotton-growing areas of 17 Punjab districts; Bahawalnagar, Bahawalpur, Bhakar, Dera Ghazi Khan, Faisalabad, Jahang, Khanewal, Layyah, Lodhran, Mianwali, Multan, Muzaffargarh, Rajanpur, Rahim Yar Khan, Sahiwal, Toba Tek Singh, and Vehari, during September-December 2012–2019 (Fig. 1).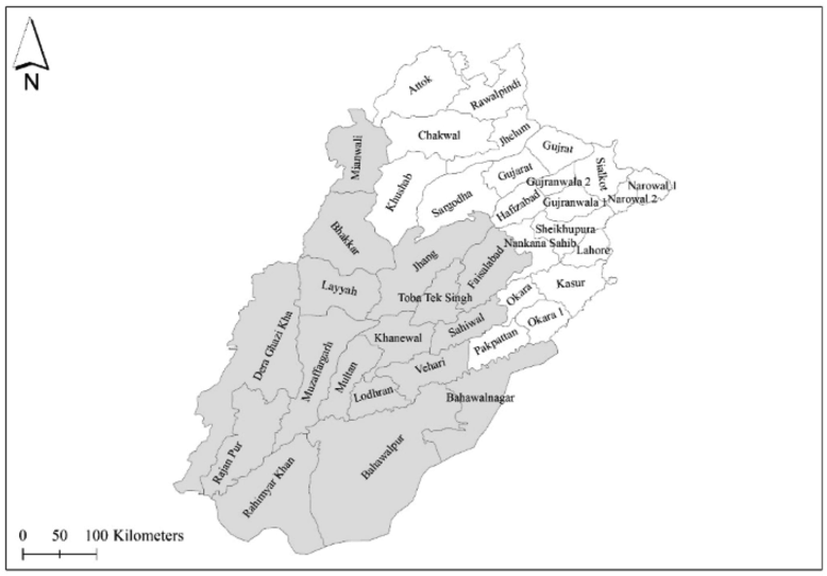
Survey districts where a collection of the samples was conducted from 2012 to 2019. This map was created with ArcGIS v 10.4 (https://www.arcgis.com). Here, grey color represents the survey sites, and white color represents no survey was conducted. Data of administrative boundaries were obtained from (https://gadm.org/download_country_v3.html).
Pink bollworm infestations were collected by ZigZag method of pest scouting from 89 locations of those 17-major cotton-growing districts in Punjab Province at the maximum level of P. gossypiella infestation at stage (100–120 days after sowing) according to green boll maturity boll bursting stages representing PBW larval population at pre–picking and picking stages, respectively. The number of total and infested chosen bolls per plant was counted randomly from a unit area of one acre at each site in every cotton-growing region in order to measure the damage to cotton bolls caused by PBW infestation in a cotton field. A count of the infected bolls was made, and the percent infestation was calculated.
2.2 Identification of PBW
The collected pink bollworm larvae were identified by observing under a stereo microscope for their morphological characters such as shape, size, color (Saunders, 1843). The collected larvae were reared until the adult stage was reached and then correctly identified (Saunders, 1843) and sent to the National Agriculture Research Council Islamabad for further confirmation.
2.3 Modelling procedure
The multiple regression model was used to predict the impact of future climatic conditions on the infestation rate of the pink bollworm attack in different districts of Punjab. For the future climatic conditions, 2040 year was selected, and prevailing future climatic conditions were assessed using the minimum temperature, maximum temperature and relative humidity environmental layers in ArcGIS software. The following modelling formula was used for the assessment of the future impact on our cotton crop.
Here, Y is the future estimated value in 2040; constant is the intercept value, B1, B2, and B3 are the independent factors, whereas X is the different coefficient values.
2.4 Collection and rearing of P. gossypiella
P. gossypiella infested bolls were collected during the cotton season of 2018–2019 from cotton crops randomly from different varieties raised at Cotton Research Institute, Multan (30°8′54.24″ N and 71°26′18.24″ E). The larvae were continuously reared more than 50 generations by feeding on artificial diet (Ali et al., 2020). For the oviposition, the Adults of P. gossypiella were put in cages (50 × 50 × 50 cm) and given 10 % honey solution to increase egg laying. White gauze and filter paper were placed in every cage for egg laying. The eggs which are in clusters form were collected every day during the total oviposition period.
2.5 Experimental setup
P. gossypiella stagewise life steps were tested in cohorts of single life stages at three constant temperatures 21, 28, and 35 °C. The colonies were managed in the controlled incubation chambers with relative humidity and photoperiods 65 ± 5 % and 12:12 L:D, respectively in the laboratory. Prior to the start of experiment, four pairs of mated adult moths were released separately into four plastic containers with white gauze and filter paper for egg laying at the evening. The eggs were counted from the filter paper after the removal of moths at the next morning. To test the effect of temperatures approximately total of 200 eggs which were 12 h old were placed in plastic box inside the growth chambers. This study has four repeats and each repeat with 50 eggs placed on different filter paper. Hatchability was recorded daily for each test of temperature.
For larval development study, each test of temperature was studied with around 100 larvae in a group of 25 (<12 h old) released on artificial diets in a plastic box (45 × 20 cm size). Development time, mortality of larvae, and number of successful pupal development were calculated at each set of constant temperatures with three repeats. Similarly for pupal durations, 100 newly formed pupae (∼12 h old) were separated from the reared colony and placed in the groups of 25 pupae into four different plastic boxes (15 × 10 cm size) inside the chambers for each test of constant temperatures. Emergence of adults from pupae and pupal durations were calculated every day for each test of constant temperatures. To test the oviposition rate of new emerged adults at different set of test temperatures, 10 pairs (∼12 h old) of P. gossypiella from stock colony were placed in plastic jar (30 × 15 cm size). For egg laying adults moths were given feeding of 10 % honey. Moths were moved to new oviposition boxes each day, and the number of eggs laid in each box were counted to determine each female's overall fecundity. Each adult male and female's longevity was measured at its appropriate test temperature. To ensure optimal mating and fertility, new male adults were offered to the females in the appropriate cages in the event that older male adults passed away.
2.6 Parameters/data collection
Data regarding hatching period, hatching percentage, duration of larval instars, rates of adult eclosion, consumption rate, male: female, fecundity, intrinsic rate of increase, survival rate, etc. were collected. Detail of the dependent variable/ data collected is given as following:
The age-specific survival rate (lx) and age-specific fecundity (mx) were calculated as:
Where, k exhibits the number of stages.
The net reproductive rate (R0) was computed as:
The intrinsic rate of increase (r) with age indexed from 0 was corrected by the Euler-Lotka equation:
The following equation was used for the finite rate of increase (λ):
The mean generation time was demonstrated as
The life expectancy (exj) was determined as:
Where, siy shows the probability of survival of each individual of age × and stage j to age i and stage y by assuming sxj = 1.
The reproductive rate (vxj) was assessed according to (Li et al., 2012).
2.7 Statistical analysis
The collected data was analyzed by using Age-Stage, Two-Sex Life Table Analysis (Copyright 1997–2021 Hsin Chi Version: 2017.09.01) for further analysis. The impacts of host plants on larval feeding rate and life history characters of P. gossypiella were evaluated by using the one-way analysis of variance, (ANOVA). In addition to life table parameters, age-stage specific survival rate sxj (where x = age and j = stage), age specific fecundity mx, age-stage specific fecundity fxj, age-specific maternity lxmx, age-stage specific life expectancy exj, age-stage specific reproductive value vxj, adult pre-oviposition period APOP, and total pre-ovipositional period TPOP for all temperatures were analyzed on a computer operated TWO SEX-MS Chart software for ecological studies related with life table.
3 Results
3.1 Incidence of pink bollworm in cotton
The pink bollworms were collected from infested bolls from 17 districts in Punjab Province. The results of collecting population infestation during the studied period in cotton-growing areas of Punjab Province indicated a variable rate of infestation by PBW. Our observations of field visits performed during September – December 2012–2019 in cotton cultivated districts disclosed a continuous increase in cotton bolls attacked by P. gossypiella from less to medium to serious (>50 %) above the economic threshold level between cotton boll opening to further at cotton picking (Fig. 2).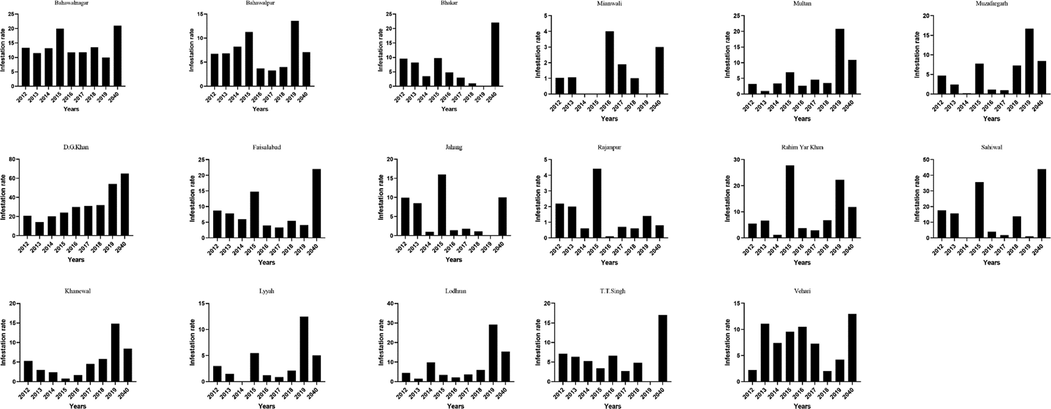
Pink bollworm infestation rate in different years on cotton crop in various districts of Punjab.
From 36 districts of Punjab province, 17 were surveyed, and all were found highly susceptible for the invasion of pink bollworm infestation on the cotton crop (Fig. 2). The PBW infestation rate was found higher in district Bahawalnagar, Rajanpur, Rahimyar Khan, Sahiwal, Vehari, Bahawalpur, Faisalabad, and Jahang during surveys of 90–100 days of crop in 2015 (Fig. 2). The P. gossypiella infestation was observed at flowers and bolls of Bt cotton crop. In 2019, Dera Ghazi Khan cotton fields were highly infested (>50 %) by PBW than the other districts in Punjab Province (Fig. 2).
A subsequent survey of 17 districts showed that the mean green boll infestation above 5 % ETL in the majority of places except in districts Bhakar (in 2018, 2019), Jahang (in 2014, 2016, 2017, 2018, and 2019), Khanewal (in 2013–2016), Layyah (in 2012, 2013, 2014, 2016, 2017, and 2018), Lodhran (in 2012, 2013, 2015–2018), Mianwali (in 2012–2019), Multan (in 2012–2014, 2016–2018), Muzafargarh (in 2012–2014, 2016–2017), Rajanpur (in 2012–2019), Rahimyar Khan (in 2014, 2016, and 2017), Sahiwal (in 2016, 2017, and 2019), T. T. Singh (in 2015, and 2017), and Vehari (in 2012, 2018, and 2019) (Fig. 2).
Pink bollworm was not found in some years of Punjab Province districts such as 2019 in Bhakar, Jhang, Mianwali, and 2014 in Layyah, Mianwali, Muzaffargarh, Sahiwal, and 2015 in Mianwali during the surveys of study periods. The lowest infestation rate of PBW was found in Lodhran, Jhang, Layyah, Mianwali, and Rajanpur.
3.2 Prediction of PBW population
By applying weather parameters in ArcGIS software, we have found that PBW infestation level was varied in all districts of Punjab during the study. In 2012, PBW infestation risk levels were found in Bahawalpur, Rajanpur, and Bhakar Districts (Fig. 3).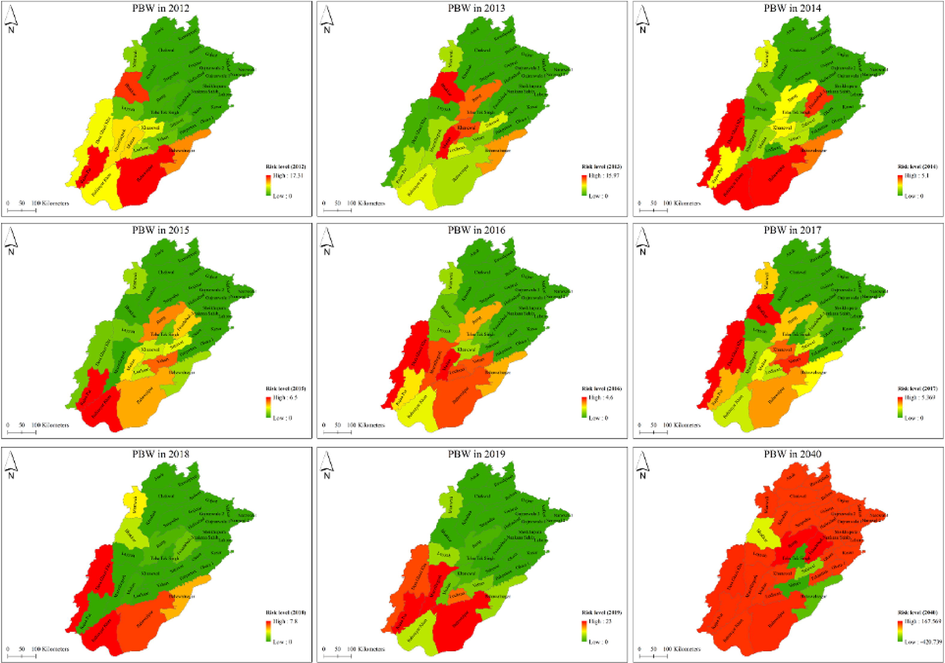
Pink bollworm infestation to different districts of Punjab at different levels. These maps were created with ArcGIS v 10.4 (https://www.arcgis.com). Data of administrative boundaries were obtained from (https://gadm.org/download_country_v3.html).
In 2013, the PBW risk level was slightly decreased in Bahawalpur and Rajanpur, but the high-risk level in Bhakar, Multan, Khanewal, and Jahang. However, the PBW infestation risk level was increased in Punjab Province. More districts such as Bahawalpur, Dera Ghazi Khan, Rahimyar Khan, Bahawalnagar, and Faisalabad were affected in 2014. Subsequently, the medium to high-risk level was observed in some districts of Punjab in 2015, but Rahimyar Khan, and Rajanpur were highly infested by PBW, see Fig. 3. Similarly, in 2016 and 2017, the risk of PBW infestation was increased in surveyed districts of Punjab. However, low medium to high PBW infestation risk levels was found in all main cotton growing areas except the upper Punjab districts of Pakistan. In the 2014 predicted model, PBW infestation was found higher in all districts of Punjab except Bahawalnagar, T. T. Singh, Vehari, and Sahiwal.
3.3 Developmental duration, longevity, and fecundity
The mean hatching time of P. gossypiella has been presented in Table 1. Egg hatching duration was more rapid (2.95 days) followed by rearing at 35 °C and (3.70 days) at 28 °C but was prolonged (7.83 days) at 21 °C. The average egg-to-adult growth time at 21, 28 and 35 °C temperatures was 38.83, 20.90 and 18.13 days respectively. Development periods for the first instar were (5.74, 3.00, 2.59 days), (5.36, 3.15, 3.00 days) for the second, (5.11, 3.03, 2.84 days) for the third, (6.57, 3.31 and 3.16 days) for the fourth larval instars of P. gossypiella were recorded at 21, 28 and 35° C. Pupa completed its growth very rapidly, i.e., within 3.65, 4.90 at 28 and21 °C compared to 8.34 days at 35 °C. Pre-adult period from egg to adult at various temperatures was 38.83, 20.90 and 18.13 days for 21, 28 and 35 °C, respectively. Adult longevity of females was prolonged to 57.05 followed by 39.00 and 31.86 where for male was 49.71, followed by 26.56 and 23.22 days at temperatures of 21, 28 and 35 °C, respectively. Note: Standard errors (SE) were estimated by bootstrapping (10,000 re-samplings). Means within the same row followed by same lowercase letters represent that treatments are not significantly different (p < 0.05) from each other based on paired bootstrap test. L1–L4 indicate first to fourth instars of grubs. x numbers of individual P. gossypiella that completed a stage.
Stage
Developmental Time (Mean ± SE)
nx
21 °C
nx
28 °C
nx
35 °C
Egg
7.83 ± 0.10
3.70 ± 0.11
2.95 ± 0.08
L1
5.74 ± 0.08
3.00 ± 0.13
2.59 ± 0.10
L2
5.36 ± 0.08
3.15 ± 0.12
3.00 ± 0.12
L3
5.11 ± 0.08
3.03 ± 0.11
2.84 ± 0.10
L4
6.57 ± 0.08
3.31 ± 0.09
3.16 ± 0.09
Pupa
8.34 ± 0.11
4.90 ± 0.13
3.65 ± 0.09
Egg to adult longevity
38.83
20.90
18.13
Female
57.05 ± 1.45
39.00 ± 0.27
31.86 ± 0.52
Male
49.71 ± 0.50
26.56 ± 0.50
23.22 ± 0.40
3.4 Comparison of reproductive and life table parameters
The mean adult oviposition period (APOP), Total pre-oviposition period of P. gossypiella have been presented in Table 2. Adult pre-oviposition period (APOP) at 21 °C was (2.94 days) followed by 28 °C (2.64) but was shortened (1.73 days) at 35 °C. Total pre-oviposition period (TPOP) was enhanced (41.47) as compared with 23.55 and 19.68 at 21, 28 and 35 °C, respectively. Oviposition period was 17.00 at 21 °C, 12.32 and 9.41 days at 28 and 35 °C, respectively (Table 2). The average oviposition days of female at 21, 28 and 35 °C temperatures were 17.00, 12.32 and 9.32 days, respectively. Fecundity 24.57, 123.05, 49.82 was observed at 21, 28 and 35 °C temperature, respectively. The intrinsic rate of increase (r), finite rate of increase (λ), net reproductive rate (Ro) and mean generation time (T) are given in Table 2. Rο of P. gossypiella under different temperature regimes was 10.31, 54.14 and 15.36 for 21, 28 and 35 °C, respectively. The longest generation time found was 48.845 d at 21 °C as compared with 29.53 and 24.31 d at 28 and 35 °C. λ has found higher than 1.0 at every test treatment. Note: Standard errors (SE) were estimated by bootstrapping (10,000 re-samplings). Means within the same row followed by same lowercase letters represent that treatments are not significantly different (p < 0.05) from each other based on paired bootstrap test. APOP: adult pre-ovipositional period; TPOP: total pre-ovipositional period (from eclosion of larva to oviposition by the adult); Rο: net reproductive rate; r: intrinsic rate of natural increase; T: mean generation time; λ: finite rate of increase.
Parameters
21 °C
28 °C
35 °C
APOP
2.94 ± 0.23b
2.64 ± 0.15b
1.73 ± 0.15a
TPOP
41.47 ± 0.32b
23.55 ± 0.23a
19.68 ± 0.36a
Oviposition days
17.00 ± 0.31b
12.32 ± 0.36ab
9.41 ± 0.36a
Fecundity (eggs per female)
24.57 ± 2.70a
123.05 ± 1.12c
49.82 ± 1.46b
Rο (offspring individual−1)
10.31 ± 2.04a
54.14 ± 8.63c
15.36 ± 30.60b
T (d)
48.845 ± 0.325c
29.53 ± 0.21b
24.31 ± 0.44a
r(d-1)
0.04736 ± 0.0042a
0.1347 ± 0.0057b
0.1265 ± 0.0071b
λ(d-1)
1.048 ± 0.004a
1.144 ± 0.006a
1.135 ± 0.008a
3.5 Development rates
Development rates (1/developmental time) of P. gossypiella female were regressed against temperature (Table 3). Results revealed that temperature contributed 92.17, 84.51, 66.01, 70.69, 62.99, 99.43, and 84.46 % variation in egg hatching, development of first, second, third, fourth instar larvae, pupa and longevity of adult stage, respectively for P. gossypiella female. The lower developmental threshold of P. gossypiella female for egg, first, second, third, fourth instar larvae, pupa and egg to the adult stage was recorded as 11.72, 8.32, 1.33, 1.79, 6.13, 9.88 and 7.57 °C, respectively. Concerning thermal constant (K), 66.26-degree day units were required for egg hatching, 66.093, 95.41, 89.52, 85.25, 90.86 for first, second, third, fourth larval instar and pupa development. In this way concerning thermal constant (K) 476.19-degree day units were required for P. gossypiella female to complete egg to adult stage. Regression equation depicted that temperature has negative correlation with the developmental stages of P. gossypiella with very minute change in temperature there was 17 % adverse change in egg hatching, 12 % negative effect on of first instar larvae and 10 % on pupal development of pink bollworm. Where y = life stage, x = temperature.
Sex/Stage
Regression Equation
R2
(%)
Lower Developmental Threshold (To, oC)
Thermal Constant (K, Degree days, DD)
Female
Egg
y = −0.1769 + 0.01509x
92.17
11.723
66.26
LI
y = −0.126 + 0.01513x
84.51
8.32783
66.093
L2
y = −0.014 + 0.01048x
66.01
1.33588
95.41
L3
y = −0.02 + 0.01117x
70.69
1.79051
89.52
L4
y = −0.072 + 0.01173x
62.99
6.13811
85.25
Pupa
y = −0.1088 + 0.011005x
99.43
9.88642
90.86
Egg to adult
y = −0.0159 + 0.0021x
84.46
7.57143
476.1905
3.6 Survival rate, life expectancy, and reproductive value
From the detailed age-stage survival rate (Sxj) of PBW for different set of constant temperatures (Fig. 4), the observations showed the prospect of new born P. gossypiella living to age x and stage j. Developmental stages showed significantly difference as seen in curves due to the rate of development varies between individuals at each set of test temperatures. It is observed that age is inversely proportional to the survival rate of individuals for different temperatures treatment. The survival peak was found higher for all PBW life steps at 21 °C with respect to other temperature treatments. The age-specific survival rate (lx), the age-specific fecundity of total population (mx), age-stage specific fecundity (fxj) and the age-specific maternity (lxmx) curves designed at different temperatures shown in Fig. 5.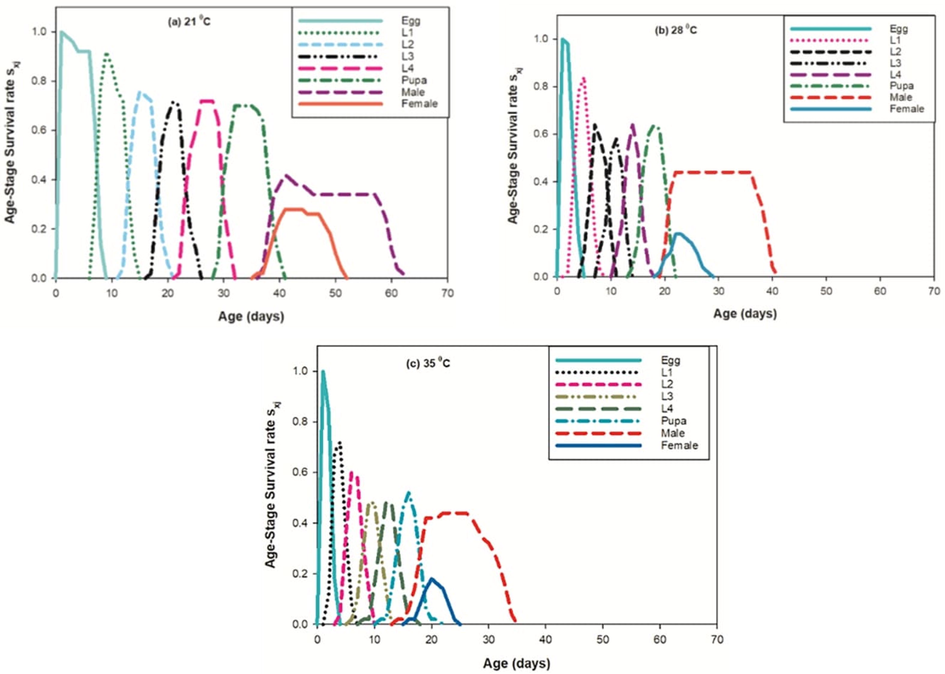
Effect of three different temperatures ((A) 21 °C, (B) 28 °C and (C) 35 °C) on the age stage- specific survival rate (sxj) of the P. gossypiella. L1 = First Instar, L2 = Second Instar, L3 = Third Instar, and L4 = Fourth Instar.
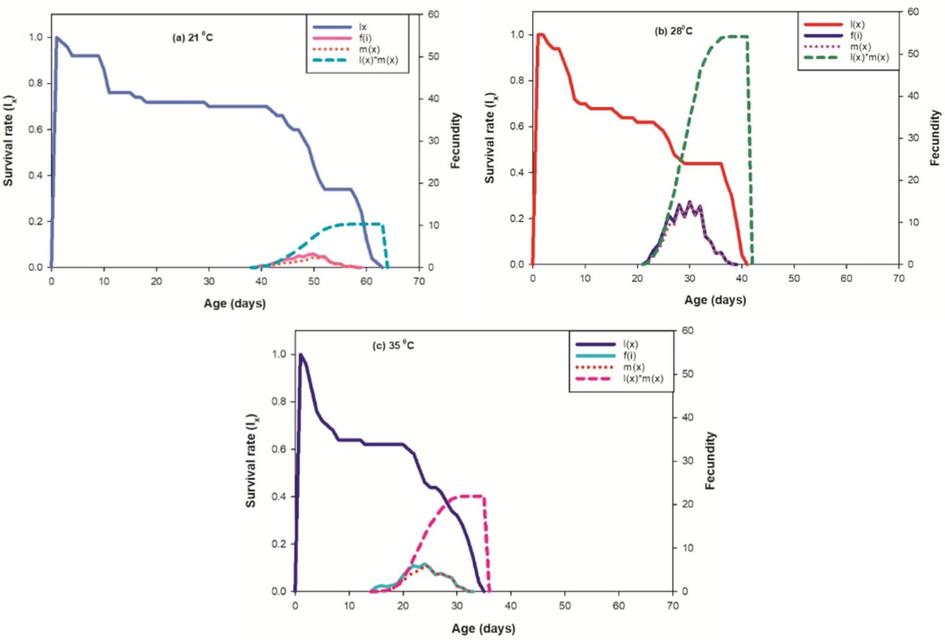
Effect of three different temperatures ((A) 21 °C, (B) 28 °C and (C) 35 °C) on the survival rate (lx), female age-specific fecundity (fx), age-specific fecundity (mx) and age specific maternity.
Basic form of the age-stage survival rate Sxj found to be inversely proportional at 21 °C whereas it was observed direct in proportion to 28 °C and 35 °C as shown in curves. Age-stage specific fecundity (fxj) were observed higher at 21 °C then the 28 °C and 35 °C. The curve of mx shows that reproduction start prior at 35 °C and 28 °C then 21 °C. In our results, the impact of the given set of temperatures on the projected regular life expectancy (exj) of the population at each phase of P. gossypiella (Fig. 6) were observed.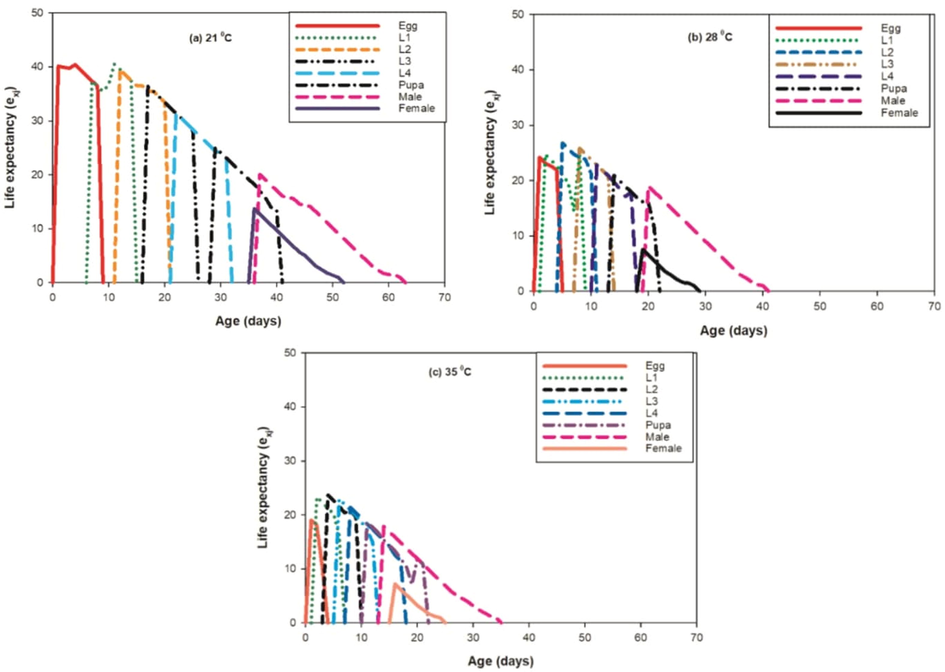
Effect of three different temperatures ((A) 21 °C, (B) 28 °C and (C) 35 °C) on the life expectancy (exj) of the P. gossypiella. L1 = First Instar, L2 = Second Instar, L3 = Third Instar, and L4 = Fourth Instar.
A progress movement of all phases were found at 21 °C with dissimilarity in other developing phases. The age-stage reproductive value (Vxj) defines the portion of an individual of age × and stage j in the direction of the forthcoming population (i.e., the scale of population forecasting). The curves of Vxj were found significantly lower at 28 °C and 35 °C with respect to the 21 °C. But, at 28 °C the female reproductive value was observed higher as compared to the other temperature sets as shown in Fig. 7.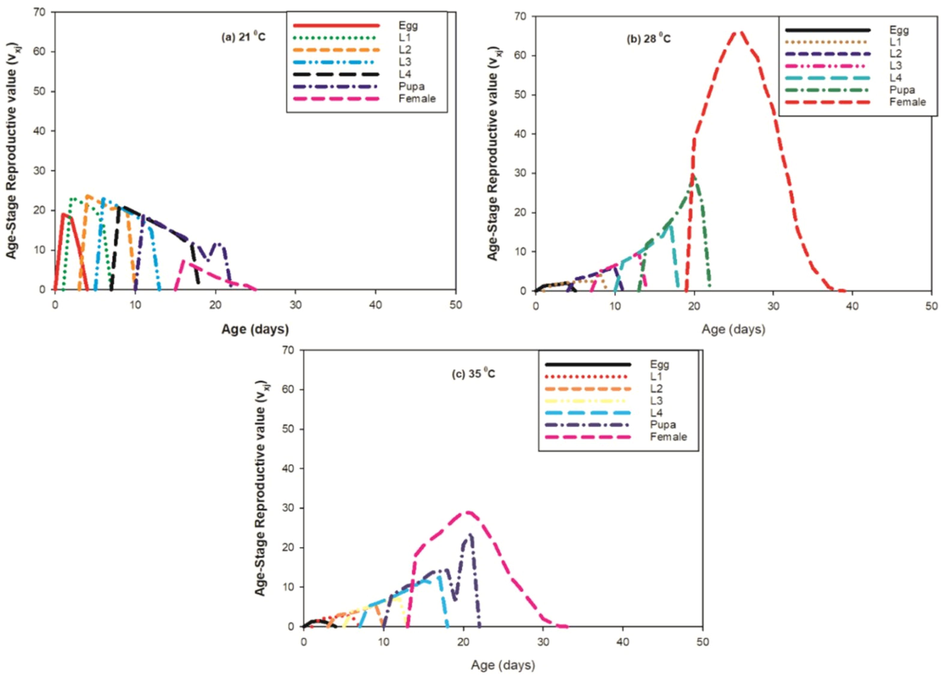
Effect of three different temperatures ((A) 21 °C, (B) 28 °C and (C) 35 °C) on the age-stage reproductive value (vxj) of the P. gossypiella. L1 = First Instar, L2 = Second Instar, L3 = Third Instar, and L4 = Fourth Instar.
4 Discussion
Pink bollworms, which are chewing insect pests, can seriously reduce the value of cotton crops by destroying the cotton fiber. On the basis of in-depth surveys conducted in Punjab's cotton-growing districts, we provide a report on the PBW infestation situation. Surprisingly, the pink bollworm had been found in every location that had been sampled and collected across the Punjab Province's cotton-growing regions. The presence of PBW and the widespread increase in population it has caused throughout the province have caused serious concern for the entire Punjab cotton agrobusiness. Our results revealed that the infestation level of PBW was subsequently increasing by each passing year since 2012. Therefore, the current study has its own worth in this scenario because PBW restarted its epidemic form against even in Bt cotton, the hybrid lines which was developed just for PBW on cotton crop. In this context, we may conclude that, Bt cotton is not performing well to avoid the infestation of PBW. There are possible two reasons, may be Bt varieties are not pure, or PBW attains resistance against B.T. cotton. It seems P. gossypiella has evolved its previous status to become pandemic and also modified its behavior to the wider environmental factors of cotton crop cultivated areas of the Punjab. Because monsoon season provides favor to the PBW population buildup (Pan et al., 2014; Reddy et al., 2015). Due to these temperatures goes down and it seems emergence rate will be increase. This argument will be supported and validated by temperature experiment as shown in Figs. 4, 5, and 6. Therefore, PBW started to spread more quickly in the wider weather conditions of Pakistan, where cotton is cultivated in this report because of their special life cycle, resistance against different pesticides and other biological agents (Wang et al., 2019).
As we know that, P. gossypiella is hard to control. Therefore, with current scenario in Punjab, this cannot be a surprise if PBW proves pandemic like environment in Pakistani Bt cotton due to lack of timely action. Due to poor performance of agricultural department, no such research reports or policy guidelines for the report and highest attack of PBW on Bt Cotton in Pakistan. Therefore, it is quite predicted that the P. gossypiella pest will produced pandemic like infestation in any area of cotton growing in Pakistan. It seems rebirth of P. gossypiella infestation on Bt crop in the country may be non-adoption of refuge strategy. The refuge strategy was the recommendations of Bt crop sowing and cultivation as a part of integrated pet management strategy to reduce resistance of P. gossypiella against Bt cotton (Head and Greenplate, 2012). In Integrated Pest Management Program (IPM), it is compulsory to grown at least 20 % of non-Bt lines with Bt-cotton just to avoid pest resistance (Wan et al., 2017). However, refuge strategy did not practice at farmer level across the country among the Pakistani cotton growers. As a result of non-practicing refuge strategy, and extensive growing of Bt cotton in the country for long time, which put the highest risk of hybrid cotton technology of failure and seem to be main reason for high selection pressure and ultimately evolving the resistance in P. gossypiella against Bt cotton crop. There is one other reason of P. gossypiella against Bt cotton with perhaps little expression levels of Cry toxins because of introduction to sub-lethal dose of toxins. Moreover, due to more heat, scarcity of water, and crop age were found to be impacting cry gene expression in Bt cotton which will reduce toxin levels that further increase the vulnerability of cotton crop to the P. gossypiella (Hilder and Boulter, 1999; Kaiser, 1996; Siddiqui et al., 2019).
Therefore, it is suggested that awareness campaign should be initiated for the stakeholders of cotton crop due to this current situation and its vital to design integrated approaches to combat upcoming worst attack of P. gossypiella. Due to this motive, our study informed, alarming situation of P. gossypiella infestation by visiting and collection of pests at different districts of the cotton growing areas of the Punjab Pakistan. The facts given in current research may be important with greater impact into the proportions of P. gossypiella infestations which further assist to determine the cotton productivity (Fig. 3). Hence, an integrated P. gossypiella management techniques should be implemented with taking all cotton industry partners in confidence. Additionally, the field-based research proposals should be designed to test the Bt levels and P. gossypiella resistance level in cotton growing districts just focus the implementation of regional specific insect pests’ management methodology.
Acknowledgements
The authors extend their appreciations to the Deanship of Scientific Research at King Khalid University Saudi Arabia for funding this work through a Large Groups Project under grant number RGP.2/28/43.
Declaration of Competing Interest
The authors declare that they have no known competing financial interests or personal relationships that could have appeared to influence the work reported in this paper.
References
- Using a two-sex life table tool to calculate the fitness of orius strigicollis as a predator of pectinophora gossypiella. Insects. 2020;11
- [CrossRef] [Google Scholar]
- Insect Resistance and Risk Assessment Studies in Advance Lines of Bt Cotton Harboring Cry1Ac and Cry2A Genes. J. Agric. Environ. Sci.. 2009;6:1-11.
- [Google Scholar]
- Transgenerational effects of lambda-cyhalothrin on Musca domestica L. (Diptera: Muscidae) Sci. Rep.. 2022;12:19228.
- [CrossRef] [Google Scholar]
- The design and implementation of insect resistance management programs for Bt crops. GM Crops Food. 2012;3:144-153.
- [CrossRef] [Google Scholar]
- Genetic engineering of crop plants for insect resistance – a critical review. Crop Protection. 1999;18:177-191.
- [CrossRef] [Google Scholar]
- Advance in integrated pest management of crops in China. Chinese J. Entomol. 2009:831-836.
- [Google Scholar]
- Population Dynamics and “Outbreaks” of Diamondback Moth (Lepidoptera: Plutellidae) in Guangdong Province, China: climate or failure of management? J. Econ. Entomol.. 2012;105:739-752.
- [CrossRef] [Google Scholar]
- Identification of the key weather factors affecting overwintering success of Apolygus lucorum eggs in dead host tree branches. PLoS One. 2014;9:e94190.
- [Google Scholar]
- The seesaw effect of winter temperature change on the recruitment of cotton bollworms <scp>H</scp> elicoverpa armigera through mismatched phenology. Ecol Evol. 2015;5:5652-5661.
- [CrossRef] [Google Scholar]
- Climate change and its impact on cotton (Gossypium sp.) Indian J. Agric. Sci.. 2010;80:561-575.
- [Google Scholar]
- Description of a species of moth destructive to cotton crops in India. Trans. Entomological Soc. London. 1843;3:284.
- [Google Scholar]
- Ovipositional response of Antilochus coquebertii and Dysdercus koenigii in different media under controled conditions. J. King Saud Univ. Sci.. 2022;34
- [CrossRef] [Google Scholar]
- Effects of climate change in agricultural insect pest. Acta Scientific Agric.. 2019;3:74-80.
- [CrossRef] [Google Scholar]
- Overview of the cotton in Pakistan and its future prospects. Pakistan J. Agric. Res.. 2018;31
- [CrossRef] [Google Scholar]
- Performance of different upland cotton varieties under the climatic condition of central zone of Sindh. J. Agric. Environ. Sci. 2015;15:45-47.
- [CrossRef] [Google Scholar]
- Development and evaluation of double gene transgenic cotton lines expressing Cry toxins for protection against chewing insect pests. Sci. Rep.. 2019;9:11774.
- [CrossRef] [Google Scholar]
- Hybridizing transgenic Bt cotton with non-Bt cotton counters resistance in pink bollworm. Proc. Natl. Acad. Sci.. 2017;114:5413-5418.
- [CrossRef] [Google Scholar]
- Pink Bollworm Resistance to Bt Toxin Cry1Ac Associated with an Insertion in Cadherin Exon 20. Toxins (Basel). 2019;11:186.
- [CrossRef] [Google Scholar]
- Occurrence prediction of pests and diseases in cotton on the basis of weather factors by long short term memory network. BMC Bioinformatics. 2019;20:688.
- [CrossRef] [Google Scholar]
- Modelling the population dynamics of the Queensland fruit fly, Bactrocera (Dacus) tryoni: a cohort-based approach incorporating the effects of weather. Ecol. Model.. 2004;173:9-30.
- [CrossRef] [Google Scholar]
- Forecasting Helicoverpa populations in Australia: a comparison of regression based models and a bioclimatic based modelling approach. Insect Sci.. 2005;12:45-56.
- [CrossRef] [Google Scholar]


