

Translate this page into:
Tectonic stress regime and stress patterns from the inversion of earthquake focal mechanisms in NW Himalaya and surrounding regions
⁎Corresponding author at: Dept. of Geology & Geophysics, College of Science, King Saud Univ., P.O. Box 2455, Riyadh 11451, Saudi Arabia. khassanein@ksu.edu.sa (Kamal Abdelrahman)
-
Received: ,
Accepted: ,
This article was originally published by Elsevier and was migrated to Scientific Scholar after the change of Publisher.
Peer review under responsibility of King Saud University.
Abstract
Because the impact of earthquake effects can extend over great distances from their origin, stress field inversion was performed for 440 earthquake focal mechanisms from the northwest Himalayas and surrounding regions compiled from the data bulletins of international seismological institutions. Earthquakes between November 1976 and April 2019 in the depth range of 10–258 km with moment magnitudes between 4.6 and 7.9 were selected. High-quality solutions were inverted to locate the best fitting stress tensor. Most of the earthquake fault plane solutions indicated thrust faulting, confirming northward underthrusting of the Indian plate along the Main Boundary Thrust and the Main Central Thrust systems and eastward underthrusting along the Burmese Arc. The focal mechanisms indicated right-lateral motion along the Karakoram Fault and left-lateral motion along the Kirthar–Sulaiman Range, which agrees with the expected sense of the lateral mass movement of the continental collision model. The present-day stress regimes obtained from the earthquake focal mechanism inversions indicated a predominantly compressional stress regime represented by NNE–SSW trending normal fault mechanisms in northwest India and Nepal and NNW–SSE trending normal fault mechanisms in Pakistan and Hindukush. These are consistent with the direction of the ongoing India–Eurasia plate collision and the extensional stress of WNW–ESE trending thrust faulting in the Xizang and Kashmir regions. These tectonic regimes connected with the major tectonic affecting the Arabian Peninsula. Accordingly, it is highly recommended to assess the earthquake hazards of the major cities in the eastern countries of Arabian Peninsula as Kuwait, Saudi Arabia, United Arab Emirates and Oman.
Keywords
NW Himalaya
ISC
Focal mechanisms
Stress inversion
Win-tensor

1 Introduction
The origin of stress in the Earth’s crust is either tectonic or non-tectonic (Zoback, 1992). The main source of non-tectonic stress is gravitational loading; a vertical stress with a largest lateral variation near the Earth’s surface and becoming more homogeneous with depth. Tectonic stress is mostly horizontal. It originates from forces causing “ridge push” processes, where lithospheric plates are pushed away from a spreading ridge, or “slab pull” processes, the result of plate collision and subduction (Zang and Stephansson, 2010; Vavryčuk, 2015). The types and orientations of activated faults and the slip direction along these faults are important sources of information about stress regimes and their spatial and lateral variations within the Earth’s crust.
Fault plane solutions (FPSs) can be used to determine dominant regional stress regimes. Slip can happen on pre-existing faults, which are oriented differently to the principal stresses. Consequently, FPSs can differ spatially and/or with depth where local and regional stress parameters can strongly fluctuate (Yadav et al., 2009). Similar earthquake mechanisms in an area can signify a major seismogenic structure, while varying mechanisms can indicate deformation in a complex medium.
The northwestern Himalayas and surroundings are seismically active where large earthquakes caused extensive damage. Flinn and Engdahl (1965) suggested the Flinn-Engdahl seismic and geographical regionalization scheme where the investigated area is divided into six seismically active regions (Ali and Shanker, 2016) as NW India, Pakistan, Nepal, Xizang, Kashmir, and Hindukush. The ongoing compression of Indian and Eurasian plates led the NW Himalayas strongly deforming regions. Sequence of thrust faults of Main Frontal Thrust (MFT) to the south, the centrally located Main Karakoram Thrust (MKT), and the Darvas–Karakul and Gissal–Kokshal faults between Hindukush and Pamir (Koulakov and Sobolev, 2006; Yadav et al., 2009), are responsible for the high level of seismic activity in this region (Fig. 1). The rocks in the region are intensely folded and crosscut by NW–SE to EW trending thrust faults, which were initiated during the Cenozoic and Mesozoic (mainly the Jurassic and Cretaceous) (Arora et al., 2012). The strong earthquakes in Himalayas can mostly occurred around the Main Central Thrust (Kumar et al., 2014).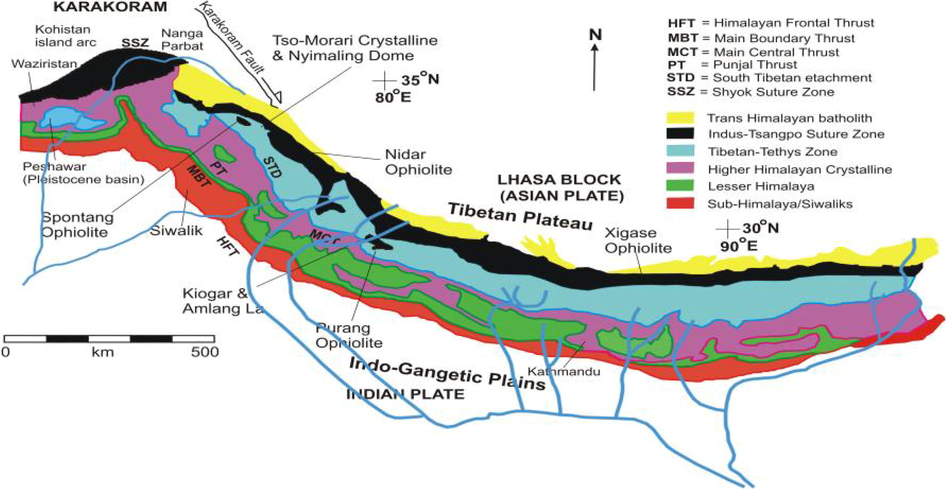
Geotectonic Map of NW Himalaya (after Corfield et al., 2001).
The current study represents not only the extension of the previous studies of tectonic deformation in the NW Himalayan region but also it provides a picture of the stress field responsible for the present-day seismicity and evaluates the stresses orientation according to the earthquake mechanisms available from the international seismological bulletins.
2 Seismic activity and faulting regimes
Anderson (1951) evolved a scheme by associating the relationships between the vertical and horizontal principal stress directions to the faulting type (Table 1). This scheme has proven to be helpful for the determination of the stress regime.
The vertical stress relative to the horizontal stresses
The hanging wall vs the foot wall
Type of faulting
Maximum
The hanging wall is moving downwards with respect to the foot wall.
Normal faulting is observed along a deeply steeping fault.
Minimum
The crust is in horizontal compression and the hanging wall is moving upwards with respect to the foot wall.
Reverse faulting is observed along a shallow dipping fault.
Intermediate
The foot and hanging walls are moving horizontally.
Strike slip faulting is observed along a nearly vertical fault.
The NW Himalayas and surrounding regions were selected for the present study (Fig. 2). The complicated tectonic setting is due to plate collision, north–south convergence along the Himalayan frontal thrusts and the subduction of the Indian plate beneath the Eurasian plate in the Hindukush–Pamir Himalaya region (Billington and Barazangi, 1977; Pegler and Das, 1998). NW India, Nepal, and Kashmir regions tectonics are due to the low-angle subduction of the Indian plate beneath the Eurasian plate, which forms the elevated Himalayan Mountain belt. Seismic activity in these regions is related to the MCT, the Main Boundary Thrust (MBT), and the Himalayan frontal thrusts, north-dipping mega thrusts parallel to the strike of the Himalayan tectonic belt. Seismic activity of southern Pakistan comes from the interactions between the western Indian plate with the southwestern Eurasian plate due to Chaman strike-slip Fault. Seismic activity of northern Pakistan is moderate while shallow and moderate depth (≤50 km) extends along the Salt Range and the Hazara syntaxis. (Bernard et al., 2000). The seismicity of the Xizang region is associated with the Trans-Himalaya region. Its seismic activity is related to strike-slip faulting of Karakoram, Kunlun, and Altyn–Tagh faults. The Hindukush region suffered from shallow to intermediate-depth (10–258 km) earthquakes associated with the subduction of the lithospheric Indian plate beneath the Eurasian plate (Ali and Shanker, 2016).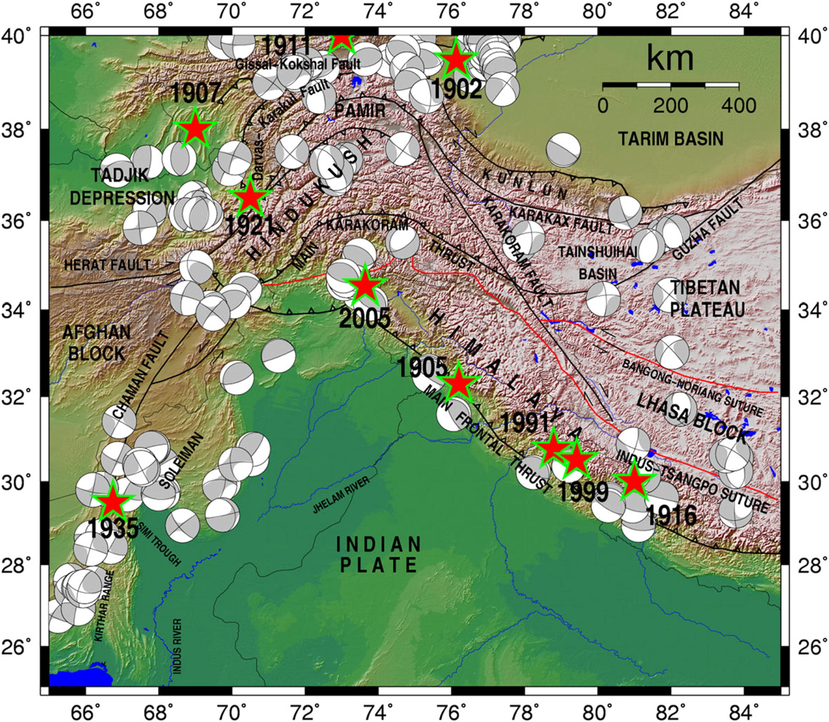
Map showing tectonic and geomorphologic faulting and folding of NW Himalaya and surroundings region (after Koulakov and Sobolev, 2006; Yadav, 2009). Focal mechanism solutions of shallow earthquakes Mw ≥ 5.5 obtained by Harvard GCMT catalogue during 1976–2010 are also shown with gray color beach ball in the map revealing the style of faulting in different parts of the region.
3 Methodologies and data analysis
In the study area, more than 16,000 earthquakes with moment magnitudes (Mw) above 3.0 have been recorded by the USGS National Earthquake Information Centre since 1940 until 2020 (Fig. 3). A catalog of 440 focal mechanisms was compiled from the data bulletins of the International Seismological Centre (ISC), the USGS, the Department of Geological Sciences, Harvard University, and the Lamont Doherty Earth Observatory (GCMT) (Fig. 4) within the latitudes of 25°–40°N and the longitudes of 65°–85°E that had occurred between July 1974 to April 2019 with focal depths of 10–258 km and moment magnitudes of 4.7–7.9. After cross-checking the compiled focal mechanism solutions, high-quality solutions were selected. The FPSs were categorized according to the rake of the slip following Cronin (2004) (see Table 2), and the FPS are listed in Table 3 while P- and T- axes are shown in Fig. 5.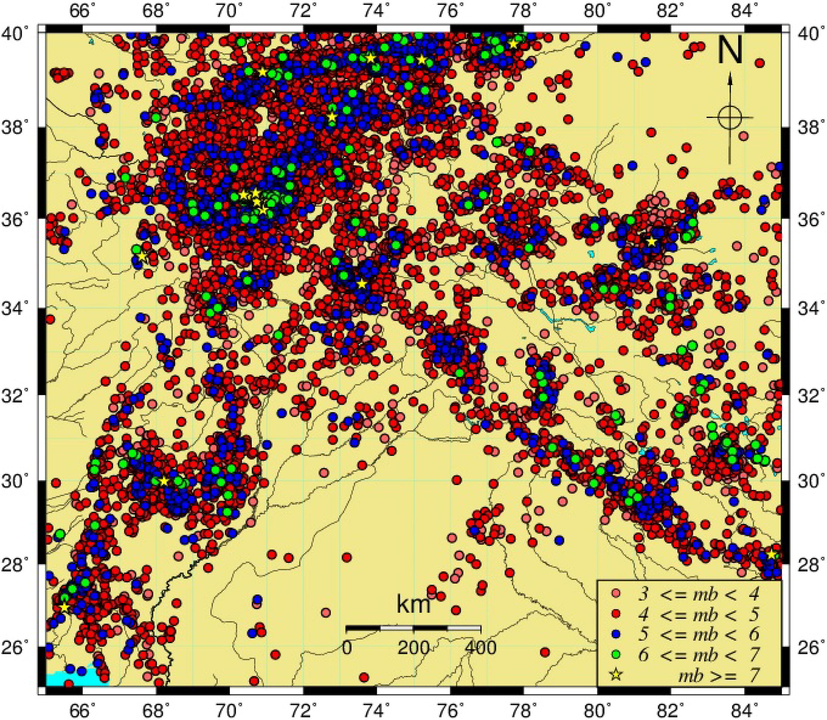
eismic activity recorded by the USGS National Earthquake Information Centre from 1940 to 2020 at the region of the NW Himalaya and surroundings (more than 16,000 events).
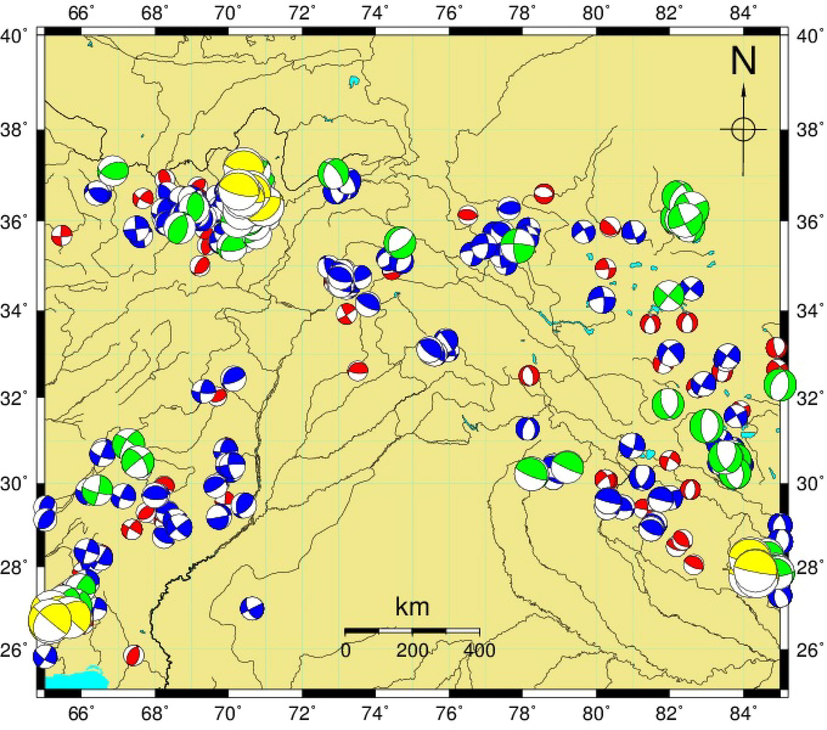
The earthquake focal mechanism distributions at the region of the NW Himalaya and surroundings. The dark and white areas in the beach balls represent compressional and dilatation quadrants, respectively. The Size of the focal sphere is proportional to magnitude. The beach ball colors are equivalent to Fig. 3 magnitude distributions.
Plunge of axes
Faulting type
P axis
T axis
Pl ≥ 52o
Pl ≤ 35o
Normal Faulting [NF]
40° ≤ Pl ≤ 52o
Pl ≤ 20o
Normal Faulting combined with considerable strike-slip component [NS]
Pl ≤ 35o
Pl ≥ 52o
Thrust Faulting [TF]
Pl ≤ 20o
40° ≤ Pl ≤ 52o
Thrust Faulting combined with considerable strike-slip component [TS]
Pl < 40°(and plunge of B axis ≥ 45°)
Pl < 40o
Strike-Slip Faulting [SS]
All P, T and B axes plunge in the range 25°<Pl < 45o
OR Both P and T axes plunge in the range 40° < Pl < 50o
Unclassified type of Faulting [U]
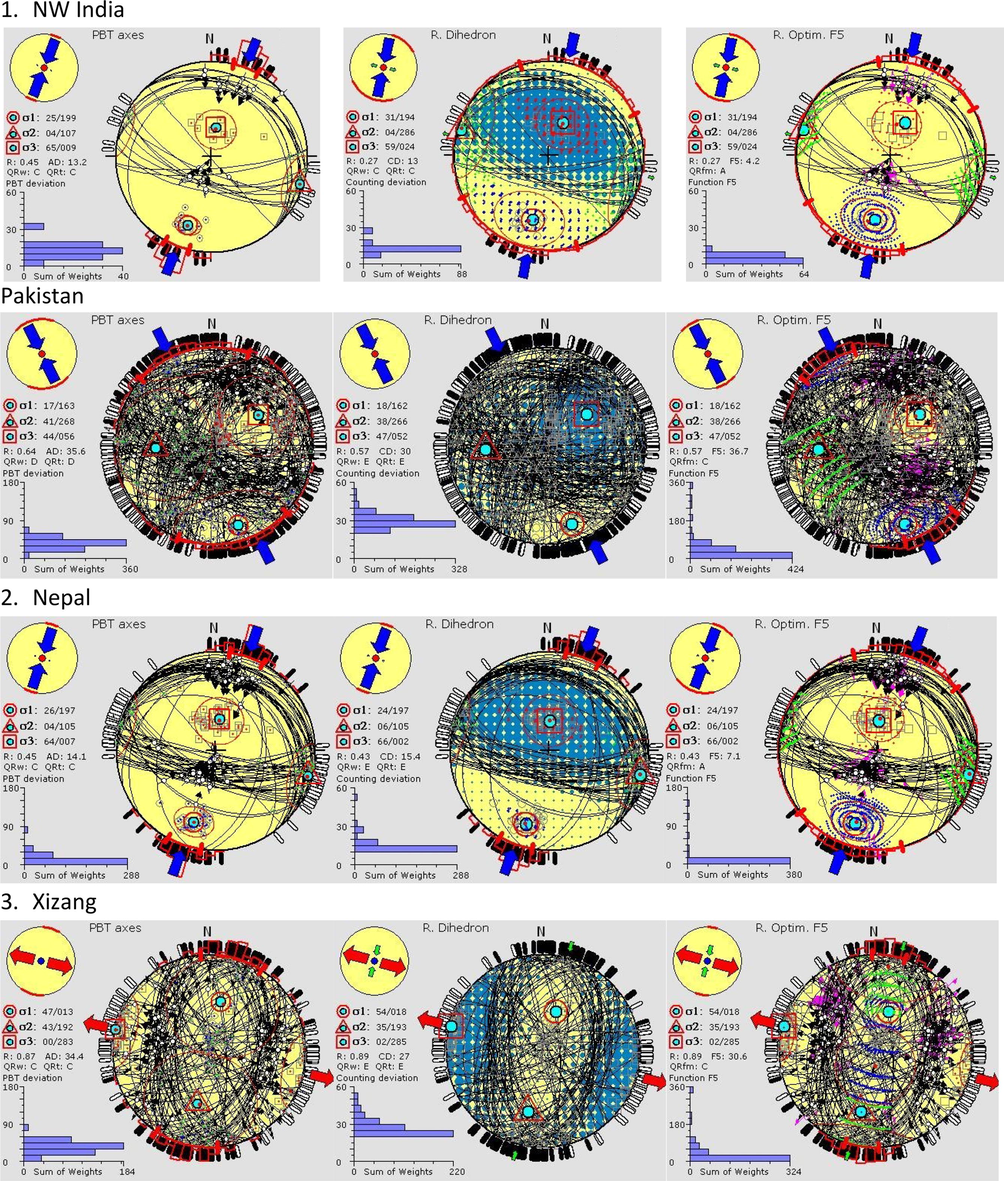
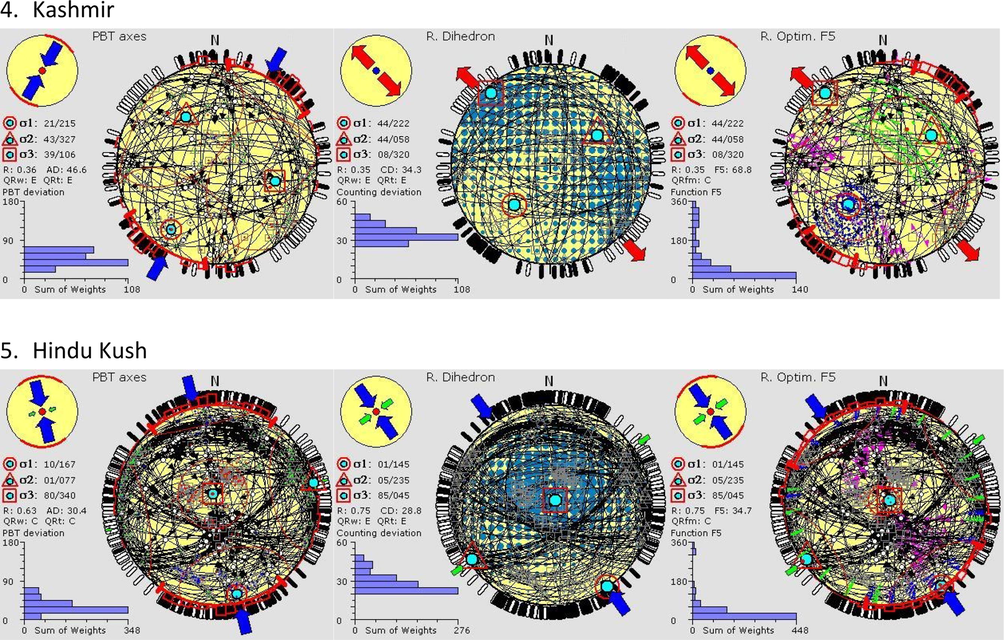
Lower-hemisphere equal-area stereo plots of the selected focal planes and associated slip lines (black dot with outward arrow) of the six seismic zones (left column shows the previous studies and right column shows the current study). Stress inversion results are represented by the orientation of the 3 principal stress axes (a black dot surrounded by a circle for σ1, a triangle for σ2 and a square for σ3). The related SHmax and SHmin orientations are represented by large arrows outside the stereogram. The histogram on the lower left corner of the figs. represents the distribution of the misfit angle F5. The small grey symbols inside the stereogram represent the orientations of the related kinematic axes (circle: p-axis, triangle: b-axis, square: t-axis).
Lower-hemisphere equal-area stereo plots of the selected focal planes and associated slip lines (black dot with outward arrow) of the six seismic zones (left column shows the previous studies and right column shows the current study). Stress inversion results are represented by the orientation of the 3 principal stress axes (a black dot surrounded by a circle for σ1, a triangle for σ2 and a square for σ3). The related SHmax and SHmin orientations are represented by large arrows outside the stereogram. The histogram on the lower left corner of the figs. represents the distribution of the misfit angle F5. The small grey symbols inside the stereogram represent the orientations of the related kinematic axes (circle: p-axis, triangle: b-axis, square: t-axis).
The relative magnitude and direction of stress axis represented by four parameters extracted from the complete six components of a symmetric stress tensor: the directions of principal stresses, σ1, σ2, and σ3 (σ1 ≥ σ2 ≥ σ3), and the stress ratio R = (σ2 − σ3)/(σ1 − σ3) (0 ≤ R ≤ 1). We employed two different stress inversion methods; right dihedron and rotational optimization (Delvaux and Sperner, 2003), to determine the stress tensor using Win-Tensor software (Delvaux et al., 1997; Delvaux and Sperner, 2003). The stress regime index (R′) was used in Win-Tensor to clarify the stress regime range, which determines a specific stress regime over a range of values. The first step when using Win-Tensor software is to process the data using the enhanced “Right Dihedron method.” This method is used to determine the principal stress axes (i.e. T-, B-, and P-). This method is limited by the use of an equal-area projection to distinguish the stress axis. Thus, to overcome this limitation, the results obtained using this method served as an initial process of “Rotational Optimization” inversion process (Delvaux and Sperner, 2003). This process uses a 4-D grid search with finite rotation around the three principal stress axes. The rotation angle for each principal stress axis is calculated by reducing the value of the F5 function to get the R value. By repeating this process, the three principal stress axes are justified and then the R value is determined. This procedure should be recurrent until the stress field of the inversion becomes stable. Once the final stress state is identified, the stress regime index is also got. The directions of horizontal stress, which are calculated by Win-Tensor software, are usually demonstrated according to two perpendicular horizontal axes, including SHmax and SHmin as the maximum and minimum horizontal axes, respectively.
4 Results and discussion
The present-day stress field in the NW Himalayas and surrounding regions was investigated through focal mechanism catalogs from 1974 till 2019 where 440 focal mechanisms collected from international seismological bulletins. For this purpose, we identified six distinct seismic regions: NW India, Pakistan, Nepal, Xizang, Kashmir, and Hindukush. The focal mechanisms along the Himalayan Range were consistent with the underthrusting of the Eurasian plate by the Indian plate. The solutions showed left-lateral motions along the southern portion of the Sulaiman Range and the Himalayan flank of the Assam syntaxis and right-lateral motions along the Karakoram Range and the Naga Hill flank. This was resulted from lateral mass movement at the two extremities of the Himalayas, which would be expected by the continental collision model.
The high-quality inversions were carried out to get the best fitting stress tensor (Table 3 and Fig. 5). Depending on the plunges of stress axes and azimuth of σ1, the maximum horizontal stresses were identified. The stress regime index (R′) values were investigated using the tectonic style using R′ = R for normal faulting regimes, if the σ1 has the largest plunge (≈vertical); R′ = 2 − R for strike-slip faulting regimes, if σ2 becomes vertical; and R′ = 2 + R for thrust faulting regimes, if σ3 almost vertical (Ali and Badreldin, 2019). Clear extension to radial compression varies R′ between 0 and 3. Table (1) shows the identification codes for the tectonic regime type referring to the World Stress Map standard (NF: normal faulting; SS: strike-slip faulting; TF: thrust faulting; NS: intermediate between NF and SS; TS: intermediate between SS and TF; and UF: unknown or oblique). The principal stress axes, R (stress ratio), R′ (stress regime index), and stress regime are listed in Table 3.
No
Region
Rotational optimization of Stress Tensor
Stress regime
σ1 (T-axes)
σ2 (B-axes)
σ3 (P-axes)
R
R'
F5
SH max
SH min
Q
PL
AZ
PL
AZ
PL
AZ
1
NW India
31
194
04
286
59
024
0.27
1.73
4.2
12
102
A
NF
2
Pakistan
18
162
38
266
47
052
0.57
1.43
36.7
154
64
C
NS
3
Nepal
24
197
06
105
66
002
0.43
1.57
7.1
20
110
A
NF
4
Xizang
54
018
35
193
02
285
0.89
2.89
30.6
15
105
C
TF
5
Kashmir
44
222
44
058
08
320
0.35
2.35
68.6
46
136
C
TS
6
HinduKush
01
145
05
235
85
045
0.75
1.25
34.7
145
55
C
NF
Generally, if the principal axis of the maximum compressive stresses (σ1) is horizontally aligned and the minimum compressive stresses (σ3) are vertically aligned, then a compressional stress regime is represented. When the orientation of σ1 is vertical and σ3 is horizontal together with the tensional component, an extensional tectonic state of stress is represented. The directions of the P- and the T-axes are shown in Fig. 5. Most of the P-axes were oriented in the NNE–SSW direction, in conformity with the general tectonic trend of the region (Valdiya, 1981; Yin, 2006). Only very few earthquakes with normal fault mechanisms were oriented WNW–ESE (Fig. 6). The T-axes had a wide range of orientations, suggesting that reverse faulting mechanism.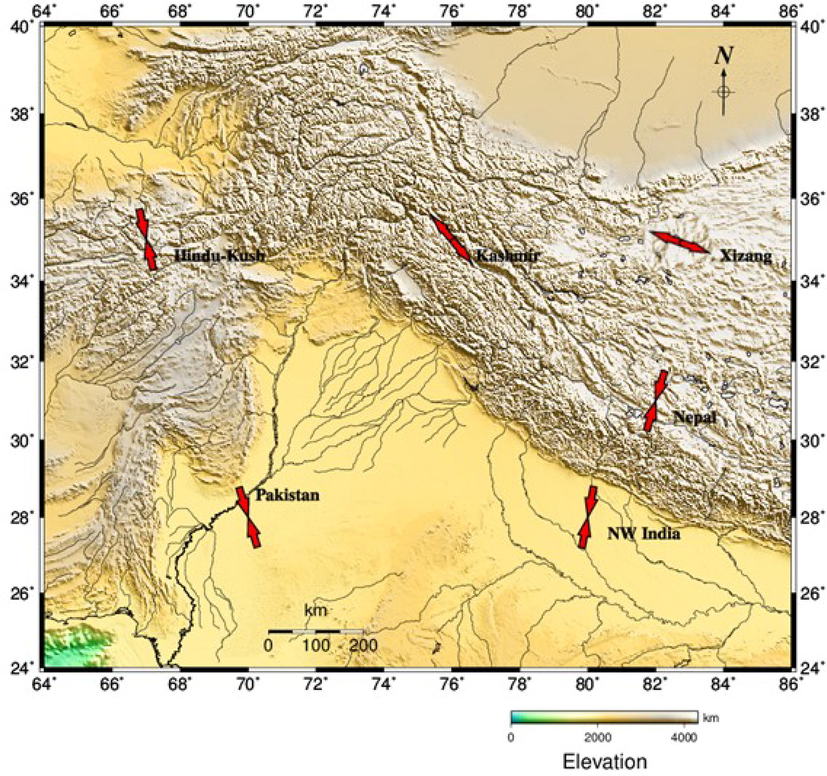
The present-day stress field distribution in NW Himalaya.
5 Conclusion
Seismically, the NW Himalayas and surrounding regions experience some of the most active continent–continent collisions on Earth. Due to these collisions, the upper part of the Indian plate has been sheared into a series of thrusts (i.e. the MCT, MBT, and MFT) where shallow seismicity prevails (<40 km) whereas deeper seismicity at 118 km and 258 km control the Kashmir and Hindukush regions.
The majority of FPSs presented in this study provides useful information for the synthesis of a more detailed seismotectonic model for this region and is useful for seismic hazard investigations. The FPSs confirmed northward underthrusting of the Indian Plate along the MBT and MCT systems and eastward underthrusting along the Burmese Arc. The focal mechanisms indicated left-lateral motion along the Kirthar–Sulaiman while right-lateral along the Karakoram Fault. These results agree with the expected sense of lateral movement of the continental collision model.
In this study, the stress inversion method has been applied using Win-Tensor software, which uses the inversion of focal mechanisms, to comprehensively reveal the stress field in the NW Himalaya and surroundings region; this enabled us to determine the spatial variations of the stress regime. The overall simulated stress pattern showed two distinct types of characteristic stress fields that have developed in the study area. The most compressive stress regime was represented by a normal faulting of NNE–SSW trend in NW India and Nepal regions illustrating consistency with the Indian plate movement and the direction of the India–Eurasia collision. An NNW–SSE trending compressive stress regime dominates the Pakistan and Hindukush regions, while an extensional stress regime represented by WNW–ESE trending thrust faulting mechanisms has developed in the Xizang and Kashmir regions (Fig. 6). These tectonic regimes connected with the major tectonic affecting the Arabian Peninsula which recommend to assess the earthquake hazards of the major cities in the Arabian Peninsula, especially the eastern countries of Kuwait, Saudi Arabia, United Arab Emirates and Oman.
Acknowledgments
The authors are grateful to the staff members of the International Seismological Centre, the USGS National Earthquake Information Centre, Harvard University, and the Lamont Doherty Earth Observatory GCMT, who provided the earthquake catalogs used in this study. The authors extend their appreciation to the Deputyship for Research & Innovation, “Ministry of Education “in Saudi Arabia for funding this research work through the project number IFKSURG-1436-011.
Declaration of Competing Interest
The authors declare that they have no known competing financial interests or personal relationships that could have appeared to influence the work reported in this paper.
References
- Present-day stress field in Egypt based on a comprehensive and updated earthquake focal mechanisms catalog. Pure Appl. Geophys.. 2019;176:4729-4760.
- [Google Scholar]
- Study of seismicity in the NW Himalaya and adjoining regions using IMS network. J. Seismol.. 2016;21(2):317-334.
- [Google Scholar]
- The Dynamics of Faulting (second ed.). Edinburgh: Oliver and Boyd; 1951. p. :206.
- Structural control on along-strike variation in the seismicity of the northwest Himalaya. J. Asian Earth Sci.. 2012;57:15-24.
- [Google Scholar]
- Kinematics of active deformation in the Sulaiman lobe and range. Pakistan J. Geophys. Res.. 2000;105:13253-13297.
- [Google Scholar]
- Special and focal mechanism of mantle earthquakes in the Hindukush-Pamir region: a contoured Benioff zone. J. Geol.. 1977;5:699-704.
- [Google Scholar]
- Tectonic setting, origin, and obduction history of the spontaneous Ophiolite, Ladakh Himalaya, NW India. J. Geol.. 2001;109:715-736.
- [Google Scholar]
- A Draft Primer on Focal Mechanism Solutions for Geologists, In “On the Cutting Edge” Workshop on Teaching Structural Geology in the 21st Century.“. Carleton College: Science Education Resource Center; 2004. p. :14.
- African stress pattern from formal inversion of focal mechanism data. Tectonophysics. 2010;482:105-128.
- [Google Scholar]
- Delvaux D., Sperner B., 2003. Stress tensor inversion from fault kinematic indicators and focal mechanism data: the TENSOR program. In: Nieuwland, D. (Ed.), New Insights into Structural Interpretation and Modelling. Geological Society London, 212, 75–100.
- Delvaux D., Moeys R., Stapel G., Petit C., Levi K., Miroshnichenko A., Ruzhich V., San’kov V., 1997. Paleostress reconstructions and geodynamics of the Baikal region, Central Asia, part 2. Cenozoic rifting. Tectonophysics. 282 (1–4), 1–38
- A proposed basis for geographical and seismic regionalization. Rev. Geophys.. 1965;3:123-149.
- [Google Scholar]
- A tomographic image of Indian lithosphere break-off beneath the Pamir-Hindukush region. Geophys. J. Inter.. 2006;164:425-440.
- [Google Scholar]
- Determination and identification of focal mechanism solutions for Himalayan earthquakes from waveform inversion employing ISOLA software. Nat. Hazards. 2014;76(2):1163-1181.
- [Google Scholar]
- An enhanced image of the Pamir-Hindukush seismic zone from relocated earthquake hypocenters. Geophys. J. Inter.. 1998;134:573-595.
- [Google Scholar]
- Valdiya K. S., 1981. Tectonics of the central sector of the Himalaya. In: Delani, F.M., Gupta, H.K. (Eds.), Zargos-Hindukush-Himalaya: Geodynamic Evolution, Geodynamic Series, American Geophysical Union, 3 (87–110).
- Vavryčuk V., 2015. Earthquake Mechanisms and Stress Field, Encyclopedia of Earthquake Engineering. DOI 10.1007/978-3-642-36197-5_295-1
- Yadav R. B. S., 2009. Seismotectonic modeling of NW Himalaya: a perspective on future seismic hazard, Ph. D. thesis, Dep. Earthquake Engineering, IIT, Roorkee, India, 198 pp.
- Recent seismicity and stress pattern in NW himalaya. Himalayan Geol.. 2009;30(2):139-145.
- [Google Scholar]
- Cenozoic tectonic evolution of the Himalayan orogen as constrained along-strike variation of structural geometry, exhumation history, and foreland sedimentation. Earth Sci. Rev.. 2006;76:1-131.
- [Google Scholar]
- Zang A., Stephansson O., 2010. Stress field of the earth’s crust. Springer, New York Zoback MD (2007) Reservoir geomechanics. Cambridge University Press, Cambridge.
- First-and second-order patterns of stress in the lithosphere: the World StressMap project. J. Geophys, Res.. 1992;97:11703-11728.
- [Google Scholar]


