

Translate this page into:
Techno-economic analysis of an integrated electrocoagulation-membrane system in treatment of palm oil mill effluent
⁎Corresponding author. mdzulhakim.wirzal@utp.edu.my (Mohd Dzul Hakim Wirzal)
-
Received: ,
Accepted: ,
This article was originally published by Elsevier and was migrated to Scientific Scholar after the change of Publisher.
Peer review under responsibility of King Saud University.
Abstract
Palm oil mill effluent (POME) is an oily wastewater generated by palm oil processing mills. Most palm oil factories and refineries have their own treatment system such as anaerobic digestion system and electrocoagulation (EC). In this study, a new method, integrated electrocoagulation (EC)-membrane system is introduced to treat the POME. The treatment efficiency and economic feasibility of the developed integrated EC-membrane is also evaluated by comparing with EC standalone system. This study highlights that the removal of POME by EC has increased with extended time and increasing voltage. Besides, the integrated EC-membrane shows better removal efficiency compared to the EC system. For model development, both standard least squares model for EC and integrated membrane-EC systems created by using JMP software showed a good fit and able to be used for further efficiency calculation. The economic analysis result shows that integrated EC-membrane method has a higher capital cost with lower in the operating cost per year than EC method. 75% color removal efficiency is achievable by integrated EC-membrane system at voltage 1 V and 2 V in which EC method requires voltage of 4 V and higher. Notably, the total cost of integrated EC-membrane system at the first year of implementation is lower than the EC system and in 15 years period has a 21.24% lesser cost compared to EC system.
Keywords
Palm oil mill effluent
POME treatment
Electrocoagulation
Membrane
Techno-economic analysis

1 Introduction
Palm oil mill effluent (POME) is the waste product generated by the palm oil processing mills that contains of different suspended materials and dissolved solids. It appears as a thick brown saturated liquid waste with unlikable odor with soluble solids and materials in it that has an enormous impact to the environment (Ali Huddin, Irvan, Mohd Nordin, & Arezoo Fereidonian, 2012; Saad et al., 2020b; Tan & Lim, 2019). POME has potential to pollute the environment and several treatment processes has been developed to treat POME before it is discharged out to the environment. The existing treatment processes of POME are anaerobic digestion, EC, membrane, and adsorption. Anaerobic digestion process is economically feasible as the method needs a low capital and operating cost by using covered lagoon as the digester type. (Choong, Chou, Norli, & Reviews, 2018; Medri & Costa, 2003; Sani et al., 2020). However, anaerobic digestions require large land area, long hydraulic retention time (HRT) and produces smelly odor (Lee et al., xxxx; Lee & San Lee, 2020; Wastewater Technology Fact Sheet Anaerobic Lagoons, 2002; Zainal, 2018).
Recent studies have shown that EC system is an excellent alternative to palm oil-based wastewater treatment (Bashir, Mau Han, Jun Wei, Choon Aun, & Abu Amr, 2016; Chairunnisak, Arifin, Sofyan, Lubis, & Darmadi, 2018; Nasrullah et al., 2017). EC is an electrochemical method that uses aluminum (Al) or iron (Fe) electrodes powered by direct current (DC) to treat waste effluents. The metal ions generated at the anode will undergo hydrolysis or oxidation process in the water and produced coagulant hydroxide precipitates which will then be denser than water and able to be removed by settling process and adsorption (Hakizimana et al., 2017). Meanwhile the cathode will produce hydroxyl ions that forms hydrogen gas and oxygen by reduction process. The hydrogen and oxygen gases produced will result in floating effect, which causes the pollutants to rise to the surface and form a stable floc layer (Syaichurrozi et al., 2020; Wirzal et al., 2020; Wirzal et al., 2013). Usually, Al and Fe is chosen as the electrodes as they have advantages such as low price, non-toxic and have a better removal efficiency of pollutants. Besides, EC system on POME shows good result in reducing the turbidity of the effluent, increasing the pH value close to neutral, and greatly reducing the COD and BOD level (Barrera-Díaz, Frontana-Uribe, & Bilyeu, 2014; Bashir, Lim, Abu Amr, Wong, & Sim, 2019; Nasrullah et al., 2017).
Membrane technology is an effective and economical separation method used widely in industrial wastewater treatment (Abd Halim et al., 2019; Abdurakhman et al., 2018a; Zahari et al., 2018; Zhang, Yao, Maleki, Liao, & Lin, 2019). The membrane served as a barrier to block and separate the materials with particular affinity through pore management. A few of its advantages are simple and easy operation, low energy consumption and no use of chemicals (Abdurakhman et al., 2018b; Chen et al., 2018; Ma, Ping, & Dong, 2017). The membrane used in this research is nylon 6,6 nanofiber membrane (NFM). Nylon 6,6 has shown better advantages than other membranes like higher fouling resistant and clean water permeability (Abd Halim et al., 2019; Bilad et al., 2018; Jasni et al., 2017; Mat Nawi et al., 2020). The membrane separation treatment was reported to have greatly reduce the turbidity, COD and BOD amount by using ultrafiltration (UF) and reverse osmosis (RO) (Latif Ahmad, Ismail, & Bhatia, 2003). However, membrane technology has a major drawback, which is membrane fouling that reduce the efficiency of separation, especially membranes with smaller pores such as nanofiltration, UF and RO (Eliseus et al., 2018). The fouling situation can be delayed by having a pre-treatment such as EC or coagulation which aid filtration process by agglomerating small particles into larger masses and make it easier to be eliminated (Abdulsalam, Che Man, Isma Idris, Faezah Yunos, & Zainal Abidin, 2018; Elma, Rahma, Pratiwi, & Rampun, 2020; Xing et al., 2019). In addition to that, the economic aspects of newly developed systems are rarely reported for wastewater treatment methods. Many previous studies managed to report the performance of the treatment systems that were developed. Yet, economic aspects of it were rarely studied or mentioned.
To tackle the issues mentioned, a new system, integrated EC-membrane system was proposed which will provide higher removal efficiency with lower energy consumption. The proposed method started with EC system that coagulate the particles in the POME and transfer the wastewater along with the suspended solid through the membrane to filter out the solid particles. Furthermore, economical aspects of the reported results by Muhammad Syaamil Saad et al. (2020) were emphasized in this study. Thus, the aim of this paper is to perform modelling on the obtained experimental data and subsequently evaluate the economic analysis of the proposed methods. Parameters such as voltage and time between integrated membrane-EC system and EC standalone method was assessed to determine its effectiveness in color removal as well as maintain a low operating cost if it is to be scaled up to industrial size.
2 Materials and method
2.1 Chemicals and apparatus
Chemicals used in this research were formic acid (98–100%) (Merck, USA), acetic acid (Merck, USA), nylon 6,6 pellets (Sigma, USA) and sodium chloride (Merck, USA). Fe plates used for electrodes were procured from local store. Apparatus involved in performing integrated EC-membrane treatment of POME includes 150 mm diameter filter paper (Whatman, UK), DC power supply (Zhaoxin, Model: RXN303D, China), Magnetic stirrer (IKA, Model: C-MAG HS 7, Germany), peristaltic pump (Chuang Rui, Model: BT600M, China), 5 ml syringe (TERUMO, Japan), needle (TERUMO, Japan), syringe pump (Nanolab, Model: SP20, Malaysia), high voltage power supply (Nanolab, Model: PS35-PV, Malaysia), and a rotating drum controller (Nanolab, Model: ESD 30, Malaysia).
2.2 EC setup
The EC setup was executed and adopted from (Muhammad Syaamil Saad et al., 2020) as this study is the continuation of the previous research. Fe plates with dimension of 6 × 4 cm were used as electrodes. In summary, the voltage applied for EC treatment of POME were 2 V (1.50 mA/cm2), 4 V (4.75 mA/cm2), 6 V (5.00 mA/cm2), 8 V (6.50 mA/cm2) and 10 V (110.00 mA/cm2). A 400 ml of pre-treated of POME samples were placed in a 500 ml beaker and stirred continuously for 60 min during EC with Fe electrodes. Every 15 min, 30 ml of POME were filtered and collected for the determination of colour removal using UV–Vis spectrophotometry.
2.3 Nylon 6,6 membrane fabrication
Nylon 6,6 membrane fabrication method was also adopted from Muhammad Syaamil Saad et al. (2020) and Abd Halim et al. (2019). Nylon 6,6 pellet was added to the mixture of formic acid and acetic acid (14:86) of polymer to solvent. Membrane solutions were stirred for 24 h under temperature of 70 °C to allow homogeneous mixture. Membrane was then fabricated by electrospinning method using 20 kV of voltage supplied, membrane solution injection flowrate of 0.4 ml/h and spinning collector speed of 500 rpm for 37 h.
2.4 Integrated EC-membrane setup
The membrane sheet was cut and put between two rubber gaskets which were connected via rubber pipe from the POME. The edges of the rubber frame were enveloped with polytethrafluoroethylene (PTFE) tape to prevent leakage at the side and was clipped both left and right sides to hold the two frames tighter. The feed and retentate were dipped inside the beaker containing POME solution while the permeate was channeled into a measuring cylinder for collection. Before pump was turned on, initial sample of POME was collected for the analysis and comparison with permeate. Then, the permeate was collected every 15 min and volume was measured to calculate the membrane permeability. Once the permeate reached steady state (constant volume for 3 consecutive sampling), DC power supply was turned on. The samples collections were done at permeate side of membrane and were taken every 15 min for an hour with 1 V (0.05 mA/cm2) and 2 V (1.50 mA/cm2) applied to the electrode. Lower voltage (1 V and 2 V) was specifically chosen to reduce the energy consumption and hence the cost. With integration of membrane, lower voltage was redeemed sufficient to maintain a high removal efficiency of color of POME. Finally, the permeate was collected for analysis and pump was turned off. The integrated EC-membrane setup is illustrated as Fig. 1.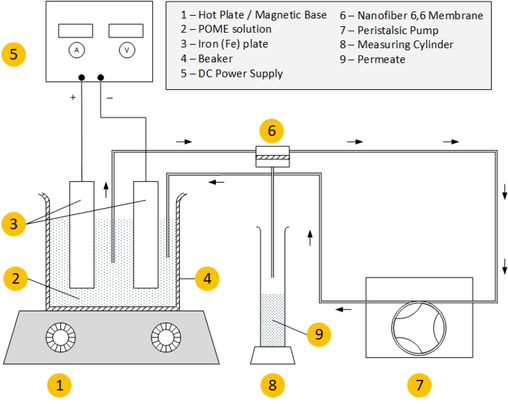
Integrated electrocoagulation (EC)-membrane setup of POME with 0.1 bar pressure and 27 °C using nylon 6,6 nanofiber as membrane.
2.5 Techno-economic analysis
2.5.1 Data collection
Data required for modelling were collected from articles, journals, experiment and thesis. The parameters that were collected are the UV–Vis and COD reduction result based on the independent variables of types of electrodes, voltage and time. The experiments were repeated three times for validation of the results.
2.5.2 Statistical data analysis
After the data collection, the data was then analysed by calculating the percentage of removal by each method. Furthermore, the data have then been developed into a model by using the JMP Pro 13.0 software for EC and integrated EC-membrane method. Graphs were then plotted by the removal efficiency and the manipulated variables such as voltage and time.
2.5.3 Modelling and validation
Modelling of each method were done to evaluate the significant of the manipulated variables to the process. Regression analyses were used to predict the modelling of both EC and EC-membrane system. Standard Least Square Model is an approach of a regression analysis by minimizing the sum of squares of residuals to create a fitting model. The modelling method optimize the application of data fitting as the fitting of the model is based on the best fit line of data and helps to estimate the relationship between a dependent variable towards one or a few sets of independent variables. The method often used in linear regression model is ordinary least square estimate. This method generates estimators (constant variable) for each of the independent variables in the model. The graph of the removal efficiency against the predicted value was plotted to determine the correlation between each variable while determining the value of R-squared (RSq), root mean square error (RMSE) and the P value.
2.5.4 Economic analysis
Capital expenditure (CAPEX) and operating expenses (OPEX) comparison was made between each model to determine the best option that exhibits the minimum cost to run a treatment plant using Microsoft Excel and OriginPro 2016 software which is a data analysis and graphing software. According to Smith (2005a), CAPEX can be estimated using fixed factors as reported in Table 1 for economic analysis of a plant. Hence, the values were adopted into the calculation of plant erection in this study.
Symbol
Item
Factor
f1
Equipment Erection (Installation)
0.4
f2
Piping
0.7
f3
Instrumentation and control system
0.2
f4
Electrical System
0.1
Physical Plant Cost Factor
1.4
f5
Design and Engineering Fees
0.3
f6
Contractor's Fees
0.05
f7
Contingency Cost
0.1
Fixed Capital Factor
0.45
3 Result and discussion
3.1 Comparison of method
The removal efficiency of the proposed method, integrated EC-membrane system was compare with EC standalone system (Muhammad Syaamil Saad et al., 2020). Both system were previous related research from the same author. The proposed integrated system is a combination of EC method followed by a microfiltration process by using nylon 6,6 nanofiber membrane as a filtration unit. Fig. 2 shows the removal efficiency for EC and integrated EC-membrane methods. From the results, integrated system exhibits excellent removal efficiency even at low voltages (1 V and 2 V). Color removal efficiency of integrated system for 1 V at 15 min was 72.63%, then increased to 74.64%, 75.00% and 75.09% for every next 15 min until 60 min. The same trend was observed for integrated system at 2 V. The first 15 min shows the lowest color removal efficiency which is 74.30%, then dropped to 75.52%, 76.79% and 76.99% with every 15 min intervals. This increasing trend is often exhibits by an EC treatment. The trend observed by EC standalone systems are proportional to the increase in voltage and time in which aligns with most of treatment done by EC (Aris, Ibrahim, Arifin, & Hawari, 2017; Ibrahim, Aris, Ariffin, Hawari, & Hanafiah, 2018; Saad et al., 2020a; Yavuz & Ogutveren, 2018). This is the norm when dealing with EC as the higher the voltage applied, the higher the rate of anode dissolution hence release more coagulant agent (Fe2+). Formation of bigger colloids can be concluded as more sedimentation can be observed and improved decolorization of treated wastewater as voltage and time increase. In addition, at low voltage (2 V), EC standalone method removal efficiency of color is relatively low when compared to integrated system with minimum of 13.40% and maximum color removal of 18.90%. At 4 V, color removal efficiency increased from 46.40% to 63.20%, 72.7% and 76.20% for increment every 15 min, which is comparable to 1 V and 2 V in integrated system. As the voltage was applied to the electrodes and the reaction time was prolonged, more metal atoms will turn into ions. In this study, more Fe3+ and Fe2+ ions were formed on the anode surface as in reaction in Equation 1–3 as reported (Chafi, Gourich, Essadki, Vial, & Fabregat, 2011; Irki, Ghernaout, Naceur, Alghamdi, & Aichouni, 2018).
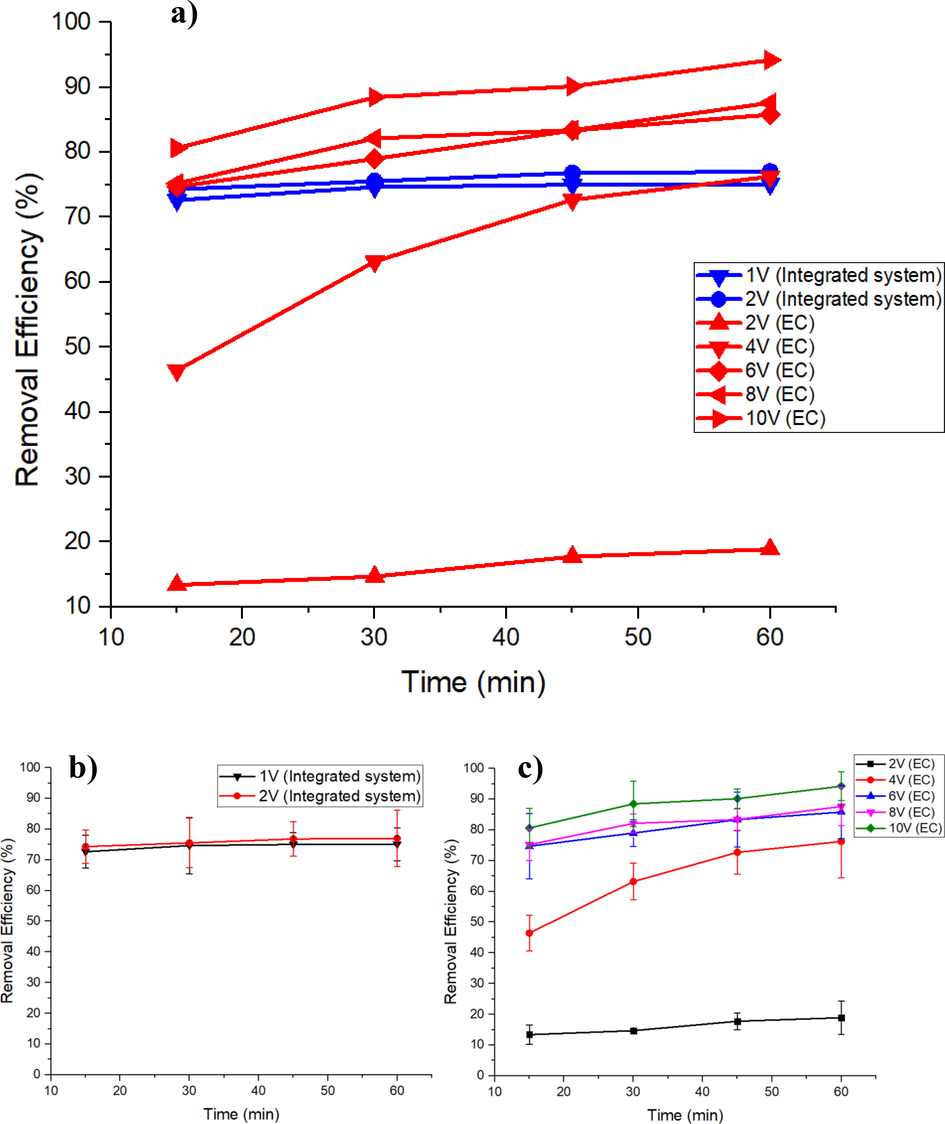
a) Removal efficiency of color at 1 V and 2 V (Integrated EC-membrane) and 2 V, 4 V, 6 V, 8 V, 10 V (EC standalone) of POME, b) Removal efficiency of integrated system with error bars and standard deviations (1 V and 2 V), and c) Removal efficiency of EC system with error bars and standard deviations (2 V, 4 V, 6 V, 8 V and 10 V).
From Fig. 2, integrated EC-membrane system has shown interesting results where the removal efficiency of color for 1 V and 2 V showed excellent color removal rate even at a lower voltage compared to normal EC process. This phenomenon may be explained by formation of colloids that flocs together during EC, making it larger in size (Gong et al., 2017). Integrated EC-membrane system has shown interesting results where the removal efficiency of color for 1 V and 2 V shows high color removal even at low voltage as compared to normal EC process. This phenomenon may be explained by the formation of colloids that flocs together during electrocoagulation, making it larger (Gong et al., 2017). One of the reasons why the integration of nanofiber was crucial was to filter the colloids from wastewater and allowing a much clearer solution to pass through its pores (Saad et al., 2020a). For 1 V, the low reaction of coagulants with pollutants in wastewater caused by the low anode dissolution resulting in less formation of bigger colloids, hence pass-through membrane pores. This explains the slightly lower removal efficiency of color as compared to 2 V in integrated system. Thus, to counter the problem, the voltage was increased. This was well exhibited by the integrated system at 2 V where the removal efficiency of colour at the end of treatment was seen slightly improved compared to 1 V. With only microfiltration treatment, the removal colour from POME was only 13.6%. It was proven that with integration of EC at low voltage could further increase the removal efficiency of colour in POME. In alignment with the scope of this study, lower voltage (1 V and 2 V) were investigated on how it affects integrated EC-membrane system despite the potential for higher voltage to reduce more colour. This was because at higher voltage (>2 V), the system would incur additional costs. Therefore, process modeling and techno-economic analysis were done to evaluate which system will benefit the most with the high removal efficiency of color. This is why the integration of nanofiber is crucial as the membrane will filter the colloids from wastewater and allowing a much clearer solution to pass through its pores (Saad et al., 2020a).
Membrane permeability in the integrated system has shown a slight increment in the early treatment of POME using 1 V as shown in Fig. 3. However, the steady-state of permeate flowing through the membrane was observed to be approximately the same as microfiltration method alone. The coagulation of the particles during EC process succeeded in reducing the fouling in the early stages of microfiltration and at a lower voltage (1 V). Despite that, the same results were not observed in 2 V. This phenomenon can be explained by increment of voltage during EC that resulted in a higher coagulation rate of the particles. As the voltage increases, fouling immediately occur in the early stage of microfiltration and reduces the permeate flow through the membranes. The steady-state of the integrated system at 2 V was also seen to be achieved at a faster rate as compared to 1 V and microfiltration alone.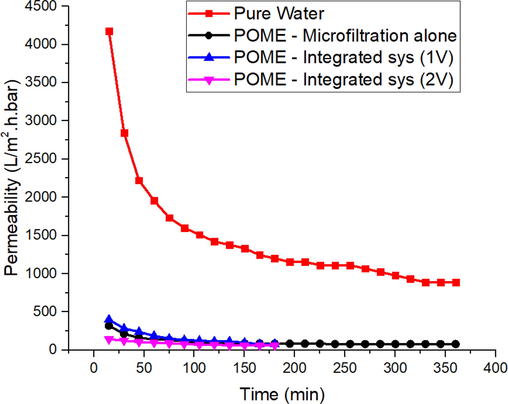
Permeability comparison between pure water and POME with microfiltration standalone and integrated system at 1 V and 2 V (Muhammad Syaamil Saad et al., 2020).
3.2 Development of model
Based on the experimental data from Saad et al. (2020a) and data from this research, the models for removal efficiency of EC were constructed which were linear, quadratic and cubic equations. In this study, the manipulated variables considered were voltage (V) and time (T). Therefore, the linear equations would consist of V and T, quadratic equations would have V2, V, T2, T and cubic equations would be having variables of V3, V2, V, T3, T2, T.
Table 2 shows the comparison table of the EC model developed. The result shows quadratic equation model for removal efficiency of EC has the best fit with the RSq adjusted of 0.81 and p-value of 0.0001. Although the cubic equation has a higher RSq adjusted of 0.86 and a lower RMSE of 13.451, it has 3 variables of p-value lower than 0.05 indicates that the variables of the model does not fit well. Hence, quadratic equation model is chosen as the best fit model and is compared with cross-variable model.
Type
Variables
RMSE
RSq
RSq
(Adjusted)P-value
Variables P-Value > 0.05
Linear
V, T
23.557
0.62
0.59
0.0001
0
Quadratic
V2, V, T2, T
15.864
0.84
0.81
0.0001
0
Cubic
V3, V2, V, T3, T2, T
13.451
0.9
0.86
0.0001
3
Quadratic
V2, V, T2, T
15.864
0.84
0.81
0.0001
0
Quadratic Cross Variable
V2, V, T2, T, VT
14.118
0.88
0.85
0.0001
0
The comparison of quadratic equation with quadratic cross variable equation model is further described. The cross variable in this study is combination of voltage and time (VT). The table shows that the quadratic cross variable shows a better fit as it has a lower RMSE of 14.118 and RSq of 0.85 which is higher than the value in quadratic equation model. Therefore, it can be confirmed that the quadratic cross variable model is chosen as the best fit for removal efficiency of EC method. In this model development of EC, no modification is needed as there is no variable with P-value higher 0.05.
All 5 variables showed in the effect summary report shows the p-variable of less than 0.05 indicates all variable are significant and able to affect the removal efficiency. Equation 2 shows the simplified predicted expression of the model produced from JMP software for EC method.
The model for color removal efficiency of integrated EC-membrane has also been constructed using experimental data. A total of 3 models constructed consisting of linear, quadratic and cubic equations. Table 3 shows the comparison of integrated EC-membrane model. The table shows that all three types of equation model are a bad fit. The better fit among the three models created are the cubic equation model as it has the lowest root mean square error (RMSE) of 11.773, highest RSq and RSq adjusted of 0.87 and 0.63 respectively. However, it can be said to be a good fit as according to (Huang & Purvins, 2020), a model should return a p-value of less than 0.05 to be considered as acceptable.
Type
Variables
RMSE
RSq
RSq
(Adjusted)P-value
Variables P Value > 0.05
Linear
V, T
19.427
0.18
0
0.3988
2
Quadratic
V2, V, T2, T
18.639
0.42
0.08
0.3732
4
Cubic
V3, V2, V, T3, T2, T
11.773
0.87
0.63
0.1108
7
Modified Cubic Variable
V, V2, T, T2, T3, VT
10.901
0.8574
0.69
0.0488
4
Modified Cubic Variable
V, V2, V3, T, T2, VT
9.978
0.8566
0.74
0.0163
4
Modified Cubic Cross Variable
V, V2, V3, T, T2, T3, VT
10.901
0.8574
0.69
0.0488
5
Modified Cubic Cross Variable
V, V2, V3, T, T2, T3, VT, VTT
11.774
0.8669
0.63
0.1108
7
Modified Cubic Cross Variable
V, V2, V3, T, T2, T3, VT, VVT
6.215
0.9629
0.96
0.0102
4
Modified Cubic Cross Variable
V, V2, V3, T, T2, T3, VT, VVT, VTT
6.187
0.9724
0.89
0.0286
6
The comparison of modified cubic equation model and modified cubic cross variable model were shown in bottom section of Table 3. The table shows that the modified cubic cross variable model that consist of V3, T3 and VVT has a better fit of RSq adjusted of 0.96, among lowest RMSE and lowest p-value of 0.0102. The RMSE shows a promising reduction as well of from 11.773 to 6.215. Thus, the modified cubic cross variable model was the most ideal for integrated EC-membrane system.
The predicted plot from the modelling shows that the R-Square line fits well and has a root mean square (RSq) of 0.96 and p-value of less than 0.0102 indicates that this model shows a good fit. Equation 3 shows the simplified predicted expression for the removal efficiency of integrated EC-membrane method that is being generated by the software from the experimental data.
3.3 Economic analysis
Economic Analysis very crucial determine the effectiveness of the method in large scale and in industrial wastewater system. In industry scale, the wastewater treatment method should be economically viable. In this sub chapter, the economic analysis is made by comparing the total cost needed for EC and integrated EC-membrane system. The total cost needed to be calculated for each method can be divided into 2 main costs which are capital cost and operating cost. There are a few assumptions to be made before proceeding to the calculation of capital cost and operating cost which are the plant is assumed to treat 1000 m3/d of POME with the removal efficiency of 75%. The operating hours per year is assumed to 8000 h per year according to (Sinnott, 2005).
Capital cost is a fixed cost, or a one-time expense incurred on the purchase of an asset such as land, building or equipment needed to produce goods or services. In this study, the capital cost of EC system and membrane system are being calculated to compare to the difference in cost and to assess the cost viability of each treatment method process.
For EC process, the major equipment needed is reactor. The size of reactor can be found by using equation (2) and (3) for EC method and integrated EC-membrane system respectively by determining the removal efficiency as 75% in which are achievable by both EC method and integrated system. The voltage calculated will be 2 V, 4 V, 6 V, 8 V and 10 V. The cost of the reactor can be calculated by using the formula proposed by (Smith, 2005a) which is stated as equation (4) where CE is equipment cost ($). CB is base cost ($), Q is design capacity (m3), QB is base size, M is cost exponent, fm is correction factor for material, fp is pressure correction factor, ft is temperature correction factor and all these values are be referred from (Smith, 2005b). The correct factor for EC reactor is set to 1 as the temperature is within 0–50 °C, pressure is at 1 bar while the material selection for the reactor and tank is carbon steel.
After calculating the cost or equipment, the total capital cost can be calculated by multiplying the factors included in the capital cost estimation. The factors value are obtained by (Smith, 2005a) and Table 1 shows the factors included for physical plant cost calculation which are the equipment erection or installation cost, piping system, instrumentation system and electrical system while total fixed capital cost factors included design and engineering fees, contractor’s fees and contingency cost. Equation 5 shows the physical plant cost calculation while Equation 6 shows the total fixed capital cost calculation.
For the total capital cost of integrated EC-membrane system, as there is not much literature information about this method, therefore, it is assumed the plant is having the combination of an EC reactor as well as a membrane tank. The method to calculate the capital cost of EC reactor is similar and the same method is to be used to calculate the capital cost of a membrane tank. Integrated membrane-EC process starts off with a reactor and then to a membrane tank for further treatment.
Operating cost can be defined as the cost of resources to run a specific operation and just to maintain its existence of a business. Operating cost can be divided into 2 sections which are fixed cost and variable cost. Fixed cost is the compulsory cost which needed to run the operating such as raw material cost and utilities cost while variable cost is the cost which may increase or decrease depends on the amount of production such as maintenance.
In this study, the operating cost of EC system was calculated according to (Ghosh, Medhi, & Purkait, 2011). Equation 7 is used to calculate the amount of cost needed per year (MYR/ year) to run the EC operation. In the equation, Cenergy is the energy (kWh) needed to run the reactor per year while Celectrode is the amount of electrode (kg) needed per year for the EC process. Meanwhile, a is price electricity constant for RM0.434/kWh (Malaysia electricity prices,“ 2019) and b is the price of Fe electrode which is RM2.56/kg (Nshimyimana, 2020). Membrane cleaning and replacement on the other hand was already included in capital cost under the contractor’s fee for the membrane tank.
The formula to calculate Cenergy is mentioned in Equation 8 where U is voltage (V), I is current (A), tEC is time for EC (hour), v is flowrate (m3) and Celectrode can be calculated via Equation 9 where t is time for EC (second), Mw is molar mass of Fe (56 g/mol), z if electron transfer of Fe (z = 2), and F is faraday’s constant (96487C/mol).
For the operating cost of integrated membrane EC system, it is calculated as the combination of EC reactor as well as operating cost of a membrane tank. A membrane tank is chosen based on the configuration of the current proposed system that is being upscaled. Besides, the simplicity of the design is one of the advantage and can best be explained by (Lo, McAdam, & Judd, 2018). The operating cost for membrane tank can be calculated as equation 10 according to (Lo et al., 2018) where LE is price electricity constant for RM0.434/kWh (Malaysia electricity prices,“ 2019), Etot is total amount of energy needed, LM is membrane price for RM127.8/m2 while Mtot is membrane needed per year. Equation 11 shows the membrane size calculation according to (Samhaber & Nguyen, 2014).
3.4 Comparison of cost
Based on the calculation done, the capital cost and operating cost of EC and integrated EC-membrane method are calculated and shown as Table 4 and Table 5 respectively. Based on the table, the lowest capital cost is the EC method with 8 V with only RM 0.58 million needed. This is because the lower the reaction time needed for EC, the smaller the volume of the reactor size and hence, less cost is needed to construct the treatment plant. EC method at 2 V was rendered unsolvable by the modelling due to its result in color removal that did not achieve 75%. This contributes to incapacity in calculating the reactor sizing, capital cost and operating cost subsequently. However, at 4 V, EC method was found to take the longest retention time (60 min) to reach 75% color removal, hence the massive capital cost due to large reactor size. Integrated EC-membrane systems on the other hand tend to have a higher capital cost due to additional membrane tank needed, as well as purchase of membrane sheet. Moreover, based on Table 5, integrated EC-membrane system has the lowest operating cost per year which is only RM 0.13 million with 1 V and RM 0.14 million for 2 V. Integrated EC-membrane method uses lesser operating cost as it lowers the voltage needed to reach the same efficiency compared to EC method and thus, reduce the utilities cost and Fe electrode cost needed per year. *Unsolvable = method is unable to achieve 75% efficiency, modelling will return an error during calculation of retention time.
Types of Treatment
Retention time (min)
EC Capital Cost (MYR)
Membrane Capital Cost (MYR)
Total Capital Cost (MYR)
EC (2 V)
Unsolvable
Unsolvable
Unsolvable
Unsolvable
EC (4 V)
60.00
913,254
N/A
913,254
EC (6 V)
24.90
614,790
N/A
614,790
EC (8 V)
21.53
575,840
N/A
575,840
EC (10 V)
24.45
609,729
N/A
609,729
Integrated (1 V)
17.40
523,155
272,110
795,264
Integrated (2 V)
11.37
431,975
217,163
649,139
Types of Treatment
Utilities Cost (MYR/year)
Fe Electrode Cost (MYR/year)
Membrane Cost (MYR/year)
Total Operating Cost (MYR/year)
EC (2 V)
Unsolvable
Unsolvable
Unsolvable
Unsolvable
EC (4 V)
274,867
4,065
N/A
278,932
EC (6 V)
180,122
4,279
N/A
184,401
EC (8 V)
269,950
5,563
N/A
275,513
EC (10 V)
648,429
9,414
N/A
657,843
Integrated (1 V)
2,097
428
133,125
135,650
Integrated (2 V)
8,222
1,284
133,125
142,631
Table 6 shows the total cost that could be calculated in Equation 12 for EC and integrated EC-membrane treatment methods at varying voltages. Based on the results, it can be shown that for EC method, it is best operating the plant with 6 V voltage while integrated EC-membrane method at 2 V to obtain the lowest total cost per year. Integrated EC-membrane at 1 V exhibits a higher capital cost due to longer retention time as compared to 2 V despite the operating cost is lower. When capital cost and operating cost are added up, 2 V shows a lower total cost as compared to 1 V. Therefore, in later calculations, 2 V is considered to represents the integrated EC-membrane system and are to be compared with 6 V for EC method. In addition, from the table, it can be shown that integrated EC-membrane method can achieve the same percentage of removal efficiency by using the lesser amount of energy used.
Year
Total Cost (MYR)
EC (4 V)
EC (6 V)
Integrated system (1 V)
Integrated system (2 V)
1
1,192,186
799,191
930,915
791,769
2
1,471,118
983,592
1,066,565
934,400
3
1,750,050
1,167,993
1,202,215
1,077,031
4
2,028,981
1,352,395
1,337,865
1,219,661
5
2,307,913
1,536,796
1,473,515
1,362,292
6
2,586,845
1,721,197
1,609,165
1,504,922
7
2,865,777
1,905,598
1,744,815
1,647,553
8
3,144,709
2,090,000
1,880,465
1,790,184
9
3,423,640
2,274,401
2,016,116
1,932,814
10
3,702,572
2,458,802
2,151,766
2,075,445
11
3,981,504
2,643,203
2,287,416
2,218,076
12
4,260,436
2,827,604
2,423,066
2,360,706
13
4,539,368
3,012,006
2,558,716
2,503,337
14
4,818,299
3,196,407
2,694,366
2,645,968
15
5,097,231
3,380,808
2,830,016
2,788,598
4 different parameters were compared from this study which were 4 V and 6 V from EC method while for integrated system, both 1 V and 2 V were chosen. The integrated system’s color removal efficiency was comparable to EC at 4 V. Nonetheless, as the modelling were done, the time it takes for 4 V method to reach 75% color removal was very high in which causing a larger EC tank. This consequently led to high capital cost as well as high operating cost for EC treatment. Thus, 6 V was chosen to be compared along with 4 V due to its lowest total cost exhibit in Table 6. Despite EC at 6 V have the longest retention time when compared to 8 V and 10 V,
6 V however consumed lesser energy and was reflected by lower operating cost. Integrated system requires a higher capital cost compared to EC. This is because the integrated membrane-EC method requires more equipment setup as a system and hence, increases the capital cost needed. However, the operating cost for integrated system is lower than the EC method. This can be seen as a cost saving method at the long run of industry. Integrated system at 1 V have a higher capital cost due to high retention time as compared to 2 V. Capital cost exhibit by integrated system at 1 V exceeded 2 V as much as RM 146,125. Still, integrated system at 1 V have a lower operating cost due to lower energy consumption.
Table 6 also shows the comparison of total cost for EC and integrated EC-membrane treatment methods looking at a longer period, which is 15 years’ time. The table shows that at since year 1, the total cost of the integrated EC-membrane systems (1 V and 2 V) were lower compared to the EC method (4 V and 6 V) and in 15 years, integrated method can save MYR 0.55 million and MYR 0.59 million for 1 V and 2 V respectively compared to the EC method at 6 V. This indicates that the proposed integrated EC-membrane systems are economically feasible and showed a good potential for industrial application in a long run.
Proposed integrated EC-membrane system was proven to be more feasible when compared to EC standalone for treatment of POME. Thus, comparison with conventional biological method is seemed appropriate. A research conducted by Yeoh et al (2005) on anaerobic digestion of POME treatment with an additional heat and power generation from biogas produced (Yeoh, 2005). Table 7 compares the operating condition of integrated EC-membrane with EC and conventional biological method, biological method with gas recovery and coagulation method. The integrated EC-membrane treatment capacity as well as retention time shows better results in the treatment of POME as compared to the other methods mentioned. In addition, reactor volume that exhibit by the proposed EC-membrane system (2 V) also was the smallest in which help in saving space and capital cost. For coagulation and flocculation, the reactor was still in laboratory phase and done in batch system. However, it is worth noting that coagulation and flocculation manage to remove 95% of color from POME with 4 h of settling time. The same trend was usually observed for biological method as the removal of color is relatively high but with also high retention time. In terms of cost, proposed integrated EC-membrane (2 V) has shown the lowest total cost of MYR 2,788,598, followed by EC (6 V) with MYR 3,380,808 and biological method with MYR 8,468,490 over the span of 15 years. However, (Lok, Chan, & Foo, 2020) in their study manage to produce a positive revenue for the plant given the ability to recover valuable by-products such as biogas for resell purposes. This can be done in future studies given the potential for H2 and O2 gas recovery from EC process.
Method
Effluent flowrate
Reaction time
Colour removal
Plant Operating cost
References
EC
1000 m3/d
25 min
75%
MYR − 3,380,808
This study
EC-membrane
1000 m3/d
11 min
75%
MYR − 2,788,598
This study
Biological treatment
450 m3/d
7 days
–
MYR − 8,468,490
(Yeoh, 2005)
Biological treatment with biogas recovery
600 m3/h
50 days
–
MYR + 11,638,375
(Lok et al., 2020)
Coagulation and flocculation
1 L (batch)
4 h
95%
–
(Lanan, Selvarajoo, Sethu, & Arumugasamy, 2021)
4 Conclusions
In conclusion, the experimental data shows that the color removal efficiency of POME by EC method increase with time and with the increasing of voltage. By comparing the experimental result, integrated EC-membrane shows excellent comparable results at 1 V and 2 V with EC standalone method at voltage higher than 4 V. 75% removal of color for 1 V and 2 V are achievable when using integrated system whereby in EC method, at least 4 V and 60 min are required to achieve such removal efficiency. For model development, both model for EC and integrated EC-membrane method shows a good fit and able to be used for further efficiency calculation. Each model shows an adjusted RSq of higher than 0.8 and a p-value of lower than 0.05 indicates the model fits well. The economic analysis performed shows that integrated EC-membrane method at 2 V has slightly higher capital cost needed but much lower operating cost per year compared to EC method 6 V. Low voltage supplied in integrated system helps the operating cost in terms of electrode and energy consumption remain below EC method even at the first year of implementation. The total cost calculated in 15 years period has observed a possible reduction cost as much as 21.24% (RM 592,210) from EC method. Comparison with conventional biological method with biogas recovery has proven that integrated EC-membrane possess lower operating and capital cost. The production of valuable gaseous such as hydrogen and oxygen gas during EC process could be one of the interesting profitable sources that should be address in future prospect. It can be said that the proposed method has a good potential in industrial application especially treatment of POME.
Acknowledgement
The authors would like to thank the Researchers Supporting Project No. (RSP-2021/138) King Saud University, Riyadh, Saudi Arabia.
Declaration of Competing Interest
The authors declare that they have no known competing financial interests or personal relationships that could have appeared to influence the work reported in this paper.
References
- Improving performance of electrospun nylon 6, 6 nanofiber membrane for produced water filtration via solvent vapor treatment. Polymers. 2019;11(12):2117.
- [Google Scholar]
- Treatment of palm oil mill effluent using membrane bioreactor: novel processes and their major drawbacks. Water. 2018;10(9):1165.
- [Google Scholar]
- Abdurakhman, Y., Putra, Z., Bilad, M., Nordin, N., Wirzal, M., Muraza, O. J. A. J. f. S., & Engineering. (2018). Producing biodiesel from waste cooking oil with catalytic membrane reactor: process design and sensitivity analysis. 43(11), 6261-6269.
- Abdurakhman, Y. B., Putra, Z. A., Bilad, M. R., Nordin, N. A. H. M., Wirzal, M. D. H. J. C. E. R., & Design. (2018). Techno-economic analysis of biodiesel production process from waste cooking oil using catalytic membrane reactor and realistic feed composition. 134, 564-574.
- Comparative study on characterization of Malaysian palm oil mill effluent. Res. J. Chem. Sci.. 2012;2(12):11-15.
- [Google Scholar]
- Effect of operating parameters on decolourisation of palm oil mill effluent (POME) using electrocoagulation process. Pertanika J. Sci. Technol.. 2017;25:197-206.
- [Google Scholar]
- Removal of organic pollutants in industrial wastewater with an integrated system of copper electrocoagulation and electrogenerated H2O2. Chemosphere. 2014;105:160-164.
- [CrossRef] [Google Scholar]
- Polishing of treated palm oil mill effluent (POME) from ponding system by electrocoagulation process. Water Sci. Technol.. 2016;73(11):2704-2712.
- [CrossRef] [Google Scholar]
- Post treatment of palm oil mill effluent using electro-coagulation-peroxidation (ECP) technique. J. Cleaner Product.. 2019;208:716-727.
- [CrossRef] [Google Scholar]
- Tackling membrane fouling in microalgae filtration using nylon 6,6 nanofiber membrane. J. Environ. Manage.. 2018;223:23-28.
- [Google Scholar]
- Comparison of electrocoagulation using iron and aluminium electrodes with chemical coagulation for the removal of a highly soluble acid dye. Desalination. 2011;281:285-292.
- [CrossRef] [Google Scholar]
- Comparative study on the removal of COD from POME by electrocoagulation and electro-Fenton methods: Process optimization. IOP Conf. Series: Mater. Sci. Eng.. 2018;334
- [CrossRef] [Google Scholar]
- Chen, L., Wu, Y., Dong, H., Meng, M., Li, C., Yan, Y., . . . Technology, P. (2018). An overview on membrane strategies for rare earths extraction and separation. 197, 70-85.
- Choong, Y. Y., Chou, K. W., Norli, I. J. R., & Reviews, S. E. (2018). Strategies for improving biogas production of palm oil mill effluent (POME) anaerobic digestion: A critical review. 82, 2993-3006.
- Eliseus, A., Putra, Z., Bilad, M., Nordin, N., Wirzal, M., Jaafar, J., & Khan, A. L. J. A. R. (2018). Energy minimization of a tilted panel filtration system for microalgae filtration: Performance modeling and optimization. 34, 104-115.
- Coagulation as pretreatment for membrane‐based wetland saline water desalination. Asia‐Pac. J. Chem. Eng.. 2020;15(4)
- [Google Scholar]
- Techno-economic analysis for the electrocoagulation of fluoride-contaminated drinking water. Toxicol. Environ. Chem.. 2011;93(3):424-437.
- [CrossRef] [Google Scholar]
- Integrated electrocoagulation and membrane filtration for PAH removal from realistic industrial wastewater: effectiveness and mechanisms. RSC Adv.. 2017;7(83):52366-52374.
- [Google Scholar]
- Electrocoagulation process in water treatment: A review of electrocoagulation modeling approaches. Desalination. 2017;404:1-21.
- [CrossRef] [Google Scholar]
- Validation of a Europe-wide electricity system model for techno-economic analysis. Internat. J. Electr. Power Energy Syst.. 2020;123
- [Google Scholar]
- Application of electrocoagulation process for decolourisation of palm oil mill effluent (POME) Nat. Environ. Pollut. Technol.. 2018;17(4):1267-1271.
- [Google Scholar]
- Decolorizing methyl orange by fe-electrocoagulation process—A mechanistic insight. Internat. J. Environ. Chem.. 2018;2(1):18.
- [Google Scholar]
- Electrospun nylon 6, 6 membrane as a reusable nano-adsorbent for bisphenol A removal: Adsorption performance and mechanism. J. Colloid Interface Sci.. 2017;508:591-602.
- [Google Scholar]
- Utilisation of natural plant-based fenugreek (Trigonella foenum-graecum) coagulant and okra (Abelmoschus escluentus) flocculant for palm oil mill effluent (POME) treatment. J. Environ. Chem. Eng.. 2021;9(1)
- [Google Scholar]
- Water recycling from palm oil mill effluent (POME) using membrane technology. Desalination. 2003;157(1):87-95.
- [CrossRef] [Google Scholar]
- Lee, M. D., Osman, M. S., Wong, G. K., & Ngu, H. J. Chemical Oxygen Demand Reduction in Palm Oil Mill Effluent Treatment with Chitosan and Ferric Chloride.
- Performance of chitosan as natural coagulant in oil palm mill effluent treatment. In: Wastewater Treatment. IntechOpen; 2020.
- [Google Scholar]
- Lo, C. H., McAdam, E., & Judd, S. (2018). The cost of a small MBR , WST-EM 15827 1 The cost of a small membrane bioreactor.
- Simulation and optimisation of full-scale palm oil mill effluent (POME) treatment plant with biogas production. J. Water Process Eng.. 2020;38
- [Google Scholar]
- Ma, J., Ping, D., & Dong, X. J. M. (2017). Recent developments of graphene oxide-based membranes: a review. 7(3), 52.
- Malaysia electricity prices. (2019). Retrieved from https://www.globalpetrolprices.com/Malaysia/electricity_prices/#:∼:text=Malaysia%2C%20December%202019%3A%20The%20price,of%20power%2C%20distribution%20and%20taxes.
- Improved nylon 6, 6 nanofiber membrane in a tilted panel filtration system for fouling control in microalgae harvesting. Polymers. 2020;12(2):252.
- [Google Scholar]
- A model for cost estimation of system for piggery wastes treatment ponds: a case study. Pesquisa Operacional. 2003;23:463-473.
- [Google Scholar]
- Treatment of palm oil mill effluent by electrocoagulation with presence of hydrogen peroxide as oxidizing agent and polialuminum chloride as coagulant-aid. Water Resour. Indust.. 2017;17:7-10.
- [CrossRef] [Google Scholar]
- Techno-economic analysis of electrocoagulation on water reclamation and bacterial/viral indicator reductions of a high-strength organic wastewater—anaerobic digestion effluent. Sustainability. 2020;12(7):2697.
- [Google Scholar]
- Integrated membrane-electrocoagulation system for removal of celestine blue dyes in wastewater. Membranes (Basel). 2020;10(8):184.
- [Google Scholar]
- Removal color from Palm Oil Mill Effluent (POME): Electrocoagulation Method vs Microfiltration using Nanofiber Membrane. Internat. J. Electrochem. Sci.. 2020;15:11283-11293.
- [CrossRef] [Google Scholar]
- Applicability and costs of nanofiltration in combination with photocatalysis for the treatment of dye house effluents. Beilstein J. Nanotechnol. 2014;5:476-484.
- [CrossRef] [Google Scholar]
- Sani, K., Kongjan, P., Pakhathirathien, C., Cheirsilp, B., Sompong, O., Raketh, M., . . . Jariyaboon, R. J. J. o. W. P. E. (2020). Effectiveness of using two-stage anaerobic digestion to recover bio-energy from high strength palm oil mill effluents with simultaneous treatment. 101661.
- Sinnott, R. K. (2005). Chemical Engineering Design (4 Ed.): ELSEVIER BUTTERWORTH HEINAMANN.
- Chemical process design and integration. In: Centre for Process Integration, School of Chemical Engineering and Analytical Science. University of Manchester: John Wiley & Sons Ltd.; 2005.
- [Google Scholar]
- Chemical Process: Design And Integration. John Wiley & Sons; 2005.
- Mechanistic models of electrocoagulation kinetics of pollutant removal in vinasse waste. Effect Vol.. 2020;36:101312
- [Google Scholar]
- Tan, Y. D., & Lim, J. S. (2019). Feasibility of palm oil mill effluent elimination towards sustainable Malaysian palm oil industry. 111, 507-522.
- Wastewater Technology Fact Sheet Anaerobic Lagoons. (2002). In: United States Environmental Protection Agency.
- Wirzal, M. D. H., Sathishkumar, P., Alshahrani, L. A., Yusoff, A. R. M., Gu, F. L., Qureshi, M. S., . . . Khokhar, F. M. J. C. P. (2020). Nifedipine degradation by an electro-oxidation process using titanium-based RuO 2–IrO 2–TiO 2 mixed metal oxide electrode. 1-10.
- Wirzal, M. D. H., Yusoff, A. R. M., Zima, J., & Barek, J. J. I. J. o. E. S. (2013). Degradation of ampicillin and penicillin G using anodic oxidation. 8, 8978-8988.
- Xing, J., Liang, H., Chuah, C. J., Bao, Y., Luo, X., Wang, T., . . . Snyder, S. A. J. W. r. (2019). Insight into Fe (II)/UV/chlorine pretreatment for reducing ultrafiltration (UF) membrane fouling: Effects of different natural organic fractions and comparison with coagulation. 167, 115112.
- Treatment of industrial estate wastewater by the application of electrocoagulation process using iron electrodes. J. Environ. Manage.. 2018;207:151-158.
- [CrossRef] [Google Scholar]
- Yeoh, B. J. I. E. J. (2005). A technical and economic analysis of heat and power generation from biomethanation of palm oil mill effluent. 6.
- A reusable electrospun PVDF-PVP-MnO2 nanocomposite membrane for bisphenol A removal from drinking water. J. Environ. Chem. Eng.. 2018;6(5):5801-5811.
- [Google Scholar]
- A review on the development of palm oil mill effluent (pome) final discharge polishing treatments. J. Oil Palm Res.. 2018;29(4):528-540.
- [CrossRef] [Google Scholar]
- Membrane technologies for microalgal cultivation and dewatering: Recent progress and challenges. Algal Res.. 2019;44:101686
- [CrossRef] [Google Scholar]


