

Translate this page into:
Synthesis, printing applications and electrochemical removal of CQAPDN disperse dye incorporating quinoline moiety
⁎Corresponding authors at: Applied Sciences Department, Higher College of Technology, University of Technology and Applied Sciences, PO Box 74, Al-Khuwair, 133 Muscat, Oman (K.M. Hassan). drkhalidhassan73@el-eng-menofia.eg (Khalid Mahmoud Hassan), ibrahimtantawy@yahoo.co.uk (Ibrahim ElTantawy ElSayed)
-
Received: ,
Accepted: ,
This article was originally published by Elsevier and was migrated to Scientific Scholar after the change of Publisher.
Peer review under responsibility of King Saud University.
Abstract
A new heterocyclic azodye 4-({4-[(7-Chloroquinolin-4-yl)amino]phenyl}diazenyl)naphthalen-1-ol (CQAPDN) was synthesized by diazotization of 7-chloroquinolin-4-yl)benzene-1,4-diamine; followed by coupling with α-naphthol. Its structure was elucidated by spectroscopic techniques. Dyeing performance on polyester fibers was assessed. The color strength measurements and fastness properties exhibited good results. The electrochemical behavior of the CQAPDN was studied using cyclic voltammetry technique in a mixed solvent of perchloric acid and acetonitrile at glassy carbon electrode modified with poly1,5-diaminonaphthalene. The modified electrode showed excellent electrocatalytic activity toward electrochemical determination of CQAPDN with low detection and quantification limits of 0.00169 and 0.00565 µM. The azo-removal was studied using controlled potential electrolysis technique at 0.20 V. The decolorization efficiency was assessed through UV/Vis studies confirming that the azo-group was destroyed.
Keywords
Azodye
Cyclic voltammetry
Modified electrode
Degradation

1 Introduction
Azo-disperse dyes are one of the most important classes of synthetic dyes (Patil et al., 2015). They became widely spread in medical (Mallikarjuna and Keshavayya, 2020), industrial and biological fields (Kokkonen et al., 2021). It is interesting to study new azo-compounds derived from aminoquinoline moiety due to their variety applications (Ilina and Henary, 2021). Disperse dyes with specific molecular weight are used for printing fabrics such as polyester, acrylic and acetate. They are common in printing polyester due to their large range in fastness properties and brilliancy (Rizk et al., 2017). These dyes diffused into fibers depending on a surfactant which used in the paste preparation and heat treatment.
Incorporation amounts of water and chemicals in the staining operations and washing of the textile industry lead to formation unfixed dyes with major environmental pollution (Yaseen and Scholz, 2019, Patti et al., 2021). Their safe and effective removal procedures by different instrumental and analytical techniques are an important issue (Yue et al., 2014, Mahmoudian et al., 2021).
Due to the larger use of electrochemistry on a lot of fields (Al-Enizi et al., 2020a, Al-Enizi et al., 2020b, Ubaidullah et al., 2020a, Ubaidullah et al., 2020b, Ubaidullah et al., 2021), the electro-chemical removal process of azo-compounds was found to be an attractive method due to safety, high efficiency and low chemicals consumption (Palanisamy et al., 2020, Patti et al., 2021).
In this work, we aim to construct a quinoline azo-disperse dye and study its industrial applications on textile fibers as well as clean electrochemical degradation.
2 Experimental
2.1 Instrumentation and methodology
NMR spectra were recorded on a JEOL ECA500 FT NMR spectrometer at 500 for proton and 125 MHz for carbon using dimethyl-sulfoxide (DMSO‑d6). Chemical shifts were recorded in δ ppm. Fourier transform infrared (FT-IR) spectrum was measured using Thermo Fisher Nicolet IS10. Electron impact ionization mass spectrum (EI-MS) was obtained on a Thermos Scientific Trace 1310. Stuart scientific apparatus was used for melting point (m.p.) determination. The compound 7-chloroquinolin-4-yl)benzene-1,4-diamine (3) was prepared according to literature (Sayed, 2011).
Electrochemical experiments were conducted using Potentiostat Voltammetric Analyzer, CV50W software from BAS. They were achieved in three-electrode electrochemical cell including GC or p1,5-DAN-GC modified electrodes (working electrode), Ag/Ag+ (reference electrode) and platinum wire (counter one). UV/Vis measurements were assessed using both Perkin-Elmer UV/Vis spectrophotometer, or Spectrophotometer UV/Vis T80 double beam with software UV Win5.
2.2 Chemicals and reagents
4,7-Dichloroquinoline (99.0%), 1,4-phenylenediamine (99.0%) and monomer 1,5-DAN (97.0%) were purchased from Sigma Aldrich. Salicylaldehyde (99.0%), α- napthol (α-NAP) (99%), triethylamine (Et3N) (99.0%), ethanol (EtOH) (99.0%), concentrated hydrochloric acid (conc. HCl) (35.4%), sodium nitrite (NaNO2) (98.0%), sodium dihydrogen phosphate (98.0%), sodium carbonate (Na2CO3) (99.0%), acetonitrile (ACN), perchloric acid (PCA) (70.0%) and sodium lignosulphonate (99.5%) were bought from LOBA Chemie. Lyprint (sodium salt of nitrobenzene-sulfonic acid) was supplied by BASF Company. Polyester (150 g/m2) was from Egyptian and developing Co.
2.3 Synthetic method for CQPDN (6)
2.3.1 Diazonium salt formation
(7-chloroquinolin-4-yl)benzene-1,4-diamine (CQBD) (compound 3)) (0.27 g, 1.0 mmol) was mixed with conc. HCl (2.0 mL) under stirring in an ice bath, followed by slowly addition of an aqueous NaNO2 (0.069 g, 1.0 mmol) in (3.0 mL water). Little quantity of ice blocks was added to the mixture avoiding diazonium salt decomposition (labelled 4, Scheme 3) and the mixture was stirred for 30 min.
2.3.2 Coupling formation
The α-NAP 5 (0.144 g, 1.0 mmol) was placed in a separate glass beaker, dissolved in EtOH (5.0 mL) and cooled to 0–5 °C, then Na2CO3 solution (1.0 g, 10.0 mmol) was added followed by stirring in an ice bath while the cold 4 solution was added dropwise on naphthalic mixture 5. The mixture was allowed to stand in an ice bath for 2 hrs with stirring. It was filtered, washed by distilled water and dried affording azo-compound 6 in excellent yield.
Yellow powder; yield (0.66 g, 66%); m.p (190–192 °C); FT-IR (cm−1) = 3676–3147 (OH), 3421(NH), 1570 (C = C), 1528 (C = N), 1446 (N = N). 1H NMR: δ = 7.04 (d, 2H, J = 10.0 Hz, CHAr), 7.24 (d, 2H, J = 5.0 Hz, CHAr), 7.49–7.73 (m, 5H, CHAr), 8.47 (d, J = 10.0 Hz, 2H, CHAr), 8.58 (d, J = 5.0 Hz, 2H, CHAr), 8.91 (d, 2H, J = 10.0 Hz, CHAr), 9.53 (br. s, 1H, NH), 11.11 (br. s, 1H, OH). 13C NMR: δ = 103.77, 114.53, 118.86, 121.31, 121.69, 122.05, 122.63, 122.89, 123.82, 124.18, 124.75, 124.75, 125.10, 125.37, 125.84, 126.41, 127.40, 127.84, 128.71, 125.46, 130.30, 132.58, 134.27, 149.27, 151.89. EI-MS (m/z) (C25H17ClN4O): calcd, 424; found: 424 [M+].
2.4 Textile printing method
2.4.1 Preparation of printing paste
A 4.0 g of dye and 1.0 g of sodium lignosulfonate as a dispersing agent (Increasing dye solubility) were mixed at 60 °C for 15 mins. Addition of 75.0 g thickener (Giving stickiness and plasticity), 3.0 g lyprint (Controlling the paste amount transferring to the fabric), 5.0 g sodium dihydrogen phosphate (Reduction clearing), and 12.0 g water were carried out. The total composition of the paste equals 100.0 g according to screen printing method (Novaković et al., 2016). Drying at room temperature followed by thermo-fixation at 180 °C for 4 mins. The prints were rinsed in hot water followed by cold water then soaped with 2.0 g/L nonionic detergent at 60 °C for 30 mins.
2.5 Electrochemistry
2.5.1 Preparation of p1,5-DAN-GC modified electrode
P1,5-DAN-GC modified electrode was performed by electro-polymerization of 1.50 mM (0.0012 gm) of 1,5-DAN monomer in an aqueous solution of 1.0 M (5.0 mL) PCA at GC electrode using repetitive 15 cycles between 0.00 and 0.80 V (vs. Ag/AgCl) at sweep rate 20 mV/s using CV technique (Hassan et al., 2014a; Hassan et al., 2014b; Hassan et al., 2018, Khalifa et al., 2020).
2.5.2 Electrochemical measurements
The electrochemical measurements of 1.0 mM CQAPDN were achieved using electro reduction–oxidation method in the potential range − 0.30 and 1.60 V using CV technique in a mixed solvent of 1.0 M of PCA: ACN at sweep rate 100 mV/s at p1,5-DAN-GC modified electrode.
Non-aqueous medium (ACN) with small portions of PCA as a supporting electrolyte was used to avoid attacking with water which is responsible for irregular morphology and weak properties, and to get more porous homogenous polymer with better conduction (Unsworth et al., 1992, Hassan et al., 2014a; Hassan et al., 2014b, Hassan et al., 2019).
2.5.3 Electrochemical removal of the azo-compound
CPE technique was applied for the removal of CQAPDN using different applied potentials at different time intervals (Tsemeugne et al., 2017). These experiments were followed by UV/Vis measurements.
3 Results and discussion
3.1 Chemistry
CQBD (3) was obtained throughout reaction of 4,7-dichloroquinoline (1) with equimolar ratio of 1,4-phenylenediamine (2) dissolved in EtOH using Et3N as a base under reflux for 14–16 hrs affording (3) in a good yield.
The suggested mechanism involves the nucleophilic aromatic substitution of chloride at C-4 position in quinoline ring nitrogen via a resonance-stabilized intermediates A and B affording CQBAD 3 (Scheme 1).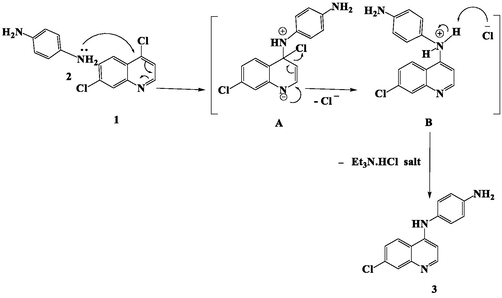
Mechanism of CQBD (3).
The formation of 4-((7-chloroquinolin-4-yl)amino)benzene diazonium chloride (CQAB diazonium chloride (4)) (Scheme 2) includes reaction of CQBD with NaNO2 solution under an acidic medium.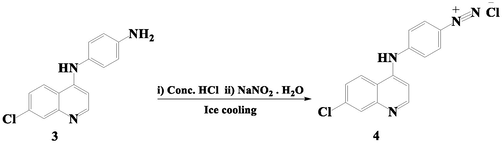
CQAB diazonium chloride (4) formation.
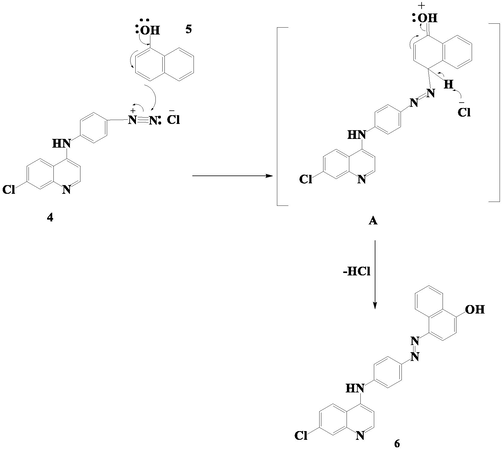
Suggested mechanism of CQAPDN (6).
CQAB diazonium chloride compound was coupled with α-NAP (5) through electrophilic substitution reaction. The hydroxyl group directs the diazonium salt to para-position in α-NAP under basic condition to form intermediate A. Further proton elimination from the 4-position of the phenolic ring affording CQAPDN (6) in excellent yield (Scheme 3).
The FT-IR spectrum (Fig. 1) showed broad band at 3676 to 3047 cm-1 assigning for (NH + OH) overlapped. While, absorption bands display at 1570 and 1528 cm-1 corresponding to the C⚌C and C⚌N groups, respectively. The characteristic absorption band appears at 1446 cm-1 relating to (-N = Nstr) group. These results consistent with previously reported (Prakash et al., 2021).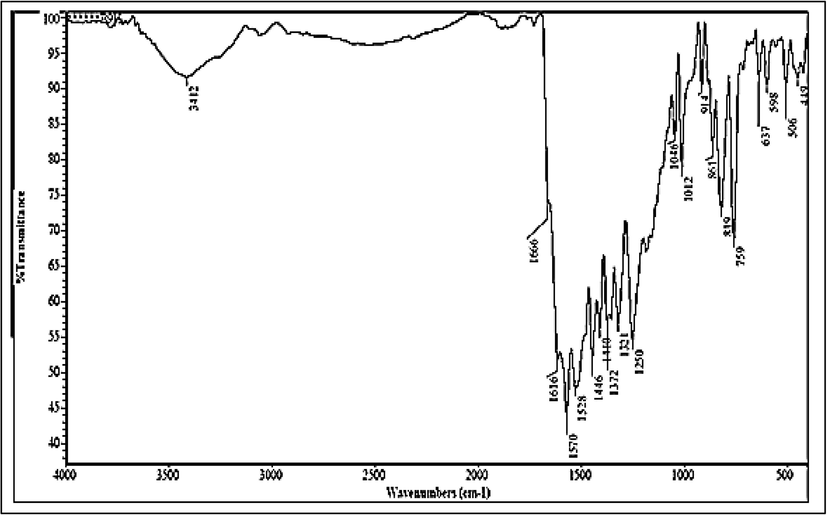
FT.IR of CQAPDN.
1H NMR spectrum (Fig 0.2, a) displays two doublet aromatic protons at δ 7.04 and 7.24 ppm with (J = 10.0 and 5.0 Hz), respectively relating to quinoline ring. In addition, multiplet display at δ 7.49–7.73 ppm assigning to protons of phenyl and naphthoyl rings. While, the two doublets appear at δ 8.47 and 8.58 ppm with (J = 10.0 and 5.0 Hz), respectively assigning to aromatic protons of quinoline and naphthoyl ring in close vicinity of —N⚌N— group, the doublet at δ 8.91 ppm with (J = 10.0 Hz) corresponds to imine —CH⚌N proton in quinoline ring. Finally, broad singlet protons appear at δ 9.53 and 11.11 ppm assigning to NH and OH groups, respectively which disappear in D2O exchange experiment as a result of proton deuterium exchange (Fig. 2, b) comparing with previously reported (Patil et al., 2015).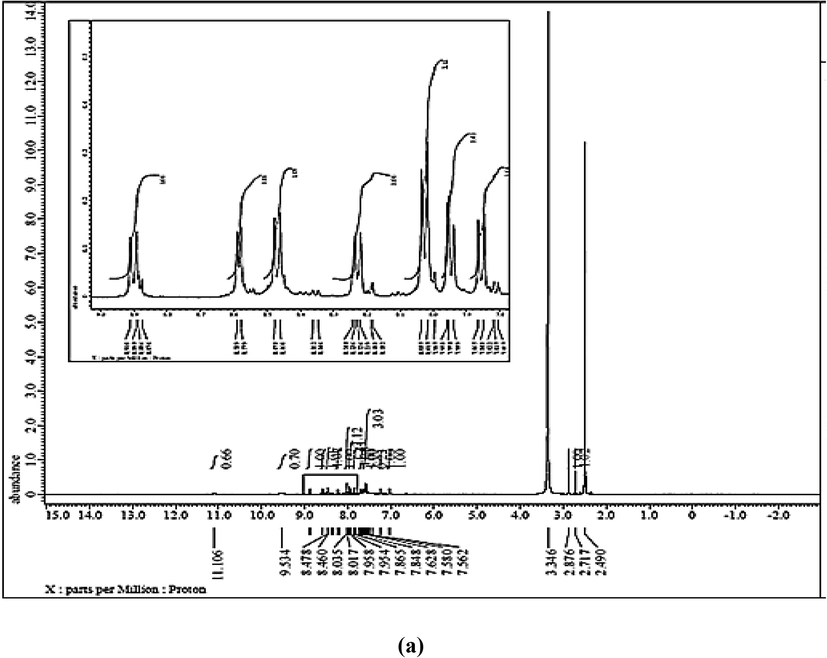
(a, b) 1H NMR with and without D2O and (c) 13C NMR of CQAPDN.
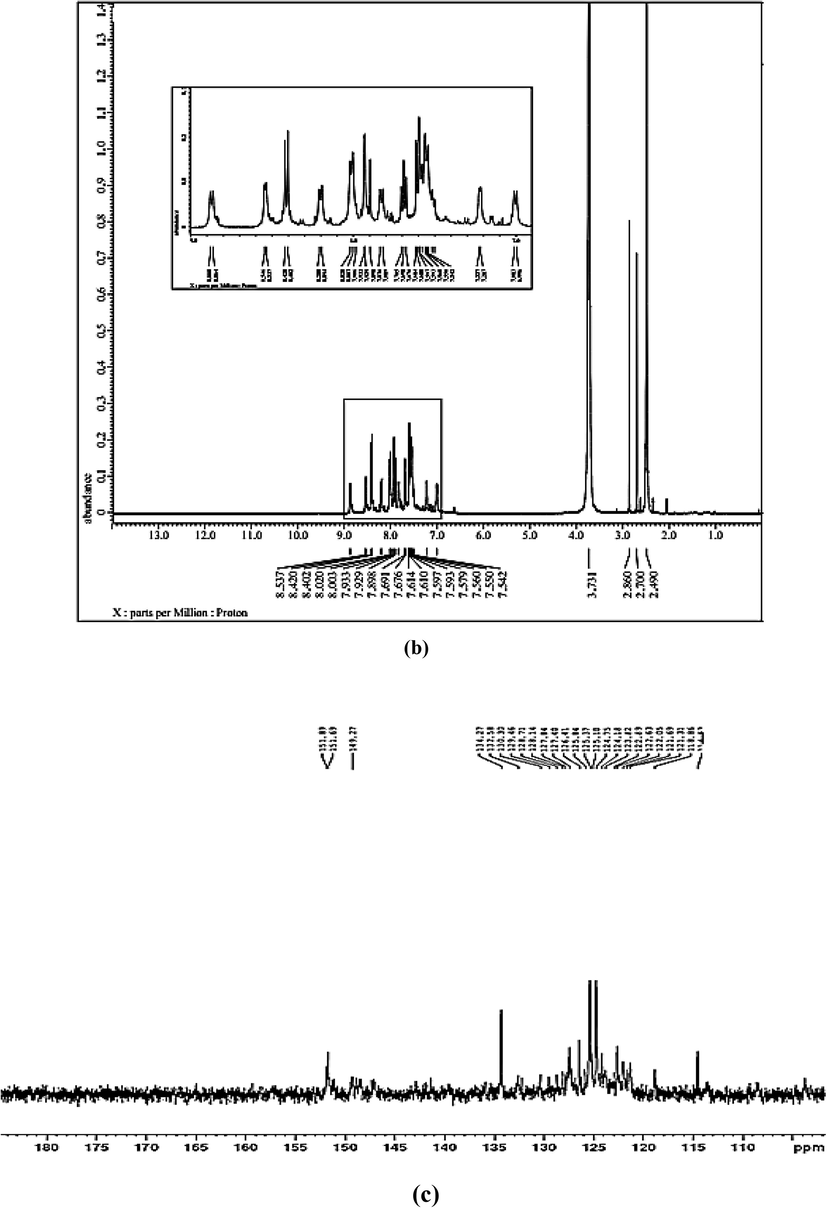
(a, b) 1H NMR with and without D2O and (c) 13C NMR of CQAPDN.
13C NMR spectrum (Fig. 2, c) indicates multiplet signals at δ: 103.77 to 134.27 ppm relating to 23 aromatic ring carbons. While, the two down field signals at δ: 149.27 and 151.89 ppm corresponding to —C⚌N and —C⚌C—OH comparing with previously data (Patil et al., 2015).
EI-MS shows ion peaks at m/z: 424 (50%, C25H17ClN4O, M+), 420 (80%, C25H13ClN4O∙+), 143 (80%, C10H7O∙+) and 94 (100%, C5H6N2∙+) which matches with molecular structure comparing with published dyes (Elborai et al., 2016).
3.2 Color strength (K/S) measurements
The colorimetric data for compound (6) were detected using light reflectance technique. K/S was expressed using Kubelka-Munk equation (1).
Dye 6 has yellow color shade at λmax equal 410 nm with K/S equal 12.33. K/S produces high value depending on the chemical structure and the nature of the substitute combined with the quinoline azo moiety and high conjugation. Lightness (L*) equals 30.33 represents the dye deep color since the low L*value, the color deep will be (Jabar et al., 2020). Chroma (c*) and hue angle (h°) are equal 31.77 and 33.88°, respectively and obtained from the following equations (Luo, 2014).
Hue angel is shifted to reddish-yellowish direction corresponding to the positive values of a* (25.66) and b* (17.46). As a* (red–green axis) (+a*= redder, −a*= greener) and b* (yellow–blue axis) (+b*= yellower, −b*= bluer).
3.3 Fastness properties
Fastness properties were assessed using the standard ISO methods (Valldeperas-Morell and Carrillo-Navarrete, 2012).
3.3.1 Washing fastness
The washing fastness depend on movement rate of the prepared dyes out of polyester fabric during washing, the dye solubility in water and dye molecular size which affects the nature of the mechanical link between the dye and the fibers. The staining on cotton and the color alternation of the printed CQAPDN are good to excellent results (3–5) according to gray scale (1–5). This is attributed to that the dye was entrapped inside the inter-polymer space of a polyester fiber (Patel et al., 2013).
3.3.2 Perspiration fastness
Perspiration fastness (alkali and acidic solutions) refers to a dyed fabric's ability to resist fading and staining when it is perspired. The alternation in color and the staining on cotton of the dye rated as very good to excellent results (4–5) comparing with gray scale as the larger in molecular weight, the lower rate of dye removal (Patel et al., 2013).
3.3.3 Rubbing fastness
Rubbing fastness (dry and wet) determines the degree of color which transferred from the surface of a colored fabric. The printed dye (6) showed very good to excellent results rating 4–5. This due to the good diffusion of dye inside the fiber (Patel et al., 2013).
3.3.4 Light fastness
Light fastness determines the dyes resistance and fading when exposed to steady light. The azo-printed dye (6) showed excellent result (7) accordance to the blue scale (1–8). This due to the presence of terminal chlorine (Electron withdrawing group) in the structure of dye which increases the brightness (Al-Etaibi and El-Apasery, 2020).
3.3.5 Sublimation fastness
The dye-printed sample was placed between two undyed cotton and polyester fabric pieces for 1 min at both 180 and 210 °C. The disperse-dye migration from the surface of polyester fabric depends on the temperature of the heat treatment. Color changing was measured according to the gray scale (1–5). Sublimation fastness indicated good to excellent result (3–5) due to the presence of the polar substituent groups (OH and NH) in the dye moiety (Karcı, 2005).
3.4 Electrochemical measurements
3.4.1 Electrochemical behavior of CQAPDN
The electrochemical behavior of 1.0 mM CQAPDN compound was studied using both GC and p1,5-DAN-GC electrodes using CV technique in the region between +1.60 and −0.30 V at sweep rate 100 mV/s.
At GC electrode (initially), no electrochemical response was detected in absence of CQAPDN (Fig. 3 curve a (black line)). In presence of 1.0 mM CQAPDN compound, (Fig. 3, curve b (blue line)), a reduction peak (P1) at +0.14 V with cathodic peak current equal 26.80 µA was detected in the negative scan related to the (—N⚌N—) reduction presents in the CQAPDN compound giving the reduced amino products, the (7-chloroquinolin-4-yl)benzene-1,4-diamine (CQPDA) (I), and, the 4-aminonaphthalen-1-ol (II) (Scheme 4) (Tsemeugne et al., 2017). In the positive scan, an anodic peak (P2) at +0.98 V was detected with anodic peak current equal 11.66 µA related to the oxidation of (–OH) group giving the oxidized product (C⚌O), the naphthalene-1,4-dione (III) (Scheme 4) (Tsemeugne et al., 2017).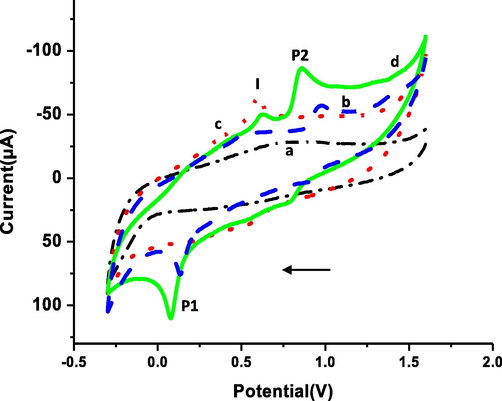
Electrocatalytic behavior of the: GC electrode in (a) absence, and (b) presence of 1.0 mM CQAPDN, and p1,5-DAN-GC modified electrode in (c) absence, and (d) presence of 1.0 mM CQAPDN.
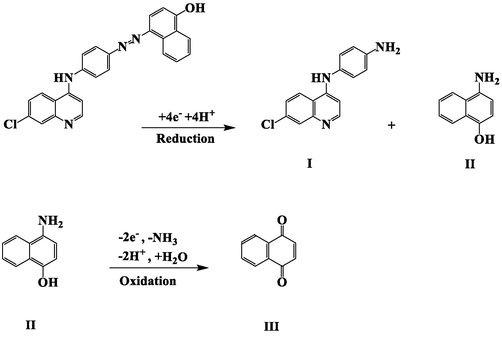
Reduction-oxidation mechanism of CQAPDN (6).
At the p1,5-DAN-GC modified electrode, in absence of the target molecule, (Fig. 3, curve c (red line)), no electrochemical response was detected in the negative scan. In the positive scan, the normal electro-oxidation response of the polymer layer at +0.60 V with a current equal 26.2 µA (peak I) was detected. In presence of 1.0 mM CQAPDN (Fig. 3, curve d (green line)), the azo-group reduction peak (P1) was detected at +0.08 V with higher preferred current equal 38.37µA compared with that obtained at the GC electrode. On the positive scan, the anodic peak P2 was detected with enlarged anodic peak current equal 29.87 µA at +0.87 V related to (–OH) group to give the oxidized product (C⚌O) III as mentioned previously (Tsemeugne et al., 2017) with an extensive depression in the current of peak I due to the polymer layer (8.45 µA at +0.62 V). It is clear that the presence of the polymer layer improved the electro-response by providing high surface area with larger active sites leading to a higher electrochemical response (Hassan et al., 2018, Khalifa et al., 2020) of CQAPDN with shifting to lower potential for (–OH and —N⚌N—) groups.
3.4.2 Influence of potential scan rate
The influence of the potential scan rate (ν) on the electrochemical response of 1.0 mM CQAPDN was studied the range 100–300 mV/s in the experimental conditions at p1,5-DAN-GC modified electrode (Fig. 4). A gradual increase for both P1 and P2 peaks in a direct proportionality with ν was detected with regression equations Ipa = 24.95 + 0.059 × ν (for P1), and Ipc = 35.390 + 0.038 × ν (for P2), with both correlation coefficient (R2) values (0.9517 and 0.9628), respectively. Results reveals a direct proportionality of the square root of scan rate and the corresponding anodic peak current with regression equations Ipa = 13.97 + 1.63 × ν ½ and R2 = 0.9609 (Fig. 4. inset A). Conversely, peak current logarithm and scan rate logarithm got a linear relationship with a slope (0.308) which approved with diffusion controlled process (Bukkitgar and Shetti, 2016, Pattar and Nandibewoor, 2016) (Fig. 4. (inset B) with regression equation: log Ipa = 0.861 + 0.307 × log ν and R2 = 0.9668).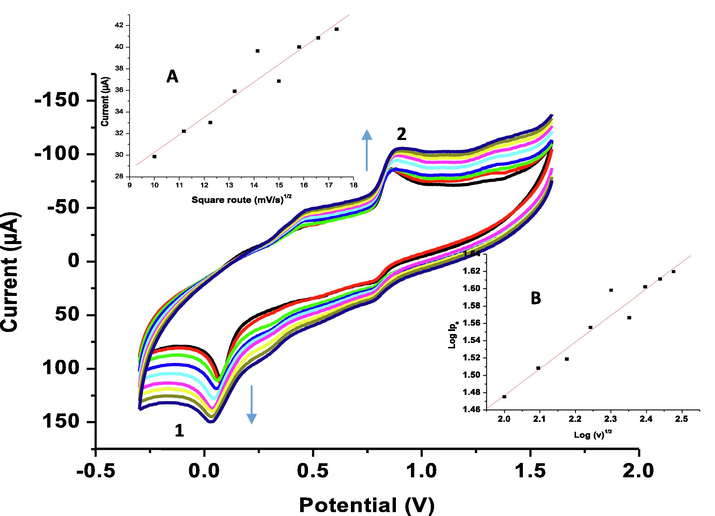
Cyclic voltammograms of the electrochemical responses of 1.0 mM CQAPDN in 1.0 M PCA:ACN at p1,5-DAN-GC modified electrode using different scan rates (100–300 mV/s). Inset A, relation between square root of scan rate and the anodic peak current. Inset B, relation between peak current logarithm and scan rate logarithm.
The electro-reduction reaction mechanism of CQAPDN at p1,5-DAN-GC modified electrode was studied by calculating the number of electrons transferred (n) using the linear relationship between peak potential (P1) and the ln ν value for an irreversible electrode process using Laviron equation 4:
Ep = Eo + (RT/αnF) ln (RT ko/αnF) + (RT/αnF) ln ν (4)where, F (faraday constant = 96,500C/mol), R (universal gas constant = 8.314 J/K/mol), T (temperature = 298 K), α (electron transfer coefficient = 0.5) for irreversible electrode process (Azab and Fekry, 2017), ko (standard rate constant) and Eo (formal potential). This equation could be expressed as: Ep = 0.02181 ln ν + 0.7698. Combination of both relations gives equation 5 (Fekry et al., 2019):
RT/αnF = slope
RT/αnF = 0.02181 (5)
n transferred was detected to be 2.3 ≈ 2.
The diffusion coefficient (D) of CQAPDN was calculated to be 1.834 10-12 cm2 s−1 using Randles-Sevcik equation 6:
Ip = 2.99 105 n3/2 A D1/2 ν1/2C (6)where Ip (anodic peak current of CQAPDN), A (surface area of p1,5-DAN-GC electrode = 0.268 cm2) (Hassan et al., 2018) and C (concentration of CQAPDN = 1.0 mM).
3.4.3 Effect of the CQAPDN concentration
The electro-reduction measurements of CQAPDN were studied at p1,5-DAN-GC modified electrode using scan rate 100 mV/s, as different concentrations of azodye labeled 6 (0.20, 0.40, 0.60, 0.80 and 1.0 mM) were detected in both cathodic and anodic peak currents. The cathodic peak currents increased from 13.4 to 30.74 µA according to increasing concentrations with regression equations Ipc = 8.99 + 22.72 × C (R2 = 0.987). The anodic peak currents also increased from 7.98 to 29.87 µA with increasing of concentrations. Its regression equation was calculated as Ipa = 0.23 + 25.35 × C (R2 = 0.919). From the explained results, the currents of both cathodic and anodic are directly protentional to the concentration (Fig. not shown).
Equations 7 and 8 were used to determine the limits of detection (LOD) and quantification (LOQ) were found to be 0.0017 and 0.0057 M, respectively.
LOD = 3 S/m (7)
LOQ = 10 S/m (8)
where S (standard deviation of the anodic peak current) and m (slope of the calibration curve for CQAPDN) (Hassan et al., 2019).
3.5 Electro-removal of the CQAPDN azo-compound residues
The electro-removal of 0.09 mM CQAPDN was studied at both GC sheet electrode (2.00 cm2) and GC sheet electrode modified with p1,5-DAN using CPE technique in 1.0 M PCA:ACN solution for different time intervals (60–240 mins) at 200 mV. The electrolysis progress was monitored by recording the cathodic peak current decay with a considerable decrease in solution color during experiment time (Table 1) until only background current was realized the CPE of CQAPDN indicates the decreasing in cathodic current from 7.946 to 3.953 μM by using GC sheet electrode and 9.536 to 0 μM by using p1,5-DAN-GC sheet electrode vs time. Reduction peak current diminished within four hours of electrolysis leading to the decolorization of the dye solution indicating progressive breaking of azo-group and consequently removal of the CQAPDN azo-compound (Fig. not shown).
Time taken for electrolysis (min)
Ipc (μM)
GC
p1,5-DAN -GC
00.0
7.946
9.536
60.0
6.936
8.163
120.0
5.991
4.321
180.0
5.068
3.295
240.0
3.953
00.00
UV/Vis measurements were recorded by withdrawing different compound samples from the electrolysis medium for each 60 min intervals to follow up the progress of reduction of azo-group through the electrochemical treatments. UV/Vis spectra of the CQAPDN compound were detected at λmax 574 nm. Absorbance decreased with the progress of electrolysis until the azo-group reduction peak completely diminished. The absorbance measurements of 0.09 mM CQAPDN before (dark blue color solution), and after (pale yellow color solution) electrochemical treatment (Fig. 5 (curves A and B, respectively)).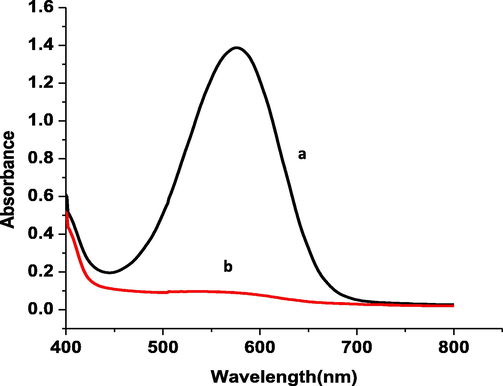
UV/Vis spectra of 0.09 mM CQAPDN (a) before, and (b) after CPE (at 200 mV for 240 mins) at p1,5-DAN /GC modified sheet electrode.
The decolorization effect of the dye solutions was calculated by the drop of their absorbance at the maximum visible wavelength (λmax = 574 nm). The percentage of decolorization efficiency (ƞ) was calculated using equation 9 (Ajaz et al., 2019):
η = (A0 – At / A0) *100 (9)where A0 (initial absorbance = 1.389) at λmax, and At (absorbance at λmax after CPE (0.102)). The ƞ value was found to be 92.65% which corresponds to a good decolonization effect.
4 Conclusion
This work summarized the synthesis and characterization of a new heterocyclic CQAPDN azo-dye containing quinoline chromophore. The synthesized dye was applied for printed silk-screen on polyester fabrics. Color measurements and fastness properties of the prepared dye exhibited very good results. Electrochemical studies at GC electrode and p1,5-DAN-GC modified electrode proved the priority of the last electrode for the electrochemical reduction of the CQAPDN compound. The diffusion coefficient, LOD and LOQ were determined. CPE technique showed high sensitivity for the removal of the desired azo-compound at p1,5-DAN-GC modified sheet electrode. UV/Vis measurements revealed significant detection band for azo-group with high monitoring of azo-cleavage during electro-removal process.
Table 2 shows a comparison of decolorization rate percentages of dyes degradation processes of the present and other dyes using different modified electrodes (Isarain-Chávez et al., 2013, Araújo et al., 2014, Yue et al., 2014, Mahmoudian et al., 2021). Results showed the efficiency of using the current modified electrode to be an alternative one for the removal of process.
Electrode substrate
Dye under investigation
Electrochemical process
Medium
% of decolorization
Ref.
Boron doped diamond (BDD) anode
Methyl orange
Electro-Fenton
Acidic medium
80
(Isarain-Chávez et al., 2013)
Platinum supported on titanium (Ti/Pt) (anode).
Mixture of Novacron Yellow (NY) and Remazol Red (RR)
Anodic oxidation
Aqueous solution
90
(Araújo et al., 2014)
Double-layered reactor, Ti/RuO2-IrO2) anode and graphite cathode
Acid Red3R
Electro-Fenton
Acidic medium
77.2
(Yue et al., 2014)
Ti/nanoZnO-MWCNTs nanocomposite
Acid Red33 (AR33), Reactive Orang7 (RO7), Acid Yellow3 (AY3) and Malachite Green (MG)
Indirect electrochemical oxidation
Aqueous solution
43.11, 25.98, 27.21 and 100 for Ar33, RO7, AY3 and MG, respectively
(Mahmoudian et al., 2021)
PANI/TiO2 nanocomposite
Congo red (CR)
Applied potential
Aqueous solution
82–92.23
(Emran et al., 2018)
p1,5-DAN-GC
CQAPDN
Applied potential
Mixed solvent
92.65
Current work
Acknowledgment
Authors acknowledge support and funding of King Khalid University; grant no: KKU/RCAMS/007/21.
Declaration of Competing Interest
The authors declare that they have no known competing financial interests or personal relationships that could have appeared to influence the work reported in this paper.
References
- AMB Express. 2019;9(64):1-12.
- [CrossRef]
- J. Clean. Prod.. 2020;248:119251
- [CrossRef]
- Compos. B. Eng.. 2020;183:107655
- [CrossRef]
- Int. J. Environ. Res. Public Health. 2020;17(13)
- [CrossRef]
- Araújo, C.K., et al. (2014). ESPR. 21(16): 9777-9784, http://doi.org/10.1007/s11356-014-2918-4.
- RSC Adv.. 2017;7(2):1118-1126.
- [CrossRef]
- Anal. Sci. Technol.. 2016;7(1):1-9.
- [CrossRef]
- Fibers Polym.. 2016;17(5):729-737.
- [CrossRef]
- Emran, K., et al., 2018. Int. J. Electrochem. Sci. 13(2018): 5085-5095, https://doi.org/10.20964/2018.05.38.
- J. Electroanal. Chem.. 2019;848(1):113305
- [CrossRef]
- Hassan, K.M., et al., 2014. J. Electroanal. Chem. 728: 123–129, https://doi.org/10.1016/j.jelechem.2014.06.007.
- Microchim. Acta. 2019;186:1-10.
- [CrossRef]
- RSC Adv.. 2018;8(12):6346-6355.
- [CrossRef]
- J. Solid State Electrochem.. 2014;19(4):1063-1072.
- [CrossRef]
- Ilina, K., Henary, M., 2021. 27(13): 4230–4248, https://doi.org/10.1002/chem.202181361.
- Int. J.. 2013;8(2013):3084-3094.
- Valldeperas-Morell, J., Carrillo-Navarrete, F., 2012. 5 – Colour fastness. Understanding and Improving the Durability of Textiles. P. A. Annis, Woodhead Publishing: 82-103, https://doi.org/10.1533/9780857097644.1.82.
- Fash. Text.. 2020;7(1):1.
- [CrossRef]
- Color Technol.. 2005;121(5):275-280.
- [CrossRef]
- ACS Omega. 2020;5(30):18950-18957.
- [CrossRef]
- J. Mater. Chem. A.. 2021;9(17):10527-10545.
- [CrossRef]
- CIELAB. Encyclopedia of Color Science and Technology. In: Luo R., ed. Encyclopedia of Color Science and Technology. Berlin, Heidelberg: Springer Berlin Heidelberg; 2014. p. :1-7.
- [CrossRef] [Google Scholar]
- Mahmoudian, F., et al., 2021. 884: 115066, https://doi.org/10.1016/j.jelechem.2021.115066.
- J. King Saud Univ Sci.. 2020;32(1):251-259.
- [CrossRef]
- Novaković, D., et al., 2016. 15 – Screen Printing. Printing on Polymers. J. Izdebska and S. Thomas, William Andrew Publishing: 2016: 247–261, https://doi.org/10.1016/B978-0-323-37468-2.00015-4.
- J. Water Supply Res. T.. 2020;69(4):345-354.
- [CrossRef]
- J. Saudi Chem. Soc.. 2013;17(2):203-209.
- [CrossRef]
- Fibers Polym.. 2015;16(5):1068-1074.
- [CrossRef]
- Univ. Sci.. 2016;10(1):92-99.
- [CrossRef]
- Patti, A., et al. (2021). Polymers. 13(1): 134, http:doi.org/10.3390/polym13010134.
- Prakash, S., et al. (2021). 1224: 129016, https://doi.org/10.1016/j.molstruc.2020.129016.
- Arab. J. Chem.. 2017;10(2):S3303-S3309.
- [CrossRef]
- Sayed, I. (2011). Am. J. Sci. 7(10): 181-189, http://doi.org/10.13040/IJPSR.0975-8232.7(1).181–89.
- J. Chem. Biol.. 2017;11(1):119.
- [CrossRef]
- Mater. Lett.. 2020;266:127492
- [CrossRef]
- J. Energy Storage.. 2021;33:102125
- [CrossRef]
- J. King Saud. Univ. Sci.. 2020;32(4):2397-2405.
- [CrossRef]
- Synth. Met.. 1992;53(1):59-69.
- [CrossRef]
- IJEST. 2019;16(2):1193-1226.
- [CrossRef]
- J. Ind. Eng. Chem.. 2014;20(2):725-731.
- [CrossRef]


