

Translate this page into:
Synthesis, characterization and electrochemical properties of poly(phenoxy-imine)s containing peril and tert-butyl units
⁎Corresponding author. kayaismet@hotmail.com (İsmet Kaya)
-
Received: ,
Accepted: ,
This article was originally published by Elsevier and was migrated to Scientific Scholar after the change of Publisher.
Peer review under responsibility of King Saud University.
Abstract
Schiff bases were obtained by condensation reactions of 2-aminophenol and 4-aminophenol with 4-isopropenylcyclohex-1-ene-1-carbaldehyde (peril aldehyde) and 3,5-di-tert-butyl-2-hydroxy benzaldehyde. Then, polymers of these compounds were prepared via oxidative polymerization method in THF in the presence of NaOCl as an oxidant. The structures of compounds were confirmed by some techniques such as FT-IR, 1H NMR, 13C NMR and UV–vis. Moreover, cyclic voltammetry (CV) was used to calculate the HOMO−LUMO energy levels and electrochemical band gaps (Eg′) of compounds. Electrochemical band gaps (Eg′) values of P1, P2, P3 and P4 polymers were found as 2.61, 2.65, 2.89 and 2.28 eV, respectively. Furthermore, TGA and DSC were employed to determine thermal properties of the Schiff bases and polymers. The photoluminescence (PL) properties of polymers were also determined in DMSO. Then, we found that their number-average molecular weight (Mn), weight average molecular weight (Mw) as well as polydispersity index (PDI) values by the size exclusion chromatography (SEC). Finally, we carried out their solubility tests in acetone, THF, chloroform, acetonitrile, methanol, ethyl acetate, n-hexane and DMSO.
Keywords
Poly(phenoxy-imine)s
Poly(azomethine)
Oxidative polycondensation
Conjugated polymers

1 Introduction
Polyimines known as Schiff bases or poly(azomethine)s (Grigoras and Antonoaia, 2005) are of considerable interest because of their potential applications and valuable properties. Lately, polyimines conjugated polymers have attracted great attention due to their extraordinary optical, electrical and electrochemical properties (Simionescu et al., 1999). Conjugated polyimines or poly(Schiff bases) are an interesting class of conjugated polymers and they contain imine bonding (N⚌CH) in a polymer backbone (Yeh et al., 2016). It is known that conjugated poly(Schiff base)s that have evenly distributed nitrogen atoms in the polymer chain and aromatic or hetero aromatic rings possess lower electrical features. However, they studied to develop other characteristics such as the thermal stability. Conducting poly(Schiff base)s usually synthesized by polycondensation reactions (Simionescu et al., 1999). The oxidative polymerization method is basically the reaction of compounds containing —OH moieties and active functional groups (—CHO, —NH2, —COOH) with the oxidants like air, NaOCl and H2O2 in the aqueous alkaline medium (Mart et al., 2004). Polyimines, which contain conjugated bonding and active hydroxyl moieties, have investigated for more than 60 years, and used in several applications (Kaya and Koça, 2004). Conjugated polymers having extended п systems including alternating C⚌C and C—C bonds are predominant (Iwan and Sek, 2008).
This class of polymers was primarily electroactive as well as semi-conductive materials (Kaya and Bilici, 2006; Kaya and Bilici, 2007) and their conductivity can increased by doping with a dopant like iodine (Dineshkumar and Muthusamy, 2016). The conductivities of the undoped polymers found to be less than 10−9 S cm−1, while those doped with iodine were in the range of 10−7 and 10−6 S cm−1 (Iwan and Sek, 2008).
In this study, polyazomethine derivatives were synthesized by oxidative polycondensation reaction of 4-isopropenylcyclohex-1-ene-1-carbaldehyde (peril aldehyde) and 3,5-di-tert-butyl-2-hydroxy benzaldehyde compounds with 2-aminophenolor 4-aminophenol in an organic medium in the presence of NaOCl as an oxidant. The structures of all compounds were confirmed by FT-IR, UV–vis, 1H NMR and 13C NMR spectroscopy. Furthermore, thermal stabilities of the compounds were investigated by TG-DTA and DSC methods.
2 Experimental
2.1 Materials
4-Isopropenylcyclohex-1-ene-1-carbaldehyde (peril aldehyde) and 3,5-di-tert-butyl-2-hydroxy benzaldehyde were supplied from Aldrich. 2-Aminophenol was supplied from Alfa Aesar Chemical Co. Ethyl alcohol and methyl alcohol supplied from Sigma–Aldrich Chemical Co. Ethyl acetate, 4-aminophenol, n-hexane, sodium hypochlorite (10%, aqueous solution of NaOCl), chloroform, dimethylformamide, dimethyl sulfoxide, acetonitrile, toluene and tetrahydrofuran were supplied from Merck Chemical Co. (Germany).
2.2 Synthesis of the monomers (M1, M2, M3 and M4)
2,4-Di-tert-butyl-6{[(2-hydroxyphenyl)imino]methyl}phenol (M3) was synthesized according to the literature (Scheme 1) as follows: 2-aminophenol (2-AP) (1.09 g, 0.01 mol) and 3,5-di-tert-butyl-2-hydroxy benzaldehyde (3,5-DH) (2.34 g, 0.01 mol) were dissolved in 35 mL methyl alcohol in two separate beakers, which were then mixed at 70 °C. This mixture refluxed for 5 h in a two-necked flask and cooled to room temperature. The precipitate filtered, washed with ethanol and then dried under reduced pressure (Nishat et al., 2011).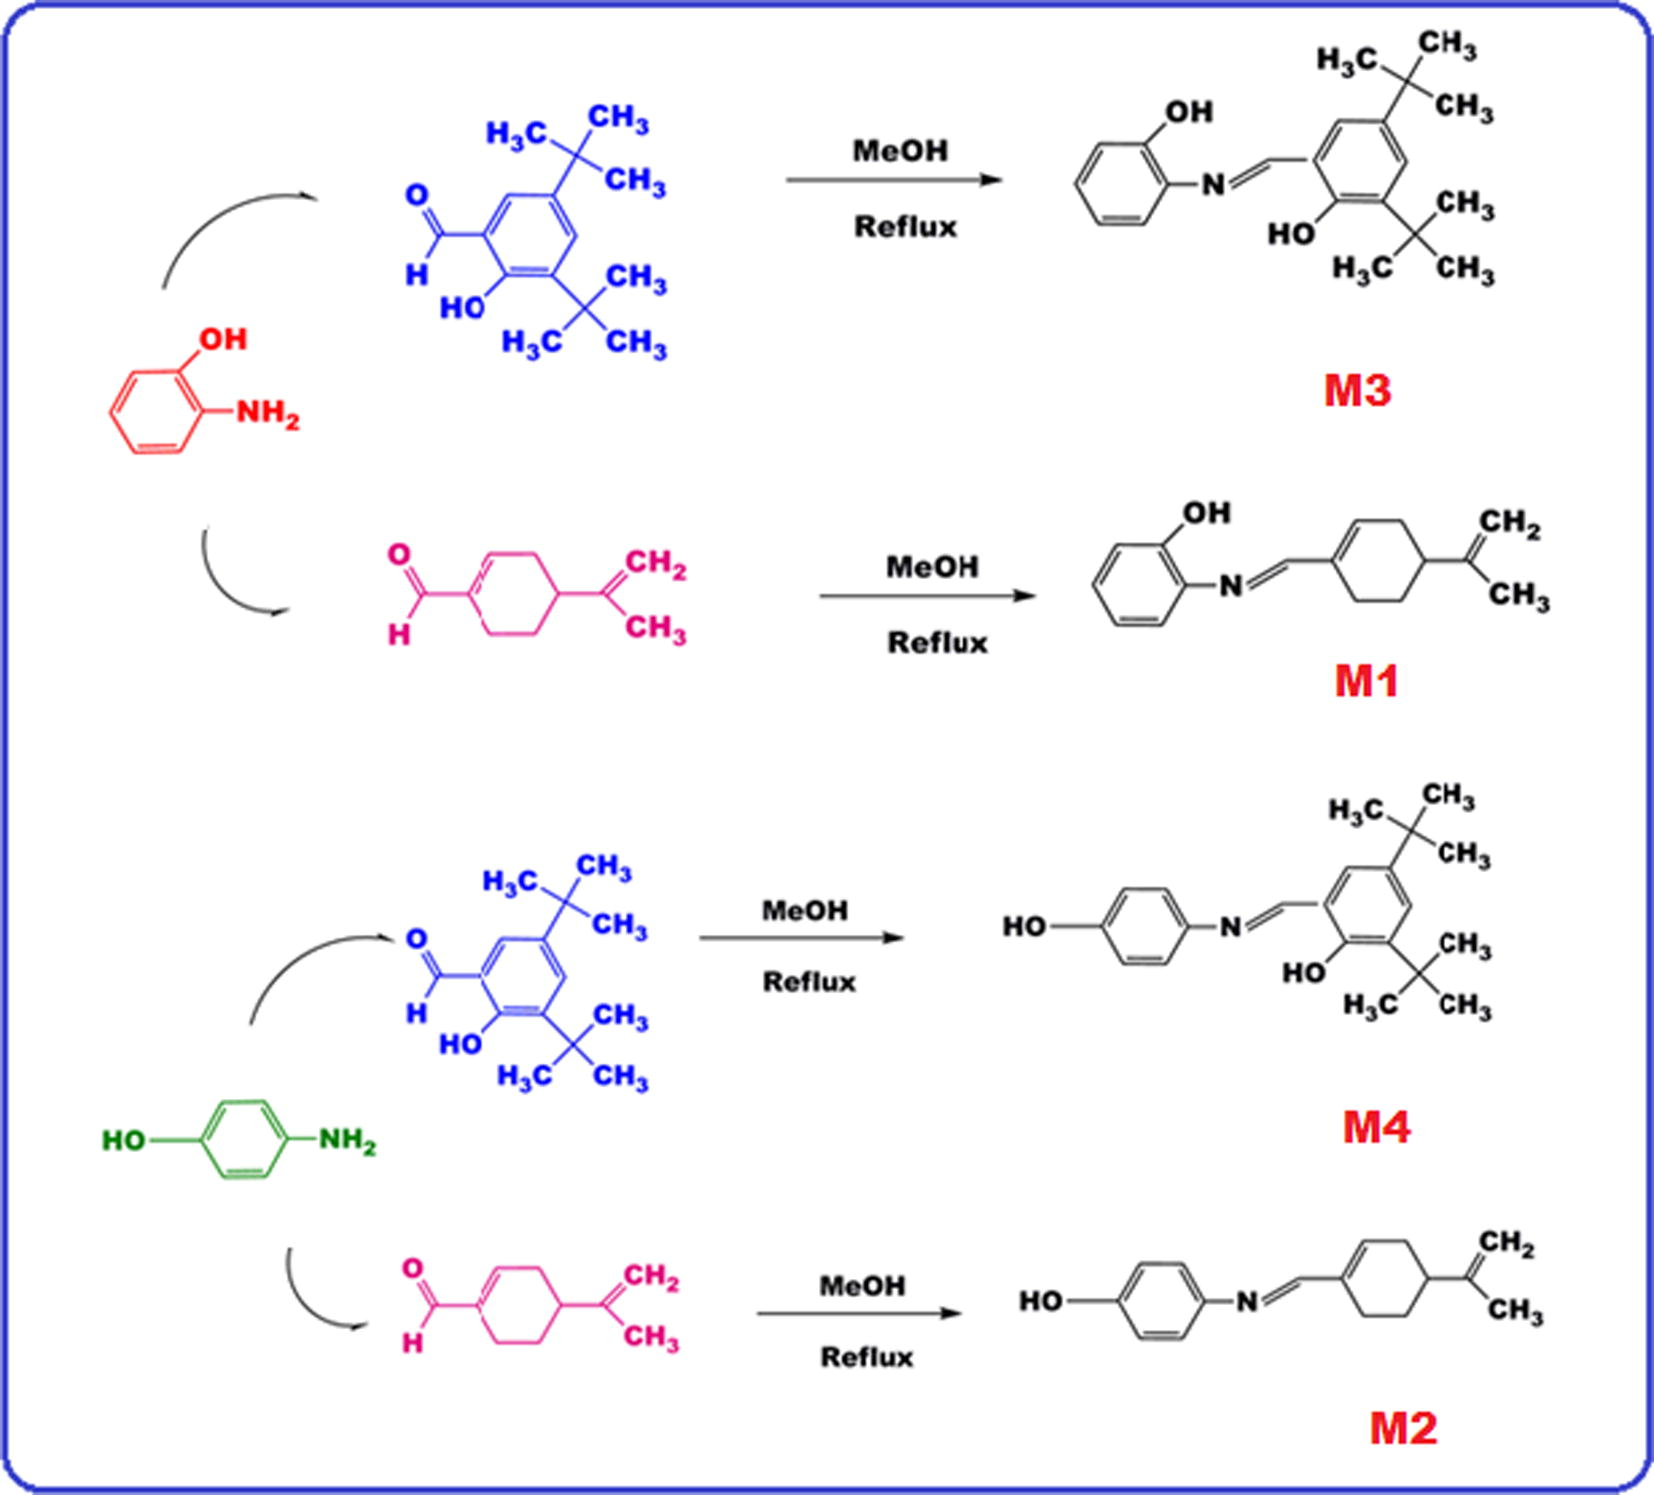
Synthesis of the Schiff base monomers.
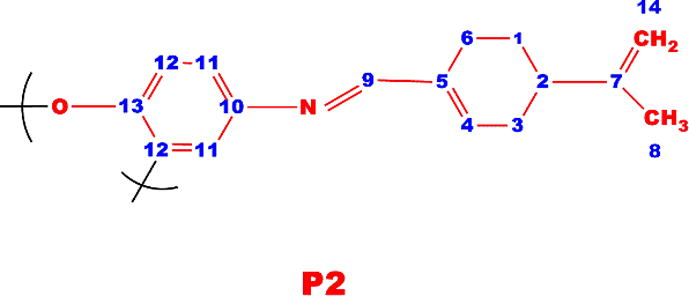
The same procedure was used to obtain the 2-{[(4-isopropenylcyclohex-1-en-1-yl) methylene] amino} phenol (M1), 4-{[(4-isopropenylcyclohex-1-en-1-yl) methylene] amino} phenol (M2) and 2,4-di-tert-butyl-6{[(4-hydroxyphenyl) imino] methyl} phenol (M4). 4-Isopropenylcyclohex-1-ene-1-carbaldehyde (4-IC) (1.57 mL, 0.01 mol)) and 4-aminophenol (4-AP) (1.09 g, 0.01 mol) were used for synthesis the M1, M2 and M4 (Scheme 1). The yields of M1, M2, M3 and M4 were found as 86, 84, 73 and 75%, respectively.
2.3 General procedure for synthesis of the polymers (P1, P2, P3 and P4)
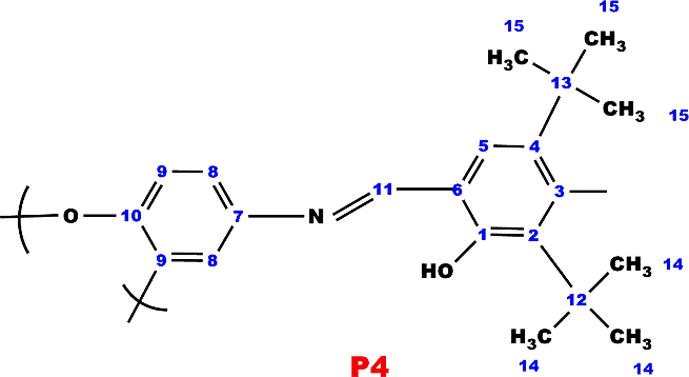
P1, P2, P3 and P4 were obtained through the oxidative polycondensation of M1, M2, M3 and M4 with NaOCl (aqueous solution, 10%) in THF medium. M1 (0.241 g, 0.001 mol) was dissolved in 50 mL THF placed into a 100 mL three-necked round-bottom flask, which was fitted with a condenser, thermometer. Furthermore, NaOCl solution was added to dropwise over about 30 min by a funnel containing NaOCl. The reaction mixture was stirred at 70 °C for 24 h. After the reaction completed, the mixture cooled to room temperature until the solvent left on a petri dish. P1 was washed with n-hexane and then with water to separate it from mineral salt. The polymers dried at 60 °C in a vacuum oven for 24 h (Kaya and Koça, 2004; Özbülbül et al., 2006; Kaya et al., 2001). M2 (0.241 g, 0.001 mol), M3 (0.325 g, 0.001 mol) and M4 (0.325 g, 0.001 mol) were used for synthesis P2, P3 and P4, respectively, using the same procedure (Scheme 2).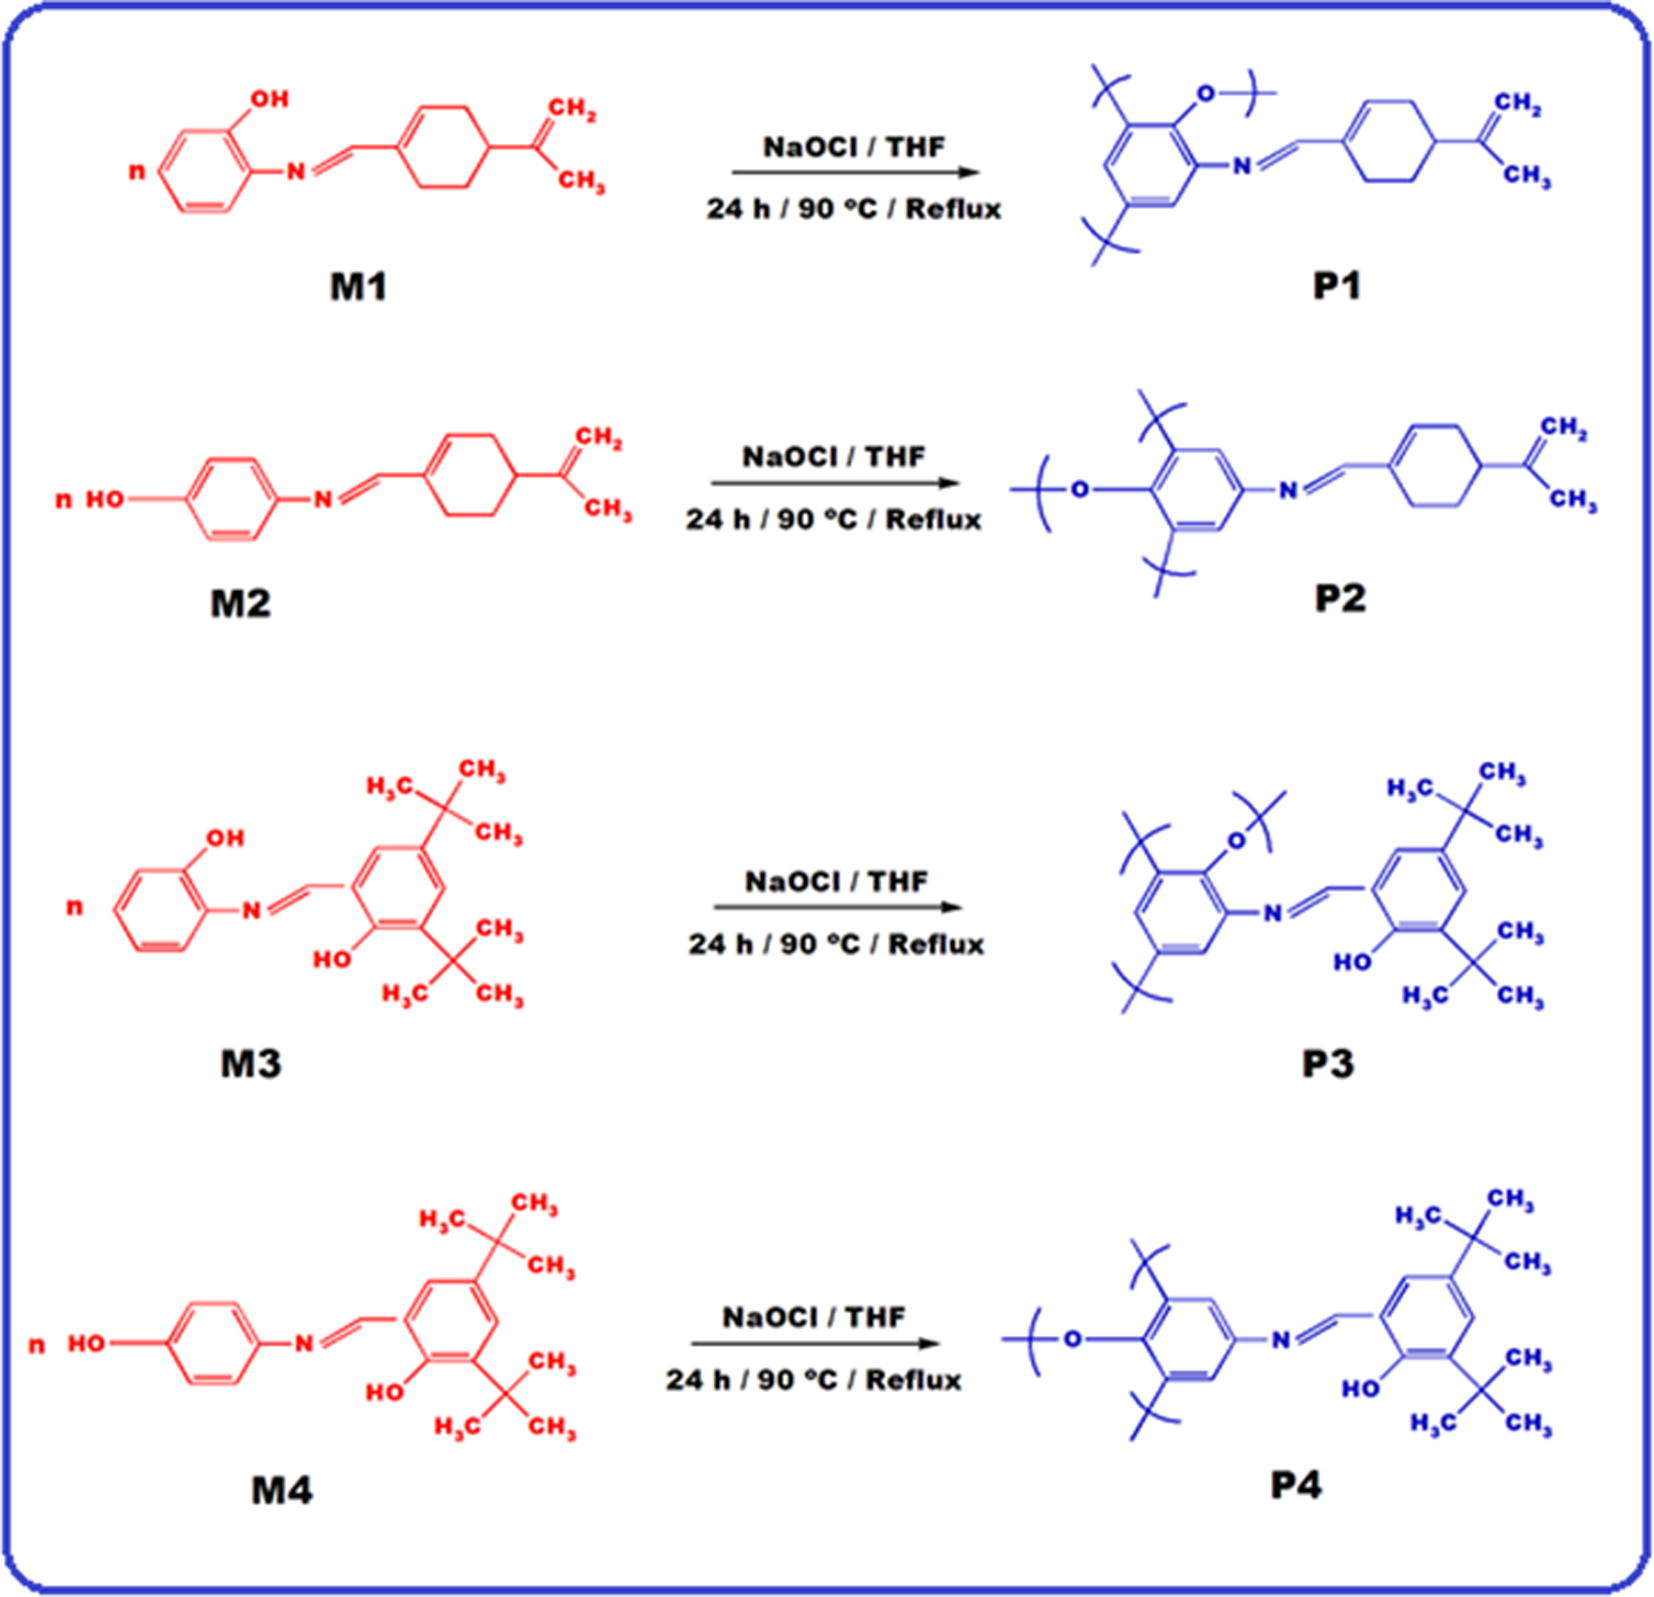
Synthesis of the Schiff base polymers.
2.4 Characterization
The infrared and ultraviolet–visible spectra were obtained by a Perkin Elmer FT-IR Spectrum one and an Analytikjena Specord 210 Plus instrument, respectively. The FT-IR spectra were recorded using universal ATR sampling accessory (4000–550 cm−1). 1H and 13C NMR spectra (BrukerAV400) also recorded in DMSO-d6 at 25 °C. A Perkin Elmer Diamond Thermal Analysis system used to obtain thermal data. TGA-DTA measurements were performed in the range of 20–1000 °C (in N2, rate 10 °C min−1). Size exclusion chromatography (SEC) employed to determine number average molecular weight (Mn), weight average molecular weight (Mw) as well as polydispersity index (PDI) by using a Shimadzu Co. A SGX (100 Å and 7 nm diameter loading material) 3.3 mmi d. × 300 mm column used for SEC investigations; eluent: DMF (0.4 mL/min), polystyrene standards. A refractive index detector (RID) and a UV detector used to analyze the products at 25 °C.
2.5 Fluorescence measurements
Fluorescence measurements of the polymers were carried out by a Shimadzu RF-5301PC spectrofluorophotometer. In addition, their emission spectra were obtained in different concentration of DMSO solution. Furthermore, the polymers studied in different concentrations of DMSO solutions to obtain maximal emission intensity.
3 Results and discussion
3.1 Characterization of the polymers
The structures of the monomers and polymers confirmed by FT-IR, 1H and 13C NMR spectra. FT-IR spectra of the M1, M2, P1 and P2 compounds displayed in Fig. 1. As can clearly be seen, the FT-IR spectrum of P1 polymer was not significantly different from that of M1 monomer, as expected.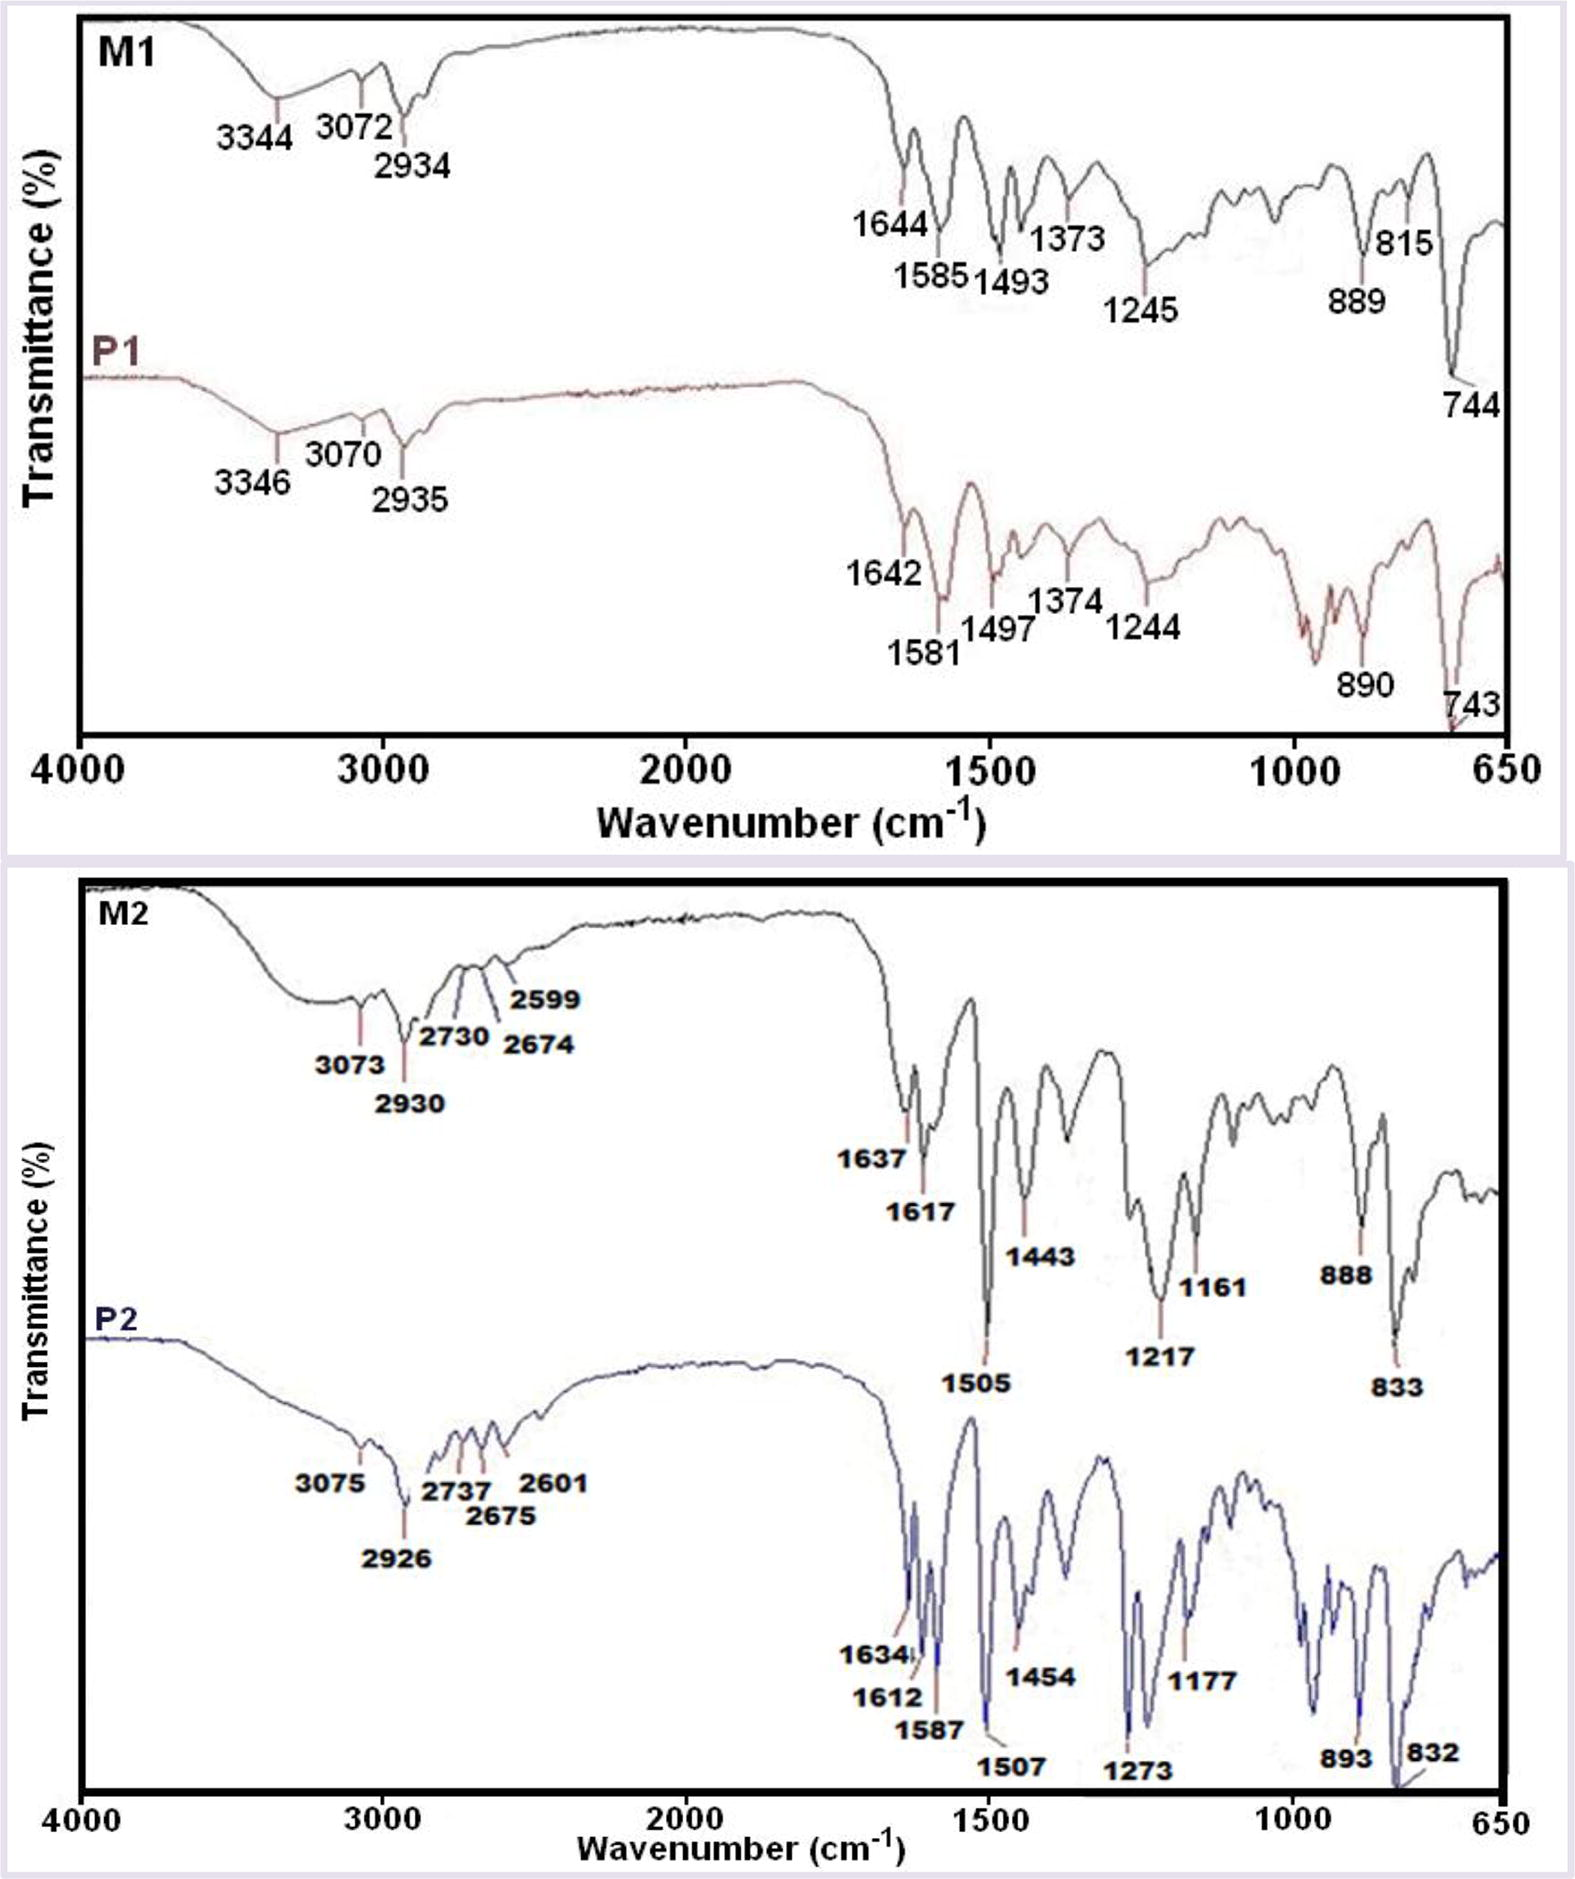
FT-IR spectra of the M1 and M2 monomers and P1 and P2 polymers.
According to these spectra, the peaks due to Ar—O bonds appear at 1244–1245 cm−1 (Zhang et al., 2005) indicating that the polymerization was achieved. The bands corresponding to hydroxyl moieties (—OH) are seen at around 3344–3346 cm−1 (Kaya and Aydın, 2012). The peak at 1642–1644 cm−1 can be attributed to —CH⚌N stretching vibration of imine moiety. The values of vibration peaks also shown in Table 1.
Compounds
Wave number (cm−1)
—OH
C—H(Aromatic)
C—H (aliphatic)
—C⚌N
C⚌C (Aromatic)
—C—O—C—
M1
3344
2934
2934
1644
3072
1245
P1
3346
2935
2934
1642
3072
1244
M2
3073
2930
2730–2599
1637
1617
1217
P2
3075
2926
2737, 2601
1634
1612
1273
M3
3321
2953
2905
1614
1581
1251
P3
3325
2955
2907
1615
1580
1248
M4
3257
2954
2905
1617
1592
1247
P4
3342
2954
2907
1615
1589
1248
As seen in Fig. 1 and Table 1, carbonyl band of aldehyde compounds disappeared and a new strong sharp band appeared at 1642–1644 cm−1 region assigned to the —C⚌N— band, which support the formation of the Schiff bases.
However, peaks of P1 polymer were broader than that of M1 monomer after the polycondensation reaction owing to their polyconjugated structures. Bands in the FT-IR spectra of the polymers were decreased due to their conjugated bond systems. Furthermore, increase of molecular weight after polymerization reactions (Karakaplan et al., 2008) led to broadening and decreasing of the edged peaks of P1, P2, P3 and P4 numerically, confirming polymerization of M1, M2, M3 and M4.
The NMR spectra data of compounds are given in Table 2. The 1H and 13C NMR spectra of M1 and P1 given in Fig. 2 and Fig. 3. It known that phenol based Schiff bases polymerize by oxidative polymerization via C—C ortho and/or para positions of the ring depending on —OH or —C—O—C— binding via oxygen atom of —OH moiety (Dineshkumar and Muthusamy, 2016; Kaya and Aydın, 2011).
Compounds
NMR spectra data
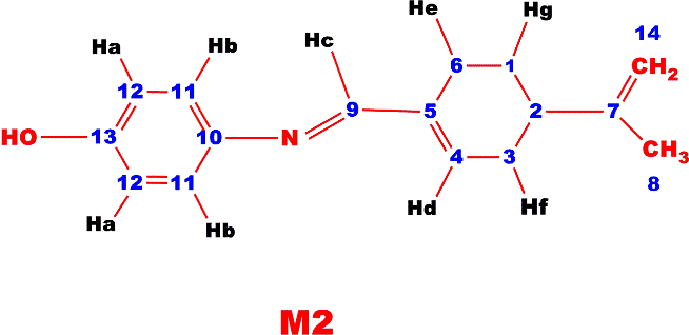
1H NMR (DMSO-d6, ppm, δ): 10.12 (s, —OH), 6.82 (d, Ar-Ha), 7.05 (d, Ar-Hb), 8.10 (s, Ar-Hc), 6.42 (t, Ar-Hd), 2.43 (t, Ar-He), 2.09 (t, Ar-Hf), 2.05 (g, Ar-Hg), 1.30 (s, ⚌CH2), 1.70 (s, —CH3), 13C NMR (DMSO-d6, ppm, δ): 22.75 (C1-H), 41,69 (C2-H), 29.65 (C3-H), 128.76 C4-H), 135.91 (C5-ipso), 24.12 (C6-H), 149.63 (C7-ipso), 108 (C8-H),163.84 C9-H), 142.41 (C10-ipso), 121.12 (C11-H), 113.35 (C12-H), 154.42 (C13-ipso),19.15 (C14-H)
1H NMR (DMSO-d6, ppm, δ): 10.39 (s, —OH), 8.82 (s, —CH⚌N), 4.51 (s, ⚌CH2), 1.35 (s, -CH3), 6.00–6.85 (m, Ar-H), 13C NMR (DMSO-d6, ppm, δ): 23.95 (C1-H), 39.85 (C2-H), 29.15 (C3-H), 128.76 C4-H), 137.62 (C5-ipso), 24.25 (C6-H), 149.63 (C7-ipso), 108.62 (C8-H), 169.36 (C9-H), 143.81 (C10-ipso), 122.75 (C11-H), 118.15 (C12-H), 146.15 (C13-ipso), 20.82 (C14-H)
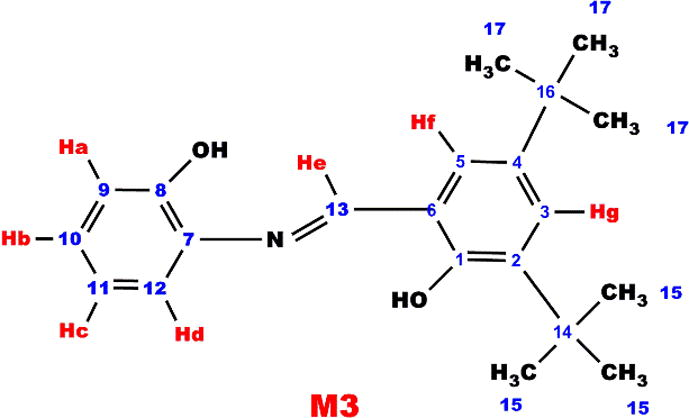
1H NMR (DMSO-d6, ppm, δ): 11.10 (s, —OH), 6.86 (d, Ar-Ha), 6.89 (t, Ar-Hb), 7.05 (t, Ar-Hc),7.33 (d, Ar-Hd), 9.00 (s, Ar-He), 7.39 (s, Ar-Hf),7.45 (s, Ar-Hg), 1.30 and 1.40 (s, —CH3), 13C NMR (DMSO-d6, ppm, δ): 158.35 (C1-ipso), 139.15 (C2-ipso), 121.03 (C3-H), 143.65(C4-ipso), 131.62 (C5-H), 113.10 (C6-H), 135.89 (C7-ipso), 151.02 (C8-ipso), 114.05 (C9-H), 127.16 (C10-H), 123.58 (C11-H), 118.36 (C12-H), 163.42 (C13-H), 33.40 (C14-ipso), 29.15 (C15-H), 38.15 (C16-ipso), 31.23(C17-H)
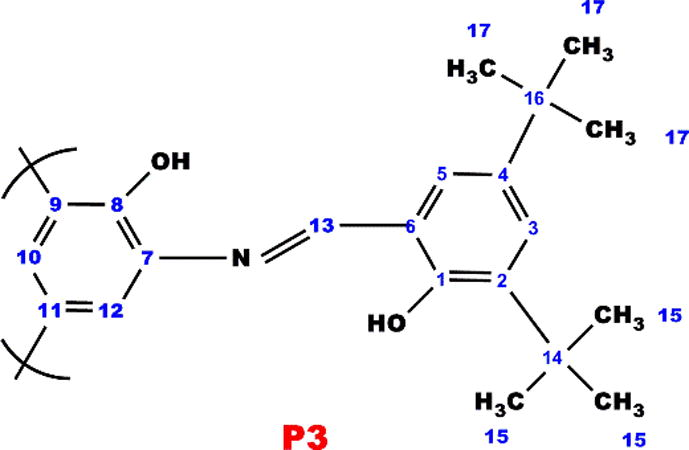
1H NMR (DMSO-d6, ppm, δ): 13.25 (s, —OH), 9.27 (s, —CH⚌N), 7.50–6.80 (m, Ar-H), 1.32 and 1.43 (s, —CH3), 13C NMR (DMSO-d6, ppm, δ): 158.30 (C1-ipso), 139.15 (C2-ipso), 122.45 (C3-H), 143.65(C4-ipso), 130.86 (C5-H), 109.75 (C6-H), 135.89 (C7-ipso), 152.02 (C8-ipso), 116.15 (C9-H), 127.56 (C10-H), 111.94 (C11-ipso), 118.76 (C12-H), 169.15 (C13-H), 37.40 (C14-ipso), 31.15 (C15-H), 40.63 (C16-ipso), 28.75 (C17-H)
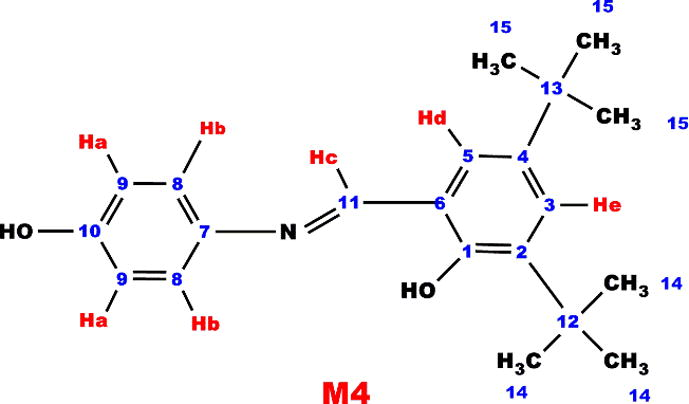
1H NMR (DMSO-d6, ppm, δ): 11.72 (s, —OH), 6.86 (d, Ar-Ha), 7.03 (d, Ar-Hb), 9.39 (s, Ar-Hc), 7.68 (s, Ar-Hd), 7.40 (s, Ar-He), 1.32 and 1.43 (s, —CH3), 13C NMR (DMSO-d6, ppm, δ): 158.55 (C1-ipso), 135.03 (C2-ipso), 123.72 (C3-H), 141.76 (C4-ipso), 127.32 (C5-H), 113.83 (C6-H), 143.92 (C7-ipso), 122.35 (C8-ipso), 116.18 (C9-H), 151.07 (C10-H), 163.45 (C11-H), 33.1 (C12-H), 39.70 (C13-H), 31.03 (C14-ipso), 31.89 (C15-H)
1H NMR (DMSO-d6, ppm, δ): 12.29 (s, —OH), 9.83 (s, —CH⚌N), 7.60–7.28 (m, Ar-H), 1.29 and 1.41 (s, —CH3), 13C NMR (DMSO-d6, ppm, δ): 157.63 (C1-ipso), 135.84 (C2-ipso), 124.02 (C3-H), 138.42 (C4-ipso), 129.04 (C5-H), 116.03 (C6-H), 144.39 (C7-ipso), 123.47 (C8-ipso), 119.65 (C9-ipso), 150.86 (C10-H), 162.35 (C11-H), 34.68 (C12-H), 39.93 (C13-H), 29.92 (C14-ipso), 31.51(C15-H)
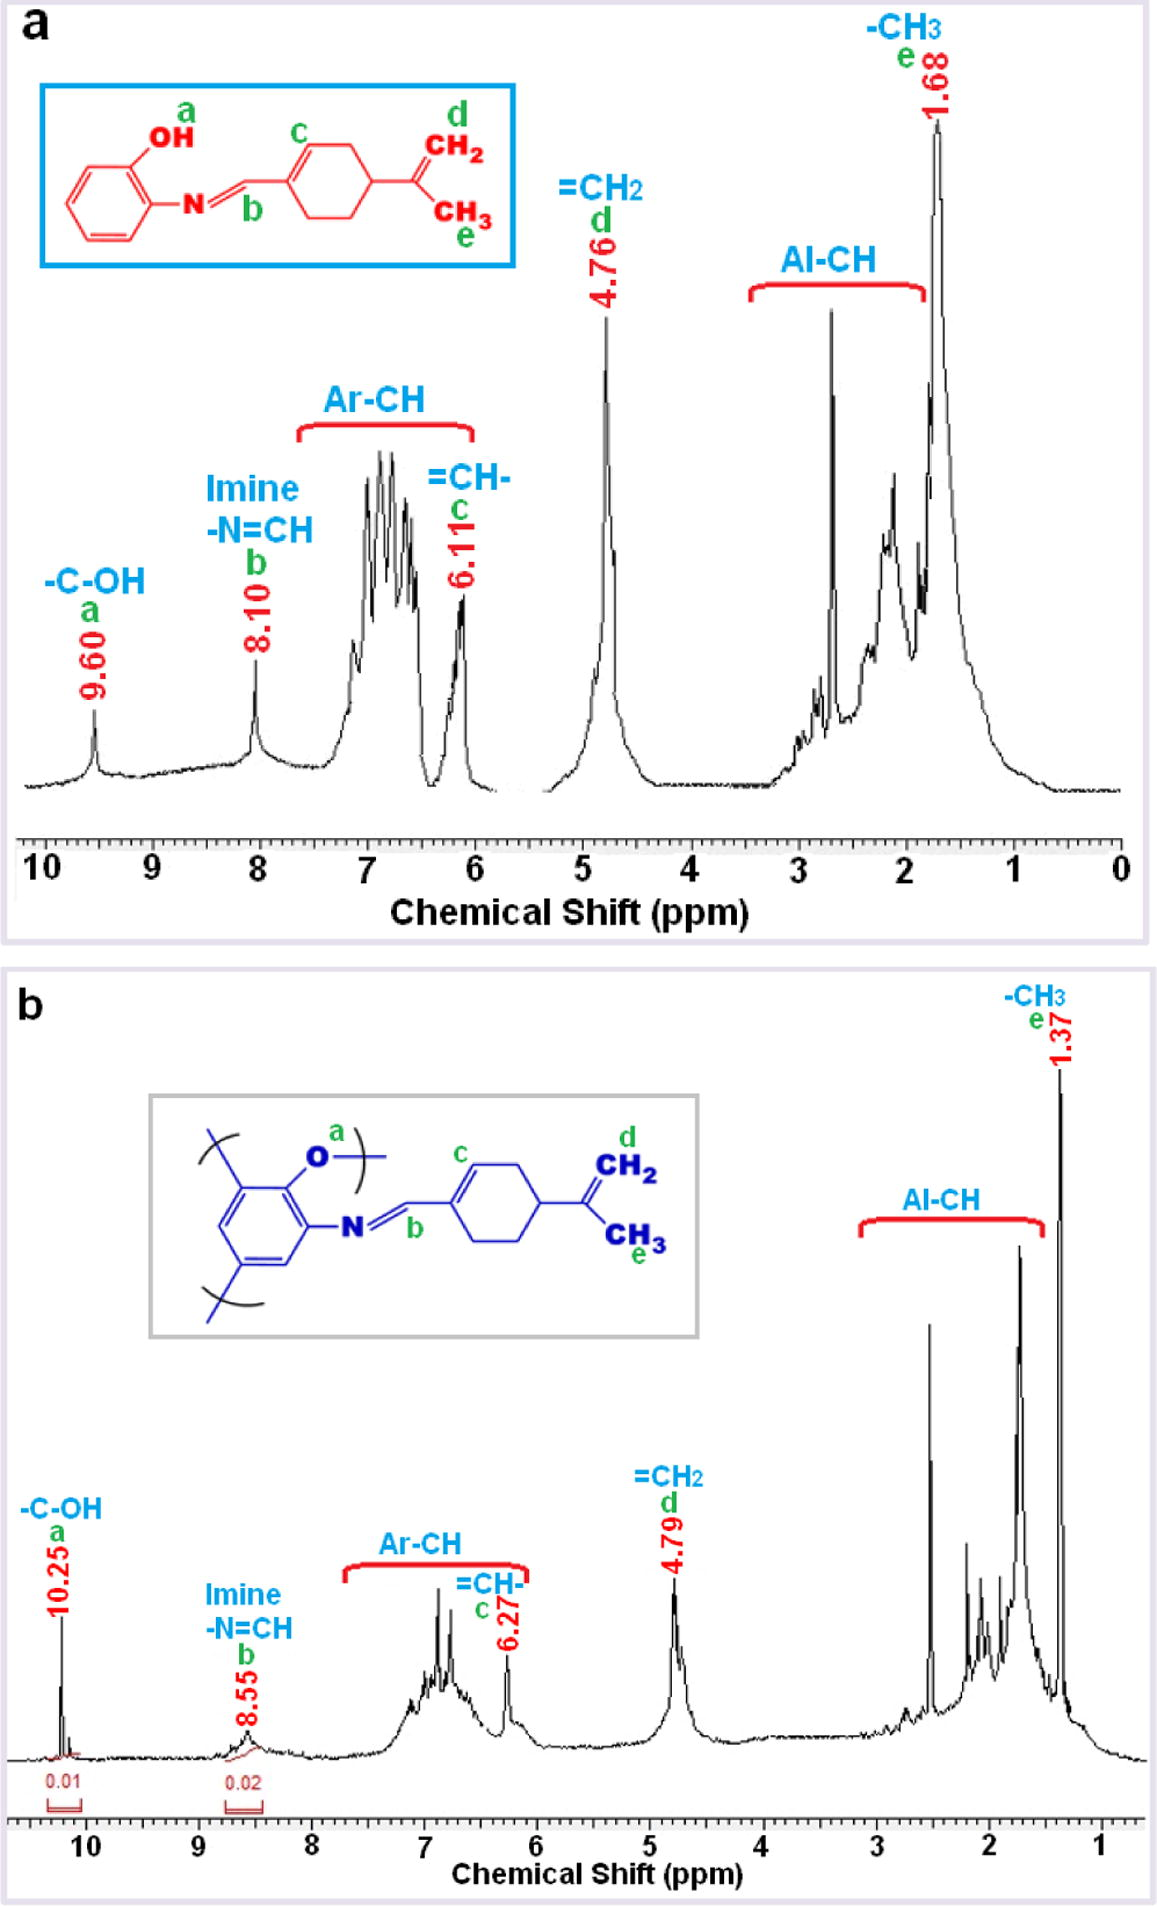
1H NMR spectra of M1 (a) and P1 (b).
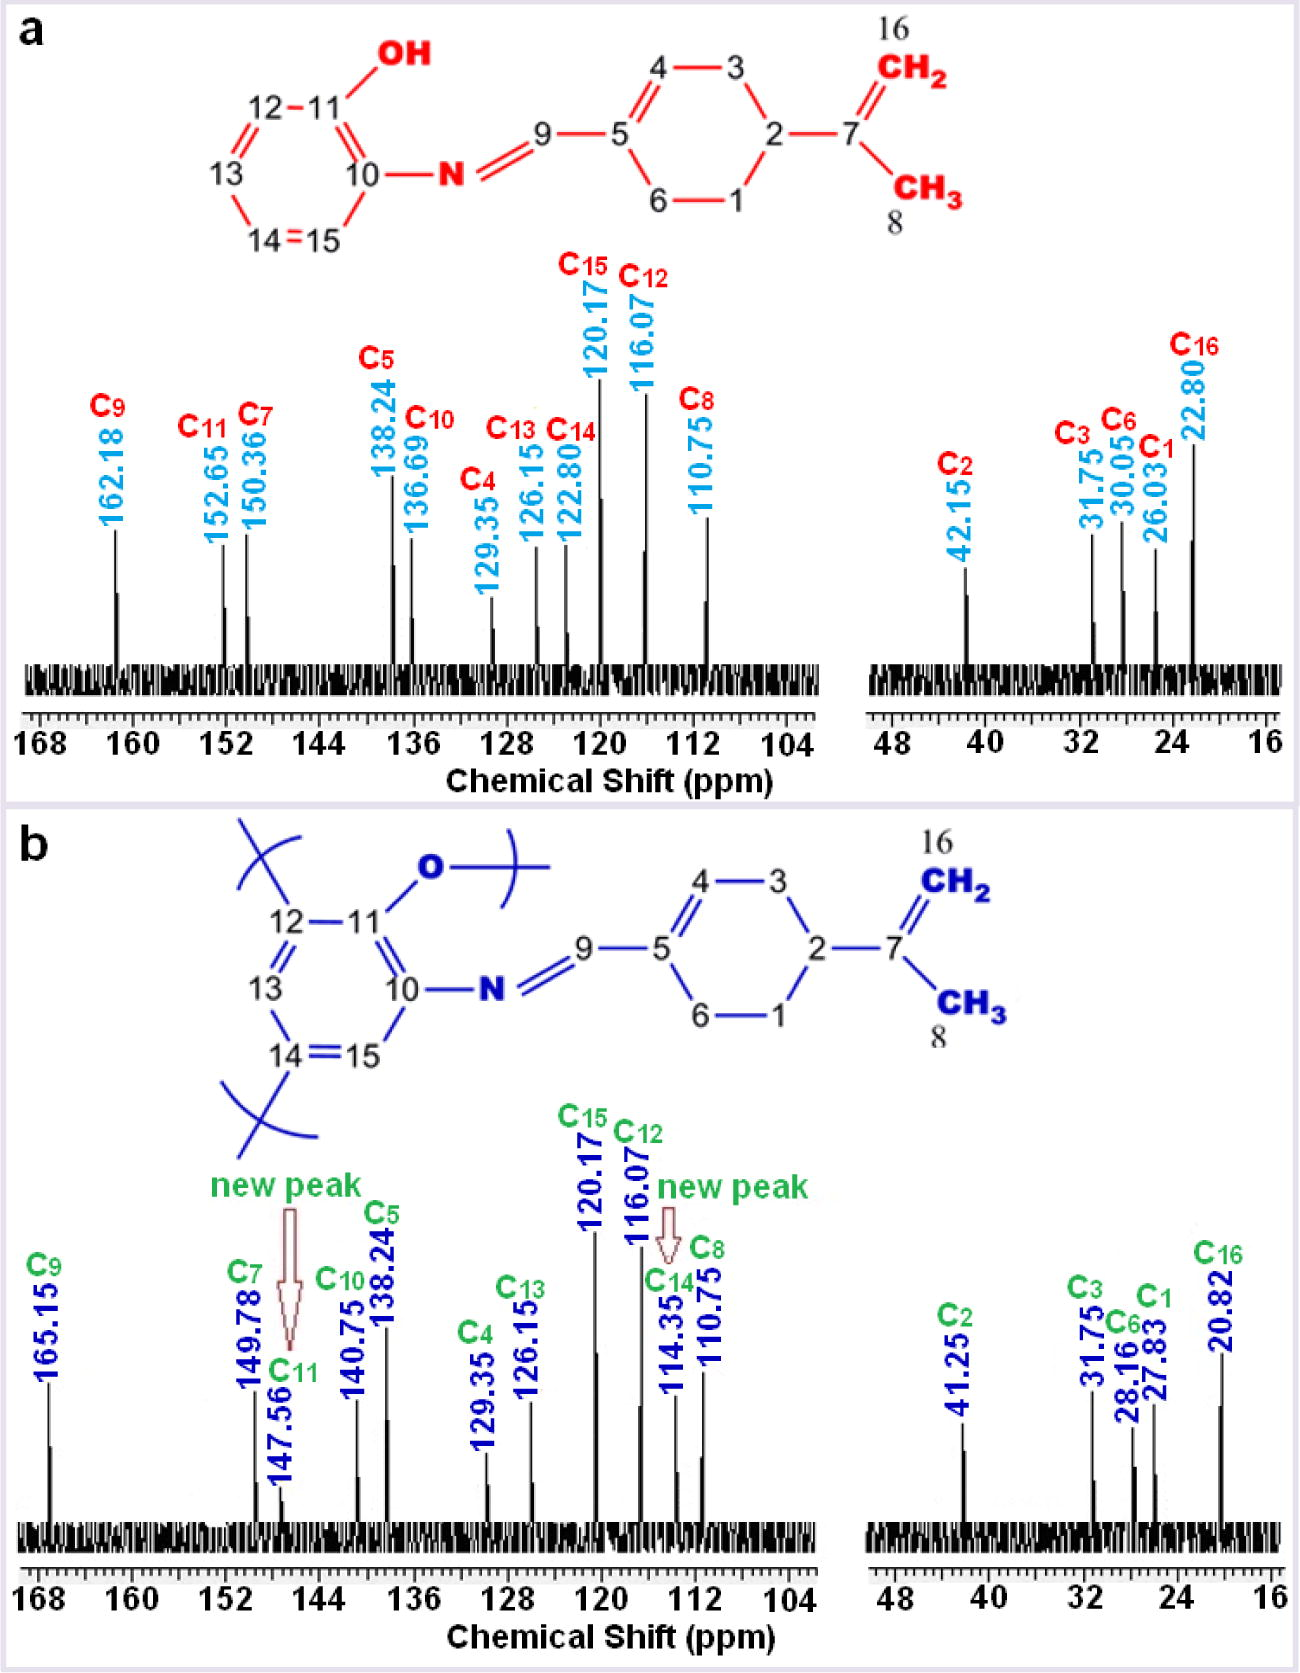
13C NMR spectra of M1 (a) and P1 (b).
As can be seen in Fig. 2, characteristic resonances observed. For instance, the signals at 8.10 and 8.55 ppm in the 1H NMR spectra can be attributed to imine moiety. Furthermore, the resonances at 9.60 and 10.25 ppm correspond to the proton of terminal hydroxyl groups (—OH). Additionally, signals for protons of aromatic ring are observed in the range of 6.55–7.15 and 6.45–7.20 ppm, whereas those for aliphatic protons resonate at 4.75 (—CH2) and 4.42 (—CH3), and 1.3–2.80 ppm for M1 and P1 respectively.
It is known that monomers containing phenol may be polymerized by either C—O—C binding via oxygen atom of —OH or by C—C coupling of monomer units at ortho or para positions of the phenol in terms of —OH group (Özbülbül, 2006). Appearance of broad signals in the 1H NMR spectra of P1 for aromatic protons supports that the aromatic ring takes part in polymerization (Dineshkumar and Muthusamy, 2016; Kaya et al., 2010).
According to Fig. 3, sixteen different carbon atoms are observed at the structure of P1. In the 13C NMR spectrum, decreasing of resonance intensity of C11 and appearing of a new resonance at 147.56 ppm clearly indicate that phenoxy radical, which occurred from —OH group bound to C11(ipso carbon), forms the polymer structure consisting of oxyphenylene units (C—O—C).
The short resonances at 114.35 ppm obviously indicate that P1 polymerizes through C14 carbon, i.e., —C—C binding occurs for the radical occurred at ortho or para position of phenol by distribution of the phenoxy radical to the cycle. After polymerization reactions molecular weight increased, thus, the edged peaks of P1, P2, P3 and P4 were broader and decreased numerically, confirming polymerization of M1, M2, M3 and M4. Furthermore, the azomethine protons resonated at 8.10, 9.00 and 9.39 ppm for M2, M3 and M4 monomers, 8.82, 9.27 and 9.83 ppm for P2, P3 and P4 polymers, respectively.
The aromatic proton signals of P1 were broader than M1 in their 1H NMR spectra. This change in the shape of signals clearly indicates that polymerization occurs by oxidative polymerization. Furthermore, when integration was considered, it was observed that integration of signal for imine proton was greater than that of —OH, indicating that polymerization took place through etheric bond (C—O—C) partially.
3.2 Optical and electrochemical properties of the compounds
UV–vis spectroscopic studies of compounds were conducted in DMSO at room temperature and the spectra of M1, M2, P1 and P2 compounds illustrated in Fig. 4. Optical band gaps (Eg) of the compounds calculated according to the literature (Colladet et al., 2004) and presented in Table 3.
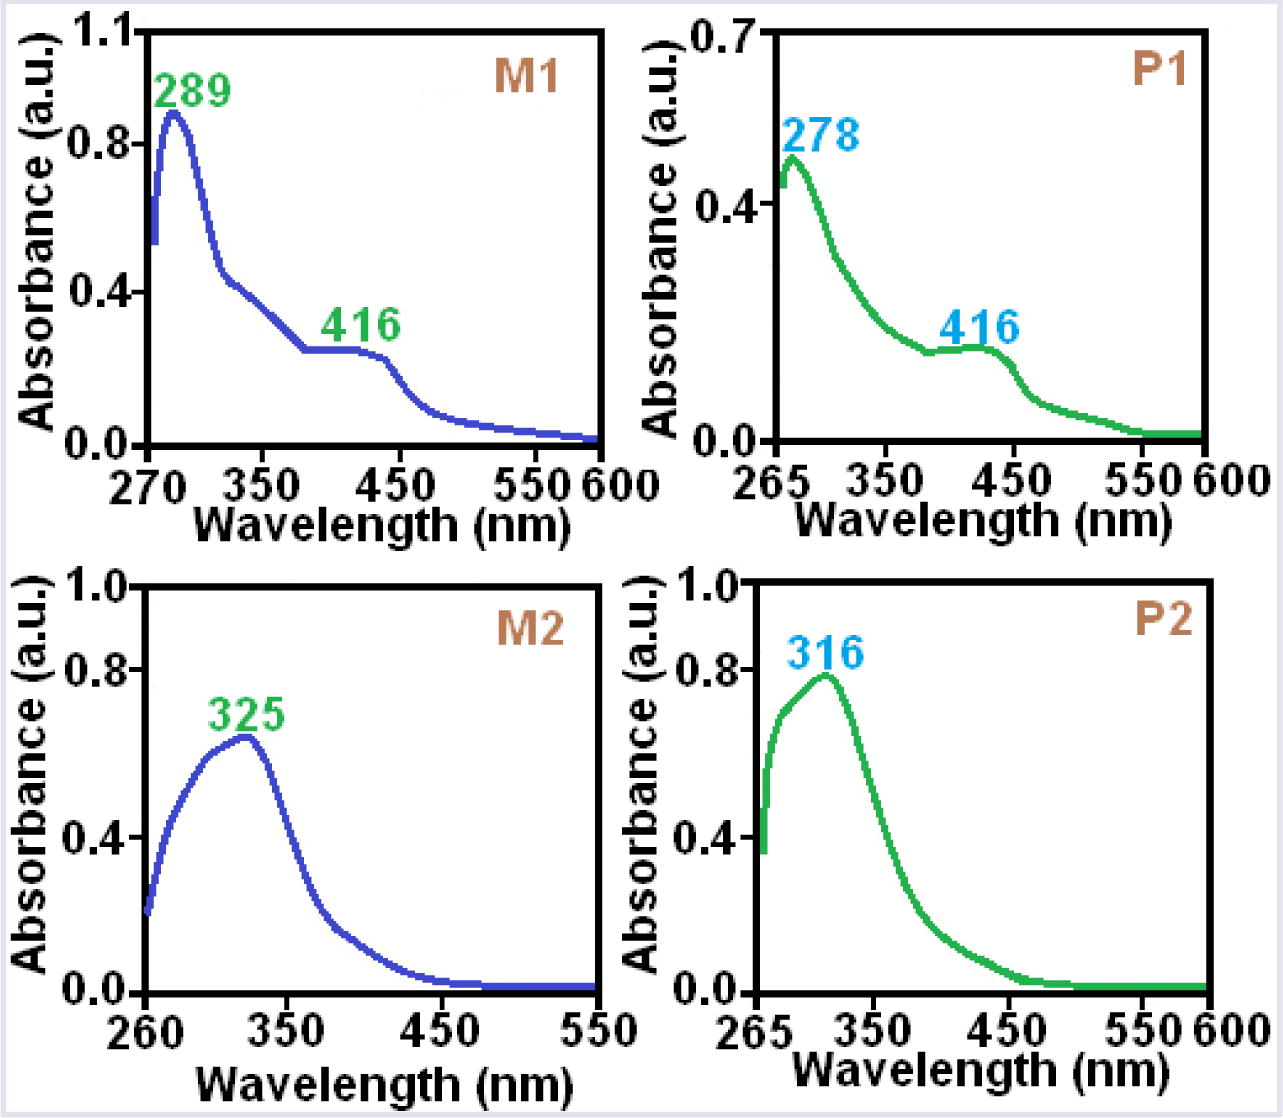
Absorption spectra of M1, M2, P1 and P2 compounds.
Compounds
HOMO (eV)a
LUMO (eV)b
Eg′ (eV)c
Eg (eV)d
λonset (nm)e
λmax (nm)f
M1
−5.76
−2.92
2.84
2.64
471
416
P1
−5.69
−3.08
2.61
2.57
483
416
M2
−5.77
−3.03
2.74
2.95
421
325
P2
−5.67
−3.02
2.65
2.16
575
316
M3
−5.93
−2.94
2.99
2.37
524
280, 362
P3
−5.88
−2.99
2.89
2.28
531
278, 364
M4
−5.62
−2.81
2.81
2.96
420
279, 362
P4
−5.61
−3.33
2.28
2.53
479
279, 360
λonset is the onset wavelength and it can be determined by intersection of two tangents on the absorption edges. It also indicates the electronic transition start wavelength. From the results, the optical band gap values of the polymers changes in the decreasing order as P1 > P4 > P3 > P2. From Fig. 4, the absorption bands at 250–300 nm can be assigned to π → π∗ electronic transitions in the aromatic ring and those at 295–380 nm may be assigned to π → π∗ electronic transitions in the azomethine group. The bands observed in the UV spectra of the polymers are in the same or close regions, implying that structure of polymers are similar and functional groups (—OH or —CH⚌N) have the same resonance and inductive effect (Cazacu et al., 2004).
The cyclic voltammograms of compounds studied in DMSO. The values of electrochemical band gaps (E’g) given in Table 3. The calculations performed by using the following equations (Cervini et al., 1997):
From the electrochemical analysis, the electrochemical band gap values of the polymers changes in the decreasing order of: P3 > P2 > P1 > P4 (Fig. 5). The electrochemical band gaps (E′g) values of P1, P2, P3 and P4 polymers were found as 2.61, 2.65, 2.89 and 2.28 eV, respectively. The electrochemical band gaps (E′g) values of M1, M2, M3 and M4 polymers were found as 2.84, 2.74, 2.99 and 2.81 eV, respectively. These results indicated that polymers have a bit lower Eg values than their monomers due to their polyconjugated structures (Kaya and Yılmaz, 2017). This is because of the polyconjugated structures of the polymers which increase HOMO and decrease LUMO energy levels thus result in lower band gaps (Kaya et al., 2010).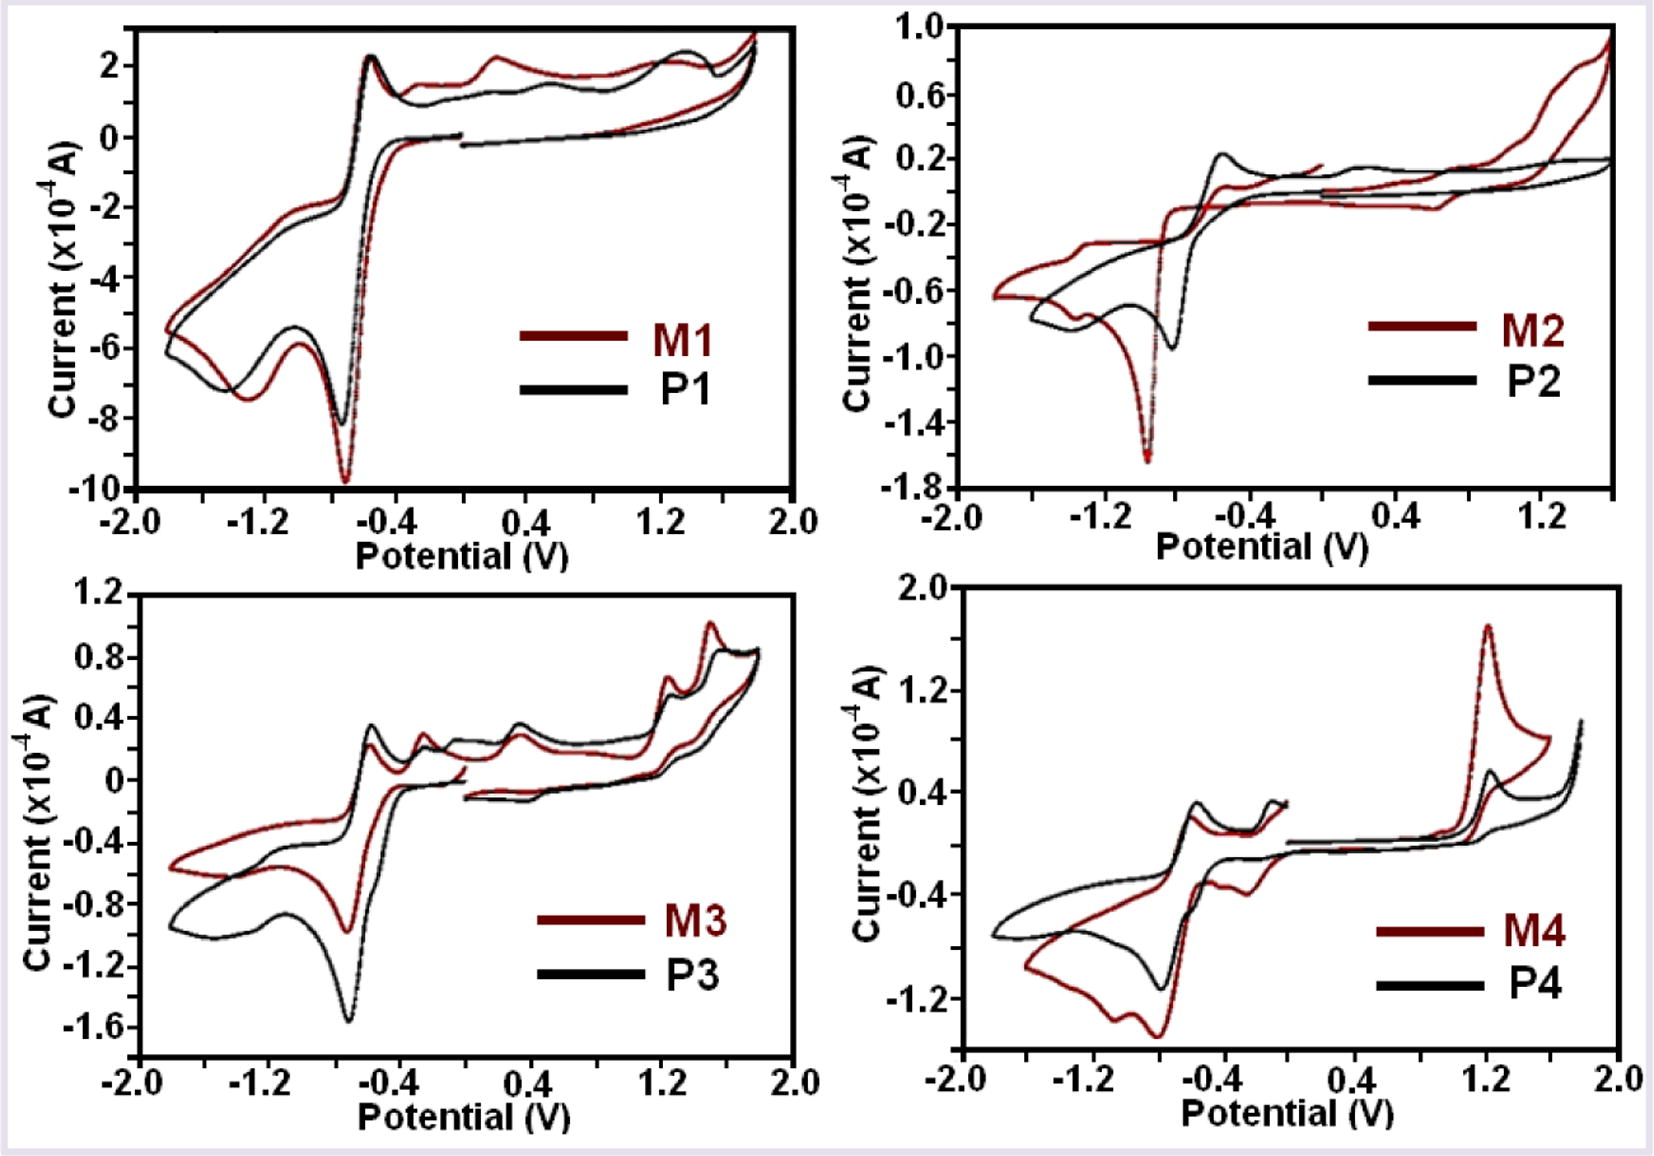
Cyclic voltammograms of the monomers and polymers.
The optical band gaps (Eg) values of P1, P2, P3 and P4 polymers were found as 2.57, 2.16, 2.28 and 2.53 eV, respectively. Both optical and electrochemical band gaps values of monomers were higher than polymers.
Fluorescence measurements were carried out by using a Shimadzu RF-5301PC spectrofluorophotometer. Emission and excitation studies of the polymers carried out in DMSO at 1 × 10⁻³ mg L−1 concentration. In all measurements, 5 nm slit width used. The results also outlined in Table 4. As can be seen in Table 4 and Fig. 6, P3 has maximum emission intensity, indicating that it has fluorescence characteristics while P4 have the lowest emission intensity and display no fluorescence characteristics.
Compounds
λEma
λmax(Em)b
IEmc
M1
300
355
685
P1
300
348
103
M2
300
390
79
P2
300
414
202
M3
300
344
461
P3
300
344
460
M4
400
551
24
P4
400
554
25
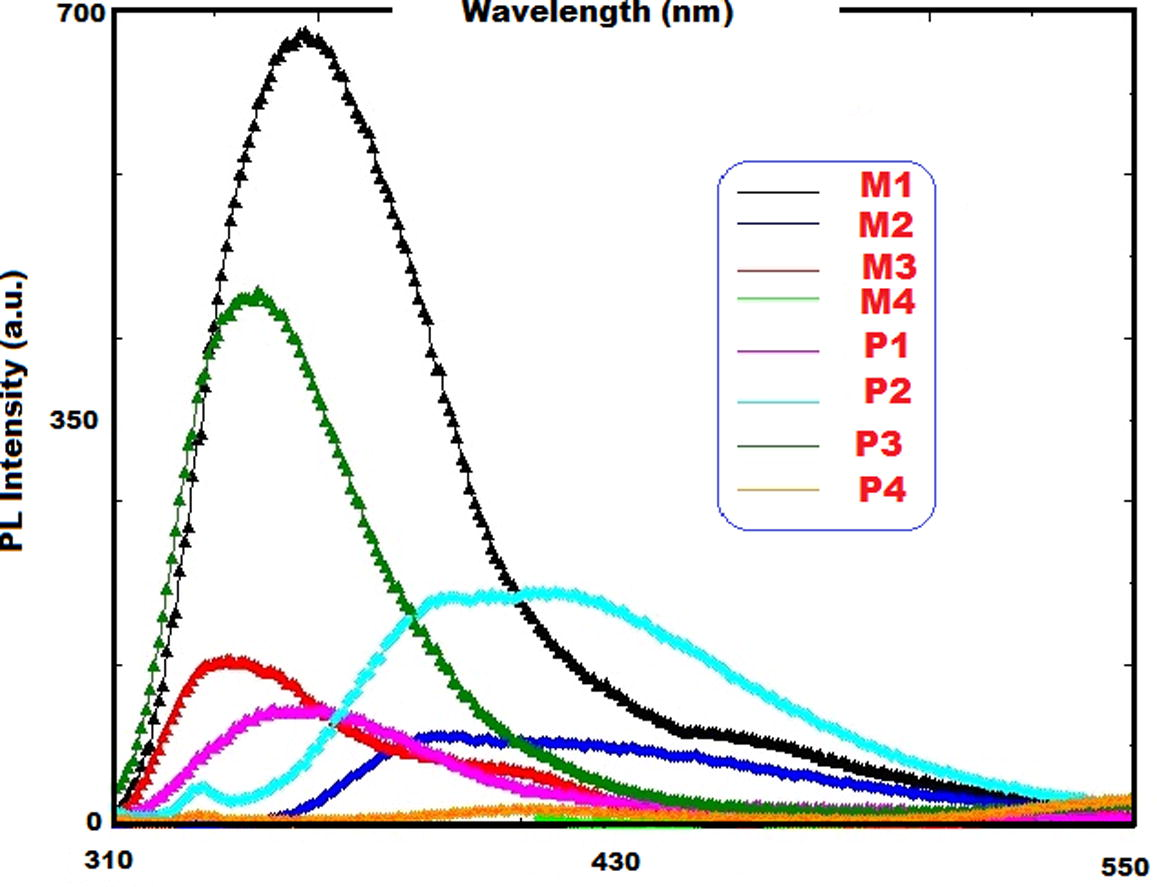
Emission spectra of monomers and polymers the solutions in DMSO.
3.3 Thermal properties of the polymers
Table 5 shows the thermal degradation (TGA) data. TGA curves of the monomers and polymers also illustrated in Fig. 7. As can easily be seen in these results, the initial degradation temperatures (Ton) of the monomers are higher than the beginning polymers, which can be attributed to the formation of C—O etheric bond during polymerization. It is known that this weak bond can be easily broken at mild temperatures, thus the polymer becomes thermally unstable (Colladet et al., 2004; Kaya et al., 2010). Furthermore, char% of M1 was higher than those of other compounds at 1000 °C. The onset temperature values of M1, M2, M3, M4 and P1, P2, P3 and P4 compounds were found as 173, 202, 145, 273 and 175, 196, 128 and 243 °C, respectively. These values of the monomers and polymers containing para hydroxyl groups were higher than monomers and polymers containing ortho hydroxyl group. Because main chain is more stable at the para region as compared to ortho region. Also, thermal stabilities of monomers (M3 and M4) and polymers (P3 and P4) containing tert-butyl group were observed lower than compounds containing peril group. Both molecular weight value and %char amount of P1 and P2 polymers were found higher than other polymers. These results may be from tert- butyl group in the structures of P3 and P4 compounds. Thermal degradations of M3, M4, P3 and P4 compounds were ended at 700, 550, 880 and 875 °C, respectively. The water losses of P1, P2, P3 and P4 polymers were found as 4.3, 3.5, 2.0 and 4.10%, respectively. Thermal degradations of polymers were occurred at the two steps. The weight losses of P1, P2, P3 and P4 polymers were found as 54.53, 68.32, 90.19 and 90.94%, at the first step between at 120–690, 120–655, 120–580 and 120–620 °C, respectively. The weight losses of P1, P2, P3 and P4 polymers were found as 26.47, 17.68, 9.81 and 9.06%, at the second step between at 690–1000, 655–1000, 580–880 and 620–875 °C, respectively.
TGA (°C)
DTA (°C)
Compounds
Tonseta
T20b
T50c
%Chard
Tmaxe
Endo
Exo
M1
173
256
385
20
230, 395
244, 307, 517
–
P1
175
292
518
19
239, 322, 410,910
–
340
M2
202
270
376
6
255, 408
169, 516
–
P2
196
264
400
14
230, 385, 887
–
300
M3
145
246
285
–
286
135, 296
–
P3
128
215
267
–
266, 395
127
368
M4
273
282
310
–
309
150, 322
–
P4
243
257
285
–
280, 400, 833
–
–
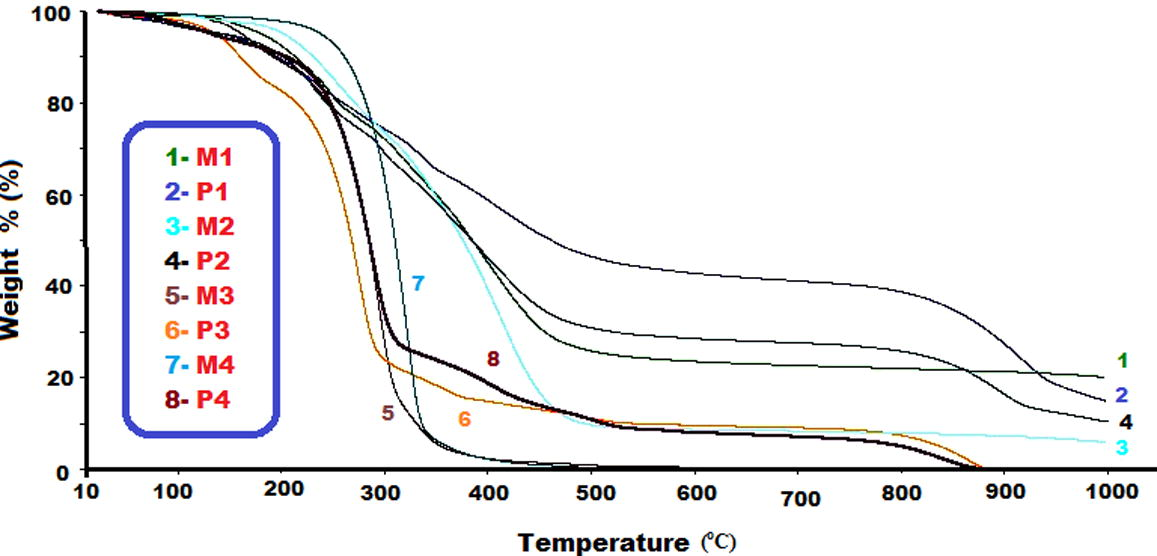
TGA curves of the monomers and polymers.
According to DSC thermograms, glass transition temperatures (Tg) and specific heat change (ΔCp) of P1, P2, P3 and P4 polymers were found to be 165, 175, 119 and 125 °C; 0.218, 0.305, 1.583 and 0.551 J g−1 K−1, respectively. According to DSC results, Tg values of P1 and P2 compounds were higher than other P3 and P4 polymers containing tert-butyl group. These results could be verified with molecular weight values of P1 and P2 polymers.
3.4 SEC analysis
Size exclusion chromatography (SEC) analyses of P1, P2, P3 and P4 polymers were achieved at 30 °C using DMF/MeOH (v/v, 4/1) as eluent at a flow rate of 0.4 mL min−1. The number average molecular weight (Mn), weight average molecular weight (Mw) and polydispersity index (PDI, Mw/Mn) of the compounds calculated in terms of a polystyrene standard calibration curve. These values found as Mn: 9600 g mol–1, Mw: 14200 g mol−1, PDI: 1.47; Mn: 8300 g mol–1, Mw: 10200 g mol−1, PDI: 1.22; Mn: 6430 g mol–1, Mw: 8850 g mol−1, PDI: 1.77 and Mn: 5420 g mol–1, Mw: 7650 g mol−1, PDI: 1.41, for P1, P2, P3 and P4, respectively.
4 Conclusions
New polyazomethine compounds synthesized by oxidative polycondensation reaction and their electrochemical, optical and electrical properties investigated. The compounds characterized by several spectroscopic techniques such as UV–Visible, FT-IR, 1H, and 13C NMR. From the 1H NMR and 13C NMR spectra, one can easily conclude that the compounds polymerized via C—O—C or C—C binding. Molecular mass of P1 was the highest according to SEC analysis. Since P4 contain tert-butyl moieties, binding was less due to steric hindrance. It found that M1 have the highest fluorescence intensities. From the optical and electrochemical analyses, we can easily conclude that P4 has the lowest band gaps. According to TG studies, we found that the monomers were more stable than the polymers and that the initial degradation temperatures of the monomers were between 145 and 273 °C. Furthermore, solubility indicated that the compounds are soluble in common organic solvents. Both the thermal stabilities and Tg values of P1 and P2 polymers were higher than P3 and P4.
References
- Synthesis and characterization of some carbazole-based imine polymers. Eur. Polymer J.. 2005;41:1079-1089.
- [Google Scholar]
- Synthesis and electrochemical polymerization of some monomers with Schiff base or vinylene structures and thiophene moieties. Eur. Polymer J.. 1999;35:587-599.
- [Google Scholar]
- Synthesis of electroactive polyazomethine and its application in electrochromic property and electrochemical sensor. Surf. Coat. Technol.. 2016;303:154-161.
- [Google Scholar]
- Oxidative polymerization of some monomers with pyrrole moieties an UV-vis absorption spectroscopy study. Eur. Polymer J.. 1999;35:1895-1905.
- [Google Scholar]
- The synthesis, characterization and thermal stability of oligo-4-hydroxybenzaldehyde. Polym. Degrad. Stab.. 2004;83:395-398.
- [Google Scholar]
- Synthesis, characterization and optimum reaction conditions of oligo-2-amino-3-hydroxypyridine and its Schiff base oligomer. Polymer. 2004;45:1743-1753.
- [Google Scholar]
- Processible polyazomethines and polyketanils: From aerospace to light-emitting diodes and other advanced applications. Prog. Polym. Sci.. 2008;33:289-345.
- [Google Scholar]
- Synthesis, characterization and thermal degradation of oligo-2-[(4-hydroxyphenyl)imino-methyl]-1-naphtol and oligomer metal complexes. J. Macromol. Sci. Part A. 2006;43:719-733.
- [Google Scholar]
- Synthesis, characterization, thermal analysis, and band gap of oligo-2-methoxy-6-[(4-methylphenyl) imino] methylphenol. J. Appl. Polym. Sci.. 2007;104:3417-3426.
- [Google Scholar]
- Synthesis and spectral characterization of cross linked rigid structured Schiff base polymers: Effect of substituent position changes on optical, electrical, and thermal properties. Polymer Plastics Technol. Eng.. 2016;55:368-3788.
- [Google Scholar]
- Synthesis, spectral characterization and biocidal activity of thermally stable polymeric Schiff base and its polymer metal complexes. J. Inorg. Organomet. Polym Mater.. 2011;21:673-681.
- [Google Scholar]
- A new soluble Schiff base polymer with a double azomethine group synthesized by oxidative polycondensation. Des. Monomers Polym.. 2006;9:169-179.
- [Google Scholar]
- The synthesis and properties of oligosalicylaldehyde and its Schiff base oligomers. Polymer. 2001;42:4859-4865.
- [Google Scholar]
- Lewis acid catalyzed highly selective halogenation of aromatic compounds. Synlett. 2005;18:2837-2842.
- [Google Scholar]
- A new approach for synthesis of electroactive phenol based polymer: 4-(2,5-di(thiophen-2-yl)-1H-pyrrol-1-yl)phenol and its oxidative polymer. Prog. Org. Coat.. 2012;73:239-249.
- [Google Scholar]
- Synthesis and thermal properties of a novel Schiff base oligomer with a double azomethine group and its Co(II) and Mn(II) complexes. J. Macromol. Sci. Part A. 2008;45:406-414.
- [Google Scholar]
- Synthesis and characterization of the polyaminophenol derivatives containing thiophene in side chain: Thermal degradation, electrical conductivity, optical-electrochemical, and fluorescent properties. J. Appl. Polym. Sci.. 2011;121:3028-3040.
- [Google Scholar]
- Synthesis and Characterization of new type oligomer Schiff bases based on oligophenol. Adana, Turkey: Institute of Science and Technology, Cukurova University; 2006. p. :108. (Master theses)
- Synthesis and characterization of fluorescent polyphenol species derived from methyl substituted amino pyridine based Schiff bases: The effect of substituent position on optical, electrical, electrochemical, and fluorescence properties. Synth. Met.. 2010;160:911-920.
- [Google Scholar]
- Low-band gap polymers for photovoltaic applications. Thin Solid Films. 2004;451:7-11.
- [Google Scholar]
- Chelate polymers. VI: new copolymers of the some siloxane containing dihydroxybenzaldehydimine)-me2+ with bis(pcarboxyphenyl)diphenylsilane. J. Organomet. Chem.. 2004;689:3005-3011.
- [Google Scholar]
- Electrochemical and optical studies of PPV derivatives and poly(aromatic oxadiazoles) Synth. Met.. 1997;84 359–60
- [Google Scholar]
- Preparation and characterization of poly(azomethines) containing ether and methylene bridges: Photophysical, electrochemical, conductivity and thermal properties. J. Fluoresc.. 2017;27:379-389.
- [Google Scholar]
- Synthesis and characterization of fluorescent graft fluorene-co-polyphenol derivatives: The effect of substituent on solubility, thermal stability, conductivity, optical and electrochemical properties. React. Funct. Polym.. 2010;70:815-826.
- [Google Scholar]


