

Translate this page into:
Synthesis and characterization of graphene oxide (GO) sheets for pathogen inhibition: Escherichia coli, Staphylococcus aureus and Pseudomonas aeruginosa
⁎Corresponding author. Phone: +30-6937687718; Fax: +30-210-5613707. leda@imdlaboratories.gr (Leda G. Bousiakou)
-
Received: ,
Accepted: ,
This article was originally published by Elsevier and was migrated to Scientific Scholar after the change of Publisher.
Peer review under responsibility of King Saud University.
Abstract
It is well known that graphene oxide (GO) possesses antibacterial properties towards both Gram-positive and Gram-negative bacteria. As a result, it has recently attracted a lot of interest as an active component towards pathogen inhibition. The aim of this paper is to prepare graphene oxide sheets, with two different oxygen concentrations of 15% and 39%, characterize them, and then investigate in vitro their antimicrobial efficacy in both Gram-positive and Gram-negative bacteria. In particular, GO sheets are synthesized via the Hummer’s method and subsequently, electron microscopy (SEM), X-ray diffraction (XRD) and Raman spectroscopy are used to investigate the GO sheet morphology and structure, while Energy Dispersive X-ray Spectroscopy (EDS) is employed for elemental analysis. Subsequently, clinical isolates of Escherichia coli, Staphylococcus aureus and Pseudomonas aeruginosa are incubated with different concentrations of GO sheets, ranging from 0.25 mg/ml to 1.5 mg/ml for 24 h at 37 °C to evaluate the antimicrobial effect. The results confirmed that that Gram positive bacteria are more sensitive to GO, while GO with a higher oxygen content exhibits increased antibacterial activity.
Keywords
Graphene oxide
GO
Hummer method
Antibacterial activity
Escherichia coli
Staphylococcus aureus
Pseudomonas aeruginosa

1 Introduction
Pathogen mediated infections can lead to both acute or chronic illness. In particular, despite the initial decrease of infections with the advent of Penicillin, issues related to microorganism resistance to antibiotics has become a serious concern (Nathan, 2020; Naylor et al., 2018). For example, Staphylococcus aureus a Gram-positive bacterium as well as Escherichia coli and Pseudomonas aeruginosa that are Gram negative bacteria are common multi-drug resistant pathogens responsible for various hospital acquired infections. In this regard, it has been estimated that by 2050, the death quote attributed to antimicrobial resistance will reach 10 million worldwide with costs estimated at €1.5 billion annually due to the increase in healthcare costs (WHO, 2021). As a result, the demand for developing new antimicrobial therapies has become crucial.
Similar interest exists also for antiseptics, that weaken and slow the growth of bacteria. Currently, the use of iodine and silver-ion containing topical antiseptics has been associated with risks such as skin reactions and hyperthyroidism (Gunasekaran et al., 2012; Pavlík et al., 2019). Moreover, such compounds have low penetration and thus can prove ineffective in deeply infected wounds and burns. As a result, the exploration of novel antibacterial agents, as efficient alternatives with a low cost is at the forefront of research. In this regard, the application of nanomaterials in tackling different aspects of infection has been impressive (Wang et al., 2017; Yougbaré et al., 2021). In particular, graphene based materials such as graphene oxide (GO) are promising replacements due to their easy preparation, low cost, unique catalytic activities and high surface area (Gurunathan et al., 2012; Xia et al., 2019). GO is considered as a functionalization of a graphene sheet (Allen et al., 2010) with oxygen species as seen in Fig. 1 below. In particular, it can be described as a graphene sheet with hydroxyl and epoxide on the basal plane and carbonyl and carboxyl on its edges.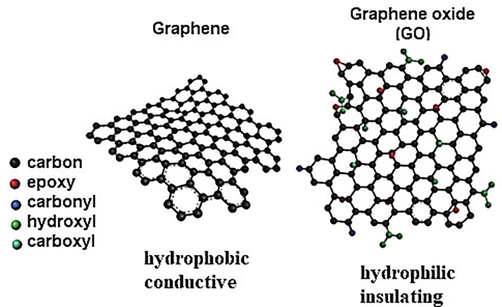
The chemical structures of graphene oxide (Nayak, 2016).
GO has proven effective in a number of applications, such as a metal free catalyst for the water treatment of organic pollutants (Liu, 2017), medical cloths for wound disinfection and healing (Soliman et al., 2021; Palmieri et al., 2016), as well as on antibacterial coatings of surgical devices (Morimoto et al., 2016) and silicon tubes of catheters (Choudhary and Das, 2019). GO has shown bactericidal activity on a wide range of both Gram-positive and Gram-negative bacteria as well as antifungal properties. In general, the highly oxygenated surface of GO, containing hydroxyl, epoxy and carbonyl functional groups allows it to readily swell and disperse in solution. The negative charge of the oxygen species allows the dispersion of GO as a single sheet by providing electrostatic repulsion and solvation (Szunerits and Boukherroub, 2016).
A number of mechanisms have been suggested for its antibacterial action. On the one hand the reactive groups of GO suggest a strong interaction with cell walls, targeting lipids as well as DNA, RNA and cell proteins. In particular, when lipids are attacked, there is a decrease in membrane fluidity, alteration in membrane properties and disruption of membrane-bound proteins that results in the cytoplasmic membrane damage of the bacteria (Liu and Chen, 2015). Another route of action that has been suggested is the damage of cells by the sharpened edges of GO, trapping of pathogen cells by GO sheets as well as electron transfer from pathogen membranes to GO (Seifi and Kamali, 2021; Akhavan and Ghaderi, 2010).
In this work, we investigate the effects of oxygen content- 15% and 39% in GO samples as a parameter in antibacterial activity both in Gram positive and Gram-negative bacteria. We thus prepare GO sheets of two different oxygen concentrations via the Hummer method, characterize them and then evaluate their antimicrobial activity, using clinical isolates of Escherichia coli, Staphylococcus aureus and Pseudomonas aeruginosa.
2 Materials and method
GO sheets are prepared via the Hummer method and their morphology, structure and oxygen content are investigated. In particular EDS mapping, SEM, XRD as well as Raman measurements are performed. All reagents have been purchased from Sigma Aldrich, unless otherwise indicated and Millipore water is used.
2.1 Material synthesis
GO was synthesized via the Hummer’s method. In particular, 1 g graphite and 0.5 g of sodium nitrate NaNO3 were stirred in a flask with 23 ml of sulphuric acid H2SO4. The flask was then put into an ice bath and continuously stirred for 30 min. After that, 0.25 g of potassium permanganate KMNO4 were gradually added over a period of 30 min under continuous stirring, and then the reaction mixture was allowed to reach room temperature before being heated to 35 °C for 30 min. After that 46 ml of Millipore water were added slowly to the mixture and the temperature was increased to 98 °C. The temperature of the mixture was then kept at 98 °C for 30 mins under continuous stirring. After that 140 ml of Millipore water were added as well as 10 ml of 10% hydrogen peroxide (H2O2) to remove the unreacted KMNO4.The mixture was then allowed to settle and decant. It was then vacuum filtered and washed using 200 ml of 5% hydrochloric acid (HCl) and Millipore water. Finally, GO was dried at 60 °C in a furnace and crushed to get GO powder using pestle and mortar. In order to increase the amount of oxygen concentration in our GO, samples, the amount of KMNO4 was increased to 1.5 g, and the same procedure was followed. Fig. 2 shows the two types of powder, obtained. It is noted that GO with a higher oxygen concentration presented slightly brownish in color compared with the sample with a lower oxygen content.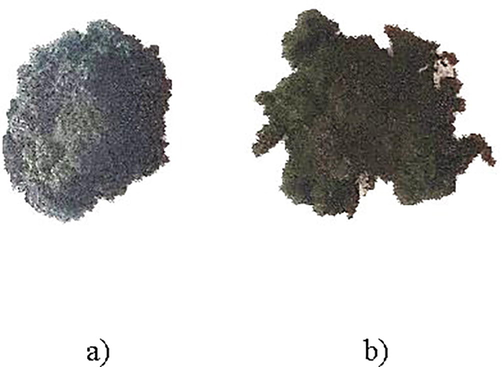
Graphene oxide powder a) higher oxygen content and b) lower oxygen content.
2.2 Characterizations
GO is formed by heavily oxidizing graphite to chemically exfoliate the flakes of the graphitic stack into mono- and few-layer sheets, depending on the degree of oxidation and post-processing. It is nevertheless well known that GO can be difficult to characterize and define broadly because of its inherent non-stoichiometric structure and dependence on production parameters.
In this work scanning electron microscopy was performed using a JEOL JSM-6510 in the SEI mode with an accelerating voltage of 20 kV to explore the morphology of the produced GO, while EDS was also employed for elemental analysis. Furthermore, the structural characteristics of the GO produced were observed using X-ray diffraction. In particular a Bruker D8 Discoverer diffractometer was used applying CuKa radiation (λ = 1.5418 Ǻ). The Raman spectrum was also recorded for comparison via a Renishaw inVia Raman microscope system equipped with a 514-nm laser beam.
2.3 Preparation of bacterial cultures and the Kirby Bauer tests
Kirby Bauer tests, also called zone inhibition tests, were performed as a qualitative method to test the ability of GO (15% and 39%) to inhibit microbial growth in Gram-positive and Gram negative bacteria. In particular, inculums were prepared from clinical strains of Escherichia coli Staphylococcus aureus and Pseudomonas aeruginosa touching with a loop the tops of the colonies and suspending them in saline. Using a McFarland Biosan 1B Densitometer, 0.5 MacFarland units (108 CFU/mL) from each strain, were measured and then 100 μl of these suspensions were spread over an agar plate using a sterile swab. Furthermore, both GO samples of higher and low oxygen content were sonicated in Millipore water and 20 μl then pipetted onto 6 mm diameter prepared Whatman1 paper filter disks. This was repeated for different concentrations, i.e. 0.25 mg/ml, 0.5 mg/ml, 1 mg/ml and 1.5 mg/ml. The discs were placed using forceps on the agar plates, and subsequently the bacterial cultures were incubated in the presence of GO for more than 24 h at 37 °C. The inhibition zones around each sample were then measured using a Vernier calliper.
3 Results and discussion
3.1 Electron microscopy studies and EDS analysis
Scanning electron microscopy (SEM) as seen in Fig. 3a and b below, of the low and high oxygen content sample. In both cases, highly-wrinkled GO layers can be observed proving that there is a distortion in the graphene layers due to the linkage of the residual oxygen.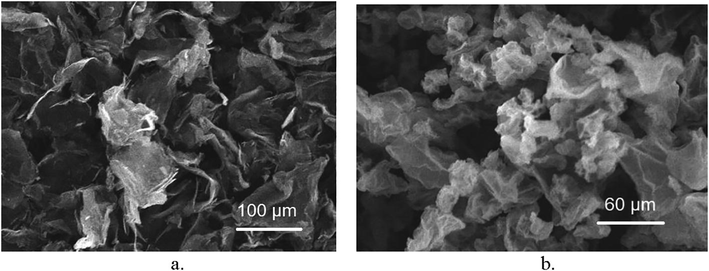
SEM images showing the morphology of a. the low oxygen content sample and b. the higher oxygen content sample showing the GO layer wrinkling as a result of the oxygen present.
Furthermore, the energy dispersive X-ray spectrum measurements (EDS) of the prepared GO powders revealed the elemental composition for the different samples. It was identified that the low oxygen content sample corresponds to a 0.25gr KMNO4 in the preparation, while a higher amount of KMNO4 led to higher oxygen content samples. In particular, Fig. 4 below, corresponds to the EDS spectrum of the low oxygen content sample, with an oxygen (O) content of 15% according to the elemental analysis (Table 1). The low sulfur (S) peaks are due to treatment process with H2SO4.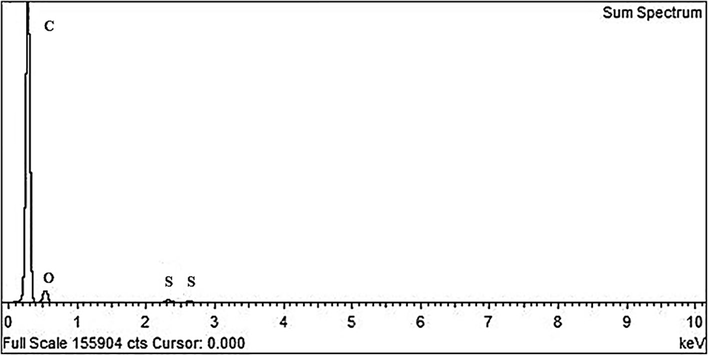
EDS spectra corresponding to an oxygen content (O) of 15%, carbon (C) and low sulfur (S) peaks due to the treatment process with H2SO4.
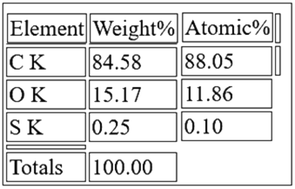
Elemental analysis in Table 1 below revealed the oxygen content to be 15%.
The corresponding elemental maps are seen in Fig. 5 below: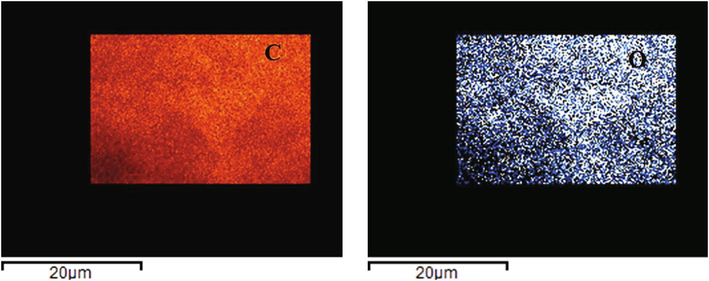
Elemental maps of Carbon (C) 85% and Oxygen (O) 15%.
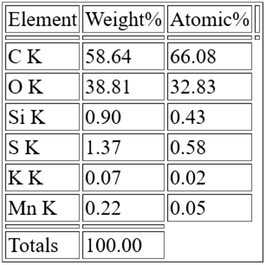
Furthermore, the energy dispersive X-ray spectrum measurements (EDS) of the second GO sample revealed (Fig. 6) a higher oxygen content (O) of 39% according to the elemental analysis (Table 2). As seen in Table 2, low sulfur (S), manganese (Mn), potassium (K) peaks can be seen due to the preparation process, while low content (Si) is present as a contamination.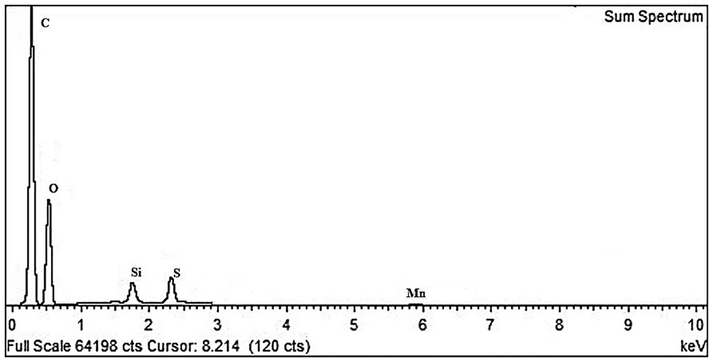
EDS spectra corresponding to a higher oxygen content (O) of 39%, carbon (C) and low sulfur (S) peaks due to treatment process with H2SO4.
The corresponding elemental maps are seen in Fig. 7 below: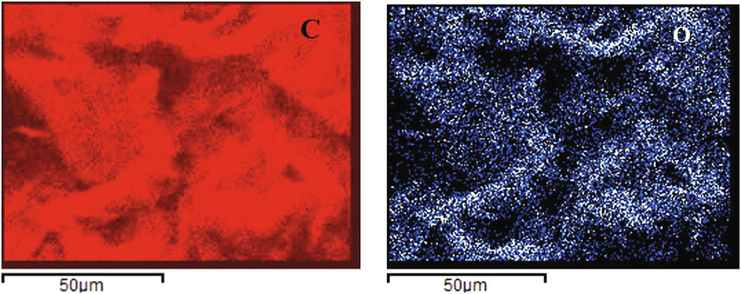
Elemental maps of Carbon (C) 61% and Oxygen (O) 39%.
3.2 X-ray diffraction (XRD) and Raman studies
XRD patterns of the 15 % oxygen content sample and the 39% oxygen content sample can be seen in Fig. 8 below. In particular, the XRD patter of the 15% oxygen content sample, shows a narrow sharp peak at 26.3°, corresponding to the (0 0 2) graphitic plane, while an additional weaker peak at 44.3° corresponds to the formation of GO (Johra et al., 2014; Tokarczyk et al., 2014). This is in agreement with previous work, where a narrowing of the graphitic peak at appears upon oxidation of graphite (Krishnamoorthy et al., 2013). For the samples with an 39% oxygen (O) content, we note a decrease of the graphitic peak at 26.3° and an appearance of the typical 9.98° GO peak corresponding to the (0 0 1) plane confirm successful oxidation of graphite (Ain et al., 2019). It should be noted that in general, with a decreasing the amount of KMnO4, a heterogeneous mixture of GO and unoxidized graphite is formed (Morimoto et al., 2016).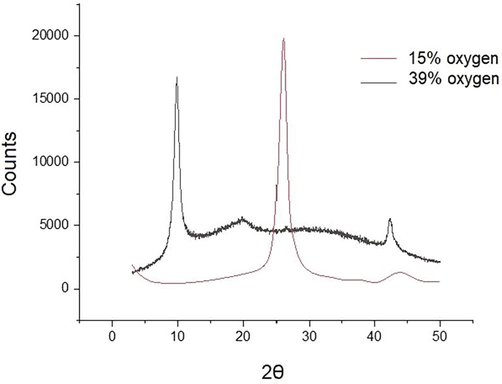
XRD spectrum of GO, with an 15% and 39% Oxygen (O) content.
The Raman spectra, show results consistent with the XRD analysis. The Raman spectra of the low oxygen content sample (Fig. 9), have the typical appearance of graphite (Reich and Thomsen, 2004), confirming its low conversion to GO.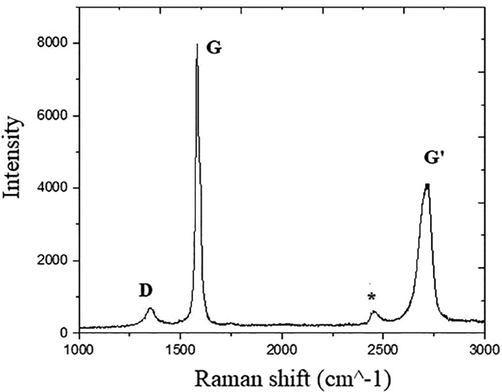
Raman spectra of the 39% oxygen content sample.
In particular, we identify the G band appearing at 1582 cm−1, the D band, at about 1356 cm−1 and the G’ – band at about 2720 cm−1. The peak at around 2400 cm−1 comes from the Raman mode of N2 present in the air surrounding the sample (Pimenta et al., 2007). In general, the G band is due to E2g mode at the Γ-point and arises from the stretching of the C–C bond in graphitic materials, and is common to all sp2 carbon systems. The D band is attributed to the presence of structural defects, with Raman spectroscopy being one of the most sensitive techniques to characterize disorder in sp2 carbon materials (Merlen et al., 2017). In the high oxygen content sample (Fig. 10), there is an increase of the D band, due to the disruption of sp2 bonds of the carbon due to the oxidative functional groups of GO (Johra et al., 2014; Liu et al., 2011).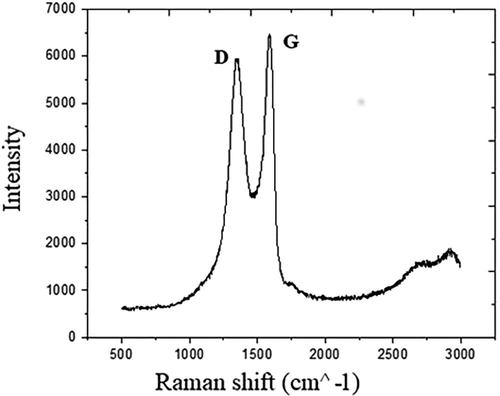
Raman spectra of the 39% oxygen content sample.
We thus conclude that as the amount of KMnO4 decreases, the sample contains predominantly unoxidized graphite with only few oxidized domains present. On the other hand, as the KMNO4/graphite ratio increases, the amount of oxidation also increases.
3.3 Antibacterial cultures
During incubation, the GO antimicrobial agent leaches to the agar, exerting a growth inhibiting effect on the bacteria, with a clear zone appearing around each disk. In particular, the larger the size of the inhibition zone measured, the more potent the antibacterial agent was identified in all cases of Staphylococcus aureus, Escherichia coli and Pseudomonas aeruginosa as can be seen in Tables 3, 4 and 5 below. The control used in all cases was Millipore water, that yielded a 0.00 ± 0.00 inhibition zone in all cases.
S. aureus
Gram positive
Mean zone of inhibition (mm)
Mean zone of inhibition (mm)
Antibacterial Agent
GO
15%
GO
39%
0.25 mg/ml
10.53 ± 0.24
22.88 ± 0.19
0.5 mg/ml
12.74 ± 0.31
25.10 ± 0.26
1 mg/ml
13.15 ± 0.12
26.90 ± 0.14
1.5 mg/ml
15.27 ± 0.18
31.42 ± 0.17
E. coli
Gram negative
Mean zone of inhibition (mm)
Mean zone of inhibition (mm)
Antibacterial Agent
GO
15%
GO
39%
0.25 mg/ml
8.03 ± 0.17
17.10 ± 0.14
0.5 mg/ml
9.44 ± 0.21
19.22 ± 0.16
1 mg/ml
10.92 ± 0.11
20.37 ± 0.19
1.5 mg/ml
12.77 ± 0.15
24.11 ± 0.23
P. Aeruginosa
Gram negative
Mean zone of inhibition (mm)
Mean zone of inhibition (mm)
Antibacterial Agent
GO
15%
GO
39%
0.25 mg/ml
7.43 ± 0.17
12.016 ± 0.13
0.5 mg/ml
8.54 ± 0.10
14.11 ± 0.23
1 mg/ml
11.02 ± 0.16
21.20 ± 0.19
1.5 mg/ml
12.27 ± 0.21
23.11 ± 0.17
The results showed that GO with a higher oxygen content of 39% showed increased effectiveness towards inhibiting the reproduction of all three pathogens and thus a concentration dependent antibacterial activity (Liu et al., 2011). This is expected as on a higher oxygen content allows improved solubility of GO. Moreover, a higher number of oxygen containing function groups, enhances reactive oxygen species production (ROS), such as singlet oxygen, hydroxyl radicals, superoxide ions, and hydrogen peroxide prompting improved antimicrobial activity.
In particular, Staphylococcus aureus, which is a Gram positive bacterium showed the most sensitivity to GO for all oxygen concentrations. This difference could also be traced to different cell structure in Gram-positive and Gram-negative bacteria and the tendency of Gram positive bacteria to form clusters (Frohlich and Frolich, 2016; Pulingam et al., 2019). In particular, the Gram positive bacteria form clusters leading to an increased GO exposure, in contrast with Gram negative bacteria that are found either as single or paired cells. The result is that Gram positive bacteria show consistently an increased sensitivity towards GO. Furthermore, the cell walls of Gram negative bacteria, like Escherichia coli and Pseudomonas aeruginosa, are made of an external porous layer of lipopolysaccharide, while Gram positive bacteria have cell walls made up from multiple peptidoglycan layers. It has been suggested that as a result there is increased interaction of Gram positive bacteria with GO through electrostatic or hydrogen bonding (Deokar et al., 2013).
4 Conclusions
The use of GO is an attractive, low-cost approach for antibacterial action. This study suggests that oxygen content is an important parameter in considering antibacterial action. It is evident that in all bacteria, i.e. Escherichia coli, Staphylococcus aureus and Pseudomonas aeruginosa a higher oxygen content leads to improved antibacterial properties. This is a result of higher oxygenated GO surfaces dispersing easier in solution due to their hydrophilic nature. Moreover, its hydroxyl, epoxy and carbonyl functional groups lead to cell lysis by attacking lipids on the cell walls and further the cell content. In addition, the nature of the bacterial cell wall as well as the tendency of Gram-positive bacteria to group plays an important role increasing their sensitivity towards GO. This study can be extended by preparing GO with a wider range of different oxygen concentrations as well as comparing its antibacterial action for the same pathogens in comparison with widely used commercial antibiotics.
Conflict of interest
We have no conflict of interest to declare.
References
- The systemic effect of PEG-nGO-induced oxidative stress in vivo in a rodent model. Beilstein J. Nanotechnol.. 2019;10:901-911.
- [CrossRef] [Google Scholar]
- Toxicity of graphene and graphene oxide nanowalls against bacteria. ACS Nano. 2010;4(10):5731-5736.
- [CrossRef] [Google Scholar]
- Bio-reduced graphene oxide as a nanoscale antibacterial coating for medical devices. ACS Omega. 2019;4(1):387-397.
- [CrossRef] [Google Scholar]
- Single-walled carbon nanotube coated antibacterial paper: preparation and mechanistic study. J. Mater. Chem. B. 2013;1(20):2639-2646.
- [CrossRef] [Google Scholar]
- Cytotoxicity of nanoparticles contained in food on intestinal cells and the gut microbiota. Int. J. Mol. Sci.. 2016;17:509.
- [CrossRef] [Google Scholar]
- Silver nanoparticles as real topical bullets for wound healing. J. Am. Coll. Clin. Wound Spec.. 2012;3(4):82-96.
- [CrossRef] [Google Scholar]
- Oxidative stress-mediated antibacterial activity of graphene oxide and reduced graphene oxide in Pseudomonas aeruginosa. Int. J. Nanomed.. 2012;7:5901-5914.
- [CrossRef] [Google Scholar]
- Facile and safe graphene preparation on solution based platform. J. Ind. Eng. Chem.. 2014;20(5):2883-2887.
- [Google Scholar]
- The chemical and structural analysis of graphene oxide with different degrees of oxidation. Carbon. 2013;53:38-49.
- [CrossRef] [Google Scholar]
- Antibacterial activity of graphite, graphite oxide, graphene oxide, and reduced graphene oxide: membrane and oxidative stress. ACS Nano. 2011;5(9):6971-6980.
- [Google Scholar]
- Application of graphene oxide in water treatment. IOP Conf. Ser.: Earth Environ. Sci.. 2017;94:012060.
- [Google Scholar]
- Interactions of graphene oxide with model cell membranes: probing nanoparticle attachment and lipid bilayer disruption. Langmuir. 2015;31(44):12076-12086.
- [CrossRef] [Google Scholar]
- Merlen, A., Buijnsters, J., Pardanaud, C., 2017. A guide to and review of the use of Multiwavelength Raman spectroscopy for characterizing defective aromatic carbon solids: from graphene to amorphous carbons coatings, 7 (10):153. https://doi.org/10.3390/coatings7100153.
- Tailoring the oxygen content of graphite and reduced graphene oxide for specific applications. Sci. Rep.. 2016;6:21715.
- [CrossRef] [Google Scholar]
- Resisting antimicrobial resistance. Nat. Rev. Microbiol.. 2020;18:259-260.
- [CrossRef] [Google Scholar]
- Nayak P.K, ed., 2016, Recent Advances in Graphene Research, InTech Open, http://doi.org/10.5772/61909.
- Estimating the burden of antimicrobial resistance: a systematic literature review. Antimicrob. Resist. Infect. Control. 2018;7(1)
- [CrossRef] [Google Scholar]
- The future development of bacteria fighting medical devices: the role of graphene oxide. Expert. Rev. Med. Dev.. 2016;13(11):1013-1019.
- [CrossRef] [Google Scholar]
- Dual role of iodine, silver, chlorhexidine. and octenidine as antimicrobial and antiprotease. Agents PLoS ONE. 2019;14(1)
- [CrossRef] [Google Scholar]
- Studying disorder in graphite-based systems by Raman spectroscopy. Phys. Chem. Chem. Phys.. 2007;9:1276-1291.
- [CrossRef] [Google Scholar]
- Graphene oxide exhibits differential mechanistic action towards Gram-positive and Gram-negative bacteria. Colloids Surf. B: Biointerfaces. 2019;181:6-15.
- [Google Scholar]
- Raman spectroscopy of graphite. Philos. Trans. A Math. Phys. Eng. Sci.. 2004;362(1824):2271-2288.
- [Google Scholar]
- Anti-pathogenic activity of graphene nanomaterials: A review. Colloids Surfaces B: Biointerfaces. 2021;199:111509.
- [Google Scholar]
- Graphene oxide-cellulose nanocomposite accelerates skin wound healing. Vet. Sci. Res. J.. 2021;137:262-273.
- [CrossRef] [Google Scholar]
- Antibacterial activity of graphene-based materials. J. Mater. Chem. B. 2016;4(43):6892-6912.
- [CrossRef] [Google Scholar]
- Structural and electronic properties of graphene oxide and reduced graphene oxide papers prepared by high pressure and high temperature treatment. Acta Phys. Pol. A. 2014;126(5):1190-1194.
- [Google Scholar]
- The antimicrobial activity of nanoparticles: present situation and prospects for the future. Int. J. Nanomed.. 2017;12:1227-1249.
- [CrossRef] [Google Scholar]
- World Health Organization. Global antimicrobial resistance and use surveillance system (GLASS) report: 2021. https://apps.who.int/iris/handle/10665/341666. License: CC BY-NC-SA 3.0 IGO.
- Graphene-based nanomaterials: the promising active agents for antibiotics-independent antibacterial applications. J. Control Release. 2019;307:16-31.
- [CrossRef] [Google Scholar]
- Emerging trends in nanomaterials for antibacterial applications. Int. J. Nanomed.. 2021;16:5831-5867.
- [CrossRef] [Google Scholar]


