

Translate this page into:
Surface properties enhancements by optimizing synthesizing parameters of AA8026 + Zr2O3/TiO2 hybrid composite
⁎Corresponding authors. Sathish.sailer@gmail.com (T. Sathish), yusufshaikh.amu@gmail.com (Mohammad Yusuf)
-
Received: ,
Accepted: ,
This article was originally published by Elsevier and was migrated to Scientific Scholar after the change of Publisher.
Abstract
Aluminium alloy is one of the widely used lightweight materials and is utilized in the production of a wide variety of components. The AA8026 properties enhancements through optimizing the synthesizing parameters through the Taguchi route is the aim of this investigation. Thereby establishing control over the stir casting process to alter the wear and microhardness of AA8026 aluminium alloy by hybrid reinforcement. There were 16 samples of AA8026 + Zr2O3/TiO2 composite prepared as per Taguchi L16 orthogonal array. The process parameters varied four levels such as stirring time from 15 min to 30 min, quantity of reinforcement from 3 wt% to 12 wt%, molten temperature from 750 °C to 900 °C, and stirring speed from 450 rpm to 600 rpm. The fabricated samples are investigated for microhardness and wear properties. From the analysis, it is inferred that stirring speed is highly influenced by wear and microhardness properties. The results exemplify that 0.086 mm3/m was minimum wear and 180.2 HV was maximum microhardness achieved.
Keywords
AA8026
Stir casting process
Zr2O3
TiO2, wear
Microhardness

1 Introduction
Composite materials are made from various components and are strong and good for product production (Han et al., 2022). Composite materials' low weight and excellent strength have made them prominent in the automobile sector (Xiang et al., 2024). Alloy objects are widely used due to advances in material science and modern technology's high-performance demands (He et al., 2024). Aluminum composite bars may replace steel bars in NSM-reinforced concrete members. These materials are now consumed more. Aluminum-Metal Matrix Composites (AMMCs) are used in many automobile parts, including cylinder liners, pistons, and brakes (Bandhu et al., 2018; Behera et al., 2019; Bhowmik et al., 2021). Aluminum alloys are utilized to make most domestic products, electrical conductors, and food packaging. Some cars employ aluminum alloys (Bose and Nandi, 2020). AMMCs may be made via stir casting or powder metallurgy. Both procedures are discussed here. Liquid metallurgy includes stir casting. This technique involves melting the material at high temperatures and mixing it with hard ceramic particles (Faisal and Kumar, 2018; Fatile et al., 2017). Testing different stir-casting settings helps enhance the process. It is one of the cheapest and most frequently accepted procedures for creating a uniform mixture of component materials (Hima Gireesh et al., 2018; Idrisi and Mourad, 2019; Inegbenebor et al., 2018). Stir casting's simplicity, adaptability, and high-volume manufacturing capability are among its many advantages. Stir casting is a cost-effective method for making large AMMC components (Kandpal et al., 2022; Kaushik and Sandeep, 2018). Stir casting reduces chemical interactions between the base material and the reinforced particles, resulting in cast AMMCs with low porosity (Khatkar et al., 2018). Stir-casting mixes base material with reinforced particles and homogenises them by varying stirring speed. When stir-casting AMMC, the difficulty of even reinforcement material distribution, wettability of composite materials, porosity of cast AMMC, and chemical reactions between reinforcement material and matrix alloy must be considered (Shabani et al., 2020). In stir-casting, reinforcing particles must be dispersed in the molten base matrix during casting. Issues might arise during this phase because of the density difference between the base material melt, alloing components, and reinforcing materials (Shakir and Alsaheb, 2023). Stir casting avoids this via vortexing. After melting the matrix material and stirring it aggressively to generate a vortex, the reinforcing material is applied to the exterior of the vortex. A time is spent stirring the slurry before casting. For quality cast samples of metal matrix composites, matrix alloy and reinforcement particles must be wetted (Shakir and Alliwe, 2021). Wettability defines a liquid's penetration and spread over solids. Melt must wet solid ceramic phase to incorporate solid ceramic particles in casting. Stir-cast metal matrix composite samples have porosity issues. Effective mechanical stirring reduces it (Shakir and Abdlsaheb, 2022). Additionally, it reduces casting corrosion resistance. Hydrogen evolution, shrinkage during solidification, and gas trapping during mixing cause porosity. Porosity formation depends on holding times, stirring speeds, and impeller design, size, and location (Sharma et al., 2022). Stir casting process factors include stirring speed, duration, holding time, pouring temperature, and impeller size and position that impact sample quality. Adjusting these variables improves cast MMC porosity and wettability (Shayan et al., 2019). Many statistical methods may be used to analyze experiment results. Genichi Taguchi developed Taguchi statistics to improve manufacturing quality. Taguchi is a strong design approach (Kn, 2022; Kumar Bhoi et al., 2020; Kumar et al., 2020). Due to industrial advances, the Taguchi technique is applied in all technological applications, biotechnology, marketing, and advertising. The Taguchi optimization method is preferred for quality-based testing (Kumar et al., 2022). Two smooth surfaces in contact and loaded undergo “sliding wear” relative motion. Pin-on-disc apparatus, sliding distance, sliding velocity, and applied stress are needed for wear study (Kumar et al., 2017; Mozammil et al., 2019; Muduli et al., 2022). When stress is raised, material is lost faster and surfaces acquire delaminated changes and craters (Pazhouhanfar and Eghbali, 2018). Various hardness tests may be performed to evaluate a material's microhardness, which is assessed by an indentation (Qasim, 2022). The microhardness test measures material hardness quickly and accurately. The issue is how reinforcing changes aluminum alloy AA8026 surface attributes like wear and microhardness. Does reinforcing affect stir-casting parameters? This experimental research sought to answer these problems. The reinforcing type and range used to change AA8026′s surface characteristics are unique in this work. This study adjusted reinforcing and stir-casting synthesis parameters to reduce wear.
Due to its performance, durability, and cost-effectiveness, aluminum alloy AA8026 is used in industries like aerospace, automobile, marine, and others that need lightweight, high-strength materials. Improving surface quality by changing synthesizing parameters would increase functional reliability in its applications (Kuang et al., 2018). Thus, this study has a worldwide impact.
This experiment tested hybrid aluminium metal matrix composites (AA8026 + Zr2O3/TiO2) for wear and microhardness. This work uses Taguchi analysis to determine stir-casting process parameter optimum values (Radhika et al., 2021). Cast AMMCs' microhardness and wear resistance increase with parameter adjustment.
2 Materials and methods
Purpose of this experimental work, the aluminium alloy AA8026 was chosen to serve as the basis material. Hard particles, such as zirconium oxide-based (Zr2O3) powder (Purity: >99.9 %, average particle size: 30–45 µm and titanium dioxide (TiO2) powder (99.5+ % and Size: 1 µm), were added to the basic material to make it stronger. The base material and the reinforced particles were procured from Asian Chemical Corporation in Chennai. The AA8026 aluminum alloy was utilized as a matrix material. For this investigation, several key process factors of the stir-casting technique were considered to optimize and fine-tune the synthesizing process (Rao, 2018). The statistical model and optimization were designed and carried out by using the Minitab-18 software.
3 Experimental procedure
When using stir casting, the base material and reinforced particles are essentially melted down as the reinforcement is not melted before being added (Rajesh et al., 2019; Rana et al., 2022 Jan 5; Rangrej et al., 2021). Hybrid composites were manufactured at a rapid pace using this method; a simplified illustration of the stir-casting procedure (Rao, 2018). Both the powders of the reinforced particles Zr2O3 and TiO2 are subjected to preheating in the crucible with varying amounts of their respective weights (3 wt%, 6 wt%, 9 wt% and 12 wt%). The preheating process eliminates humidity that may have been present in the reinforced particles and enhances wettability; a crucible at a temperature of 600 °C for five hours was maintained in this study (Reddy et al., 2018; Sakthivelu et al., 2021; Senthil Kumar et al., 2019). With the assistance of a bottom pouring furnace, aluminium alloy AA8026 is maintained at a temperature of 750 °C. After that, the molten matrix material was mechanically stirred to generate a fine vortex in the melt. At a steady feed rate, the molten base materials are combined with the molten reinforced particles; in this case, a mixture of warmed Zr2O3/TiO2 particles and an equivalent weight of flux (10 wt% of Zr2O3/TiO2) was fed into a vortex. During the procedure, argon gas was added to the melt to create an inert environment. The mixture is stirred to obtain the complete standardised mixture of reinforcement elements in the base materials. The molten mixture was stirred before being poured into the heated permanent mould. Three distinct pouring temperatures were maintained while the melt's temperature was kept at an average of 860 °C. Castings with different weight percentages of Zr2O3/TiO2 particles (3 wt% and 12 wt%) were taken. The detailed procedure for the casting process was explained by (Srivyas and Charoo, 2008) and they were observed in this fabrication process.
It is possible to optimize the stir casting process by adjusting the weight percentage of reinforced particles added, the stirring speed, and the amount of time the mixture is stirred. By adjusting the values of these variables, the stir-casting process can be optimized. By pouring molten material into a die of the desired dimensions, the required number and size of samples can be produced.
3.1 Test for wear characteristic
ASTM G99 defined the wear test specimen preparation, and the DUCOM model equipment performs the dry sliding wear test. The wear test specimens are 12 mm in diameter and 40 mm long, as shown in Fig. 1. The wear test starts after cleaning and weighing each specimen. Acetone was used to clean the spinning disc, and the weight difference was utilized to measure wear and mass loss. A computerized balance weighs materials after the abrasion test. The wear test involves holding specimens upright and contacting the rotating disk. The next step is to compute wear characteristics using sample beginning and ending weights.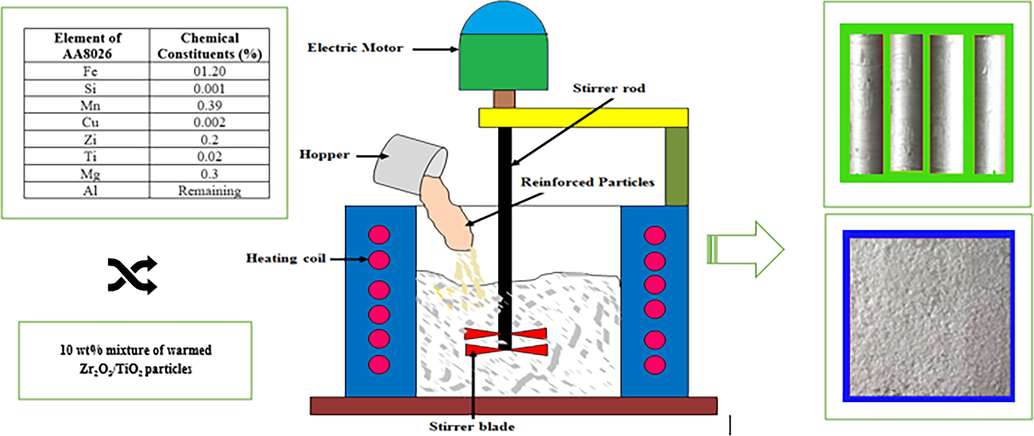
An illustrative diagram of the stir casting process.
3.2 Microhardness test
In this experiment, the ASTM E384 requirements were properly followed to perform the microhardness test. This study uses a Vickers hardness machine for hardness analysis. All samples are cleaned before testing. After enough trial runs, each reading is averaged. Process parameters were varied at Four levels. Pouring temperatures (A) was 750 °C, 800 °C, 850 °C, and 900 °C; hybrid reinforcement amount (B) was 3 wt%, 6 wt%, 9 wt%, and 12 wt%; stirring duration (C) was 15 min, 20 min, 25 min, and 30 min; and stirrer speed (D) was 450 rpm, 500 rpm, 550 rpm, and 600 rpm. Table 1 shows the experimental design (L16 orthogonal array), microhardness, and wear rate.
Index of Run
A
B
C
D
Rate of Wear (mm3/m)
Signal to Noise ratio
Microhardness (HV)
Signal to Noise ratio
1
3
450
15
750
0.231
12.72
90.3
39.10
2
3
500
20
800
0.382
8.357
124.9
41.92
3
3
550
25
850
0.298
10.51
145.3
43.24
4
3
600
30
900
0.599
4.45
136.8
42.72
5
6
450
20
850
0.086
21.31
73.8
37.36
6
6
500
15
900
0.392
8.13
133.7
42.52
7
6
550
30
750
0.689
3.23
168.4
44.52
8
6
600
25
800
0.623
4.11
175.6
44.89
9
9
450
25
900
0.394
8.09
85.5
38.63
10
9
500
30
850
0.612
4.26
158.3
43.99
11
9
550
15
800
0.734
2.68
136.9
42.73
12
9
600
20
750
0.826
1.66
174.3
44.82
13
12
450
30
800
0.651
3.72
165.8
44.39
14
12
500
25
750
0.765
2.32
180.2
45.11
15
12
550
20
900
0.474
6.48
142.1
43.05
16
12
600
15
850
0.396
8.04
156.3
43.87
4 Results and discussions
The observations were analysed in Taguchi analysis and the output of signal-to-noise ratios was presented for each run for the rate of Wear and microhardness. The minimal wear rate was calculated to be 0.086 mm3/m, and the associated values for each parameter are listed in Table 1. The lowest recorded wear rate was achieved at a 6 wt% reinforcement level, 450 rpm stirring speed, 20 min of stirring time, and 850 °C molten temperature.
As a result of performing an analysis on the microhardness, all of the parameters that were involved have been compiled into Table 1, where it can be seen that the highest microhardness achieved was 180.2 HV. A higher microhardness value was accomplished by using a molten temperature of 750 °C, a stirring time of 25 min, a stirring speed of 500 rpm, and 12 wt% reinforcement.
Table 2 shows that stirring speed influenced the final product based on rank order and delta values. The temperature of the molten material has the most influence after reinforcing, followed by stirring time. According to Taguchi analysis, the best sample with a lowest wear rate of 0.086 mm3/m had 6 wt% reinforcement, 450 rpm stirring speed, 20 min of stirring, and 850oC molten temperature. When reinforcement was raised from 3 wt% to 6 wt%, the wear rate decreased, but when increased further, wear rate rose. After considering all aspects, 450 rpm and 20 min of stirring time had the lowest wear rates. Using molten temperature, 8500C has the lowest wear rate. This is 89.59 less than the sample generated at run number 12 parameters. (See Table 1).
Level of the Parameter
Wear rate
Microhardness
A
B
C
D
A
B
C
D
1
9.013
11.46
7.899
4.988
41.75
39.88
42.06
43.39
2
9.198
5.771
9.453
4.721
42.33
43.39
41.79
43.49
3
4.175
5.73
6.261
11.03
42.55
43.39
42.97
42.12
4
5.146
4.567
3.92
6.79
44.11
44.08
43.91
41.73
Delta
5.022
6.897
5.533
6.313
2.36
4.2
2.12
1.75
Rank
4
1
3
2
2
1
3
4
Smaller is better
Larger is better
In the microhardness investigation, stirring speed had the greatest influence, followed by reinforcing percentage, molten temperature, and stirring speed. Table 2 shows research outcomes. With 6 wt% reinforcement, 450 rpm stirring speed, 20 min stirring time, and 850 °C molten temperature, the wear rate was 0.086 mm3/m. See Fig. 2(b).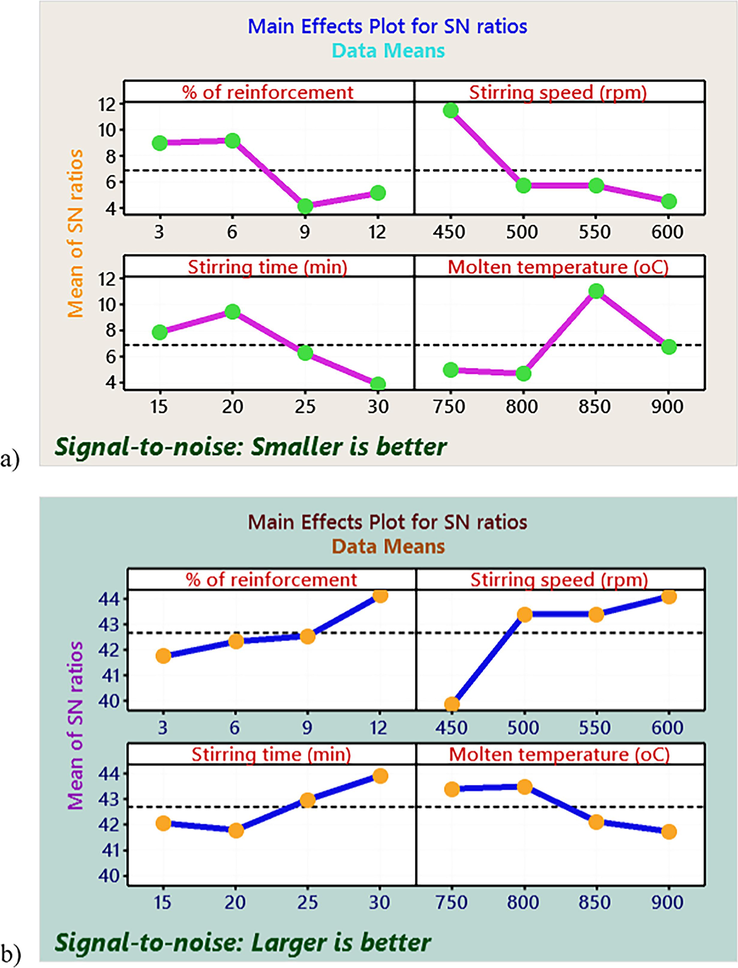
Tauguchi Output −Main effects plot for S/N ratio for the observations of a) wear analysis and b) Microhardness.
In the case of wear rate (WR), All of the contribution percentages were estimated using the F-value, and a higher F-value indicates that the parameter has the greatest possible contribution (Refer to Table 3).
Source
DF
Seq SS
Contribution
Adj SS
Adj MS
F-Value
P-Value
Regression
WR
4
0.45634
69.28 %
0.45634
0.11409
6.2
0.007
µH
4
12,466
76.56 %
12,466
3116.5
8.98
0.002
A
WR
1
0.12044
18.28 %
0.12044
0.12044
6.55
0.027
µH
1
2475
15.20 %
2475
2475.2
7.13
0.022
B
WR
1
0.1353
20.54 %
0.1353
0.1353
7.36
0.02
µH
1
5755
35.34 %
5755
5754.7
16.59
0.002
C
WR
1
0.09153
13.90 %
0.09153
0.09153
4.98
0.047
µH
1
2085
12.81 %
2085
2085
6.01
0.032
D
WR
1
0.10908
16.56 %
0.10908
0.10908
5.93
0.033
µH
1
2151
13.21 %
2151
2151
6.2
0.03
Error
WR
11
0.20234
30.72 %
0.20234
0.01839
µH
11
3817
23.44 %
3817
347
Total
WR
15
0.65869
100.00 %
µH
15
16,282
100.00 %
Maximum microhardness values were recorded when the reinforcement level was increased to 12 wt%, the speed of the stirrer was increased to 600 rpm, and the period of stirring was increased to 30 min. When the molten temperature was increased from 750 °C to 800 °C, the result saw an increase in the microhardness values (Refer to Fig. 2b).
The prediction models were developed and presented in equation (1) for wear rate and in equation (2) for microhardness.
Mathematical model to predict Wear rate.
Mathematical model to predict Microhardness.
From the ANOVA analysis, the stirring speed was highly contributed up to 20.54 %, followed by % of reinforcement (18.28 %), molten temperature (16.56 %) and stirring time (13.90 %).
Table 3 helps to identify the factors which significantly influence in alternation of wear rate property. If the p must be less than 0.05. such factors influence altering the wear rate property of the composite. Among the influencing factors, rapid tuning (if the F-value is high) and fine-tuning (if the F-value is low) can be done depending on the F-value. For the microhardness observations, According to the findings of the ANOVA, the stirring speed was recorded as the highly influencing factor that had the greatest impact, accounting for 35.34 % of the total, followed by the % of reinforcement (15.20 %), molten temperature (13.21 %), and stirring time (12.81 %). The F-value was utilised in order to analyse on percentage of contribution of every factor (parameter); a higher F-value indicates a greater contribution from the parameter. The inputs for the optimization process minimum and maximum microhardness observed as per Taguchi’s experimental design of L16 were 73.81HV and 180.23 HV respectively. The inputs of minimum and maximum Wear rates are 0.086 mm3/m and 0.086 mm3/m (Refer to Table 1). The optimized parameters for minimized wear rate 0.057475 mm3/m at the parameters settings of 3 wt% reinforcement quantity addition, speed of the Stirrer of 450 rpm, Stirring period of 15 min and temperature of Molten metal of 900 °C.
Fig. 3 is the optimal output obtained in the Taguchi analysis based on the regression equations (1) and equation (2). The optimization plot is presented in Fig. 3(a). Based on this plot, the 0.0575 mm3/m was recorded as a minimum wear rate. This was accomplished by using 3 wt% reinforcement, 450 rpm of stirring speed, 15 min of stirring time, and 900 °C of molten temperature. the maximum microhardness value, which was 213.52 HV. Maximum value of microhardness obtained by optimising parameters such as reinforcement percentage (12 wt%), stirring speed (600 rpm), stirring time (30 min), and molten temperature (750 °C).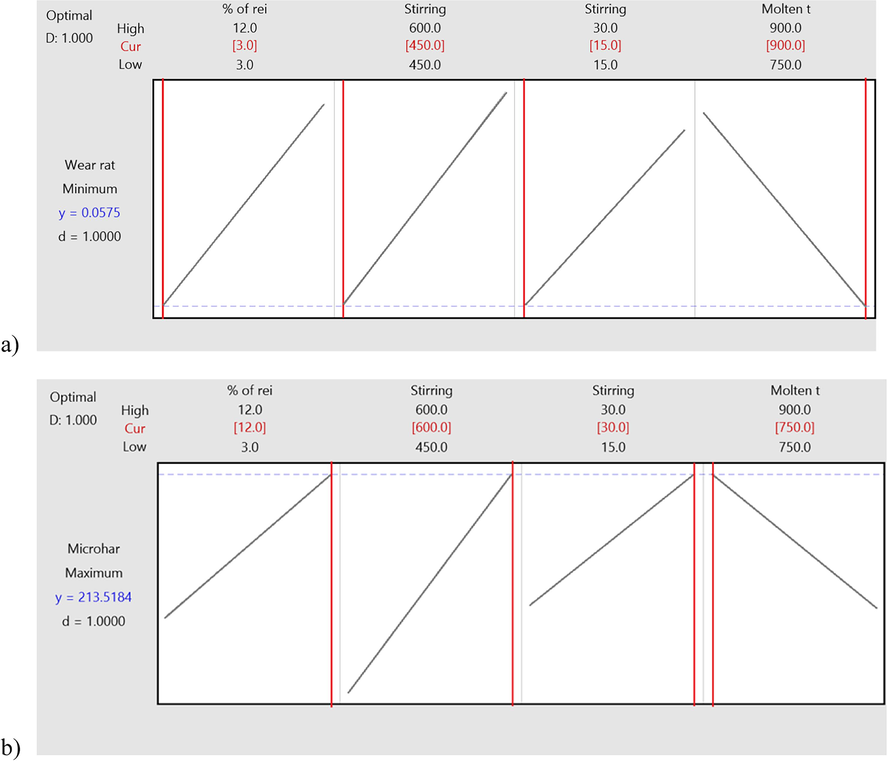
Optimization plot for a) wear rate b) microhardness.
Fig. 3 (b) depicts the optimization plot, and from this plot, we were able to determine the maximum microhardness value, which was 213.52 HV. Maximum value of microhardness obtained by optimising parameters such as reinforcement percentage (12 wt%), stirring speed (600 rpm), stirring time (30 min), and molten temperature (750 0C).
The minimal wear rate estimation parallel plot is shown in Fig. 4. The relationship between the percentage of reinforcement and the stirring speed is seen in Fig. 4(a). The correlation suggests that a combination of 9 % reinforcement and 500 rpm stirring speed yields the lowest wear rate. As can be seen in Fig. 4(b), the optimal combination of stirring speed (500 rpm) and stirring time (30 min) yielded the lowest wear rate. Fig. 4(c) illustrates the relationships between stirring time and molten temperature by showing that the lowest wear rate occurred at 30 min of stirring time and an 850 °C molten temperature. Using a stirring temperature of 850 °C and the reinforcement percentage of 12 wt%, Fig. 4(d) depicts the relationship between the molten metal temperature and the percentage of reinforcement.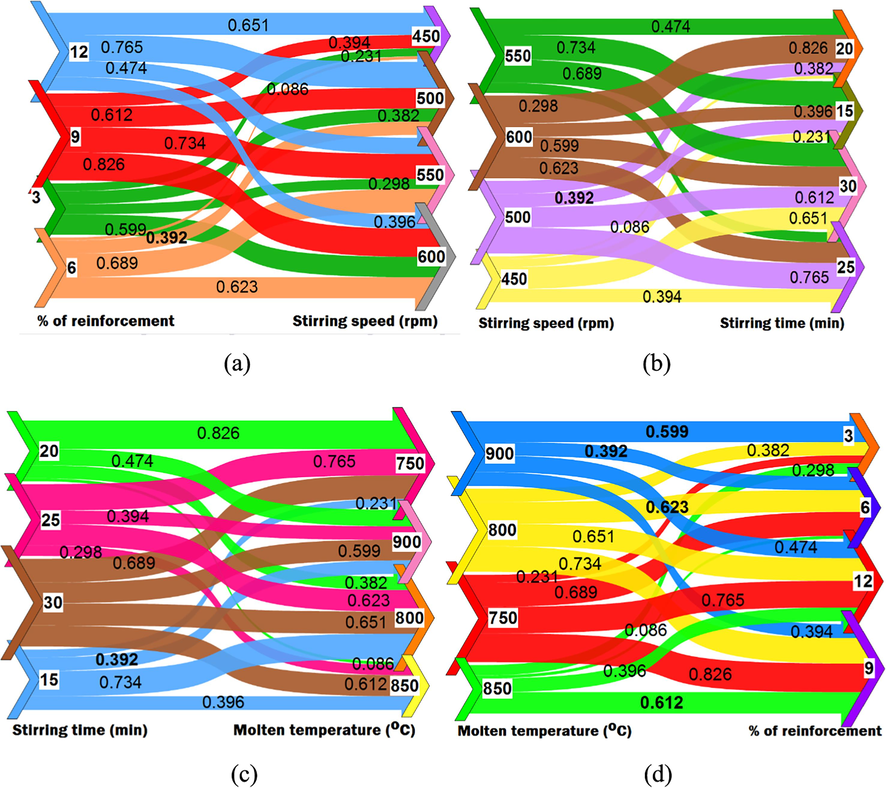
Correlation between factors (a) A and B (b) C and D (c) B and D (d) A & D for altering the wear rate.
Optimal conditions were identified from the experimented results (Table 2) based on the highest signal-to noise ratio (experimental run 5 in Table 1) is 6 % (high S/N ratio is 9.198) of reinforcement, 450 rpm (high S/N ratio is 11.464) of stirring speed, 20 min of stirring of time (high S/N ratio is 9.453), and 850 °C of molten temperature (high S/N ratio is 11.034) and achieved was 0.086 mm3/m (Table 1).
Fig. 3 furnishes the statistical optimization. The results of unexperimented trials within the research domain. The optimal conditions were further tuned to 3 % reinforcement, 450 rpm of stirring speed, 15 min of stirring time, and 900 °C of molten temperature to achieve further minimum wear of 0.0575 mm3/m. As the model R2 value 96.88 % (>95 %) the predicted results are in good agreement with the experimented results and no need to conduct the confirmation run. Hence the recommended optimal conditions to obtain minimum wear is: 3 wt% reinforcement, 450 rpm of stirring speed, 15 min of stirring time, and 900 °C of molten temperature.
The correlation between the two factors yielded the highest hardness values shown in Fig. 5 as a heat map plot. Based on the relationship depicted in Fig. 5 (a), the optimal combination of reinforcement percentage and the stirring speed was 12 % reinforcement with 500 rpm. Maximum microhardness was achieved at 500 rpm for 25 min of stirring (Fig. 5(b)), demonstrating the correlations between these two variables. Fig. 5(c) depicts the connections between stirring duration and molten temperature, revealing that 20 min of churning at 850 °C resulted in the highest microhardness. Using a stirring temperature of 750 °C and a reinforcement concentration of 12 wt%, Fig. 5(d) depicts the relationship between the molten metal temperature and the percentage of reinforcement.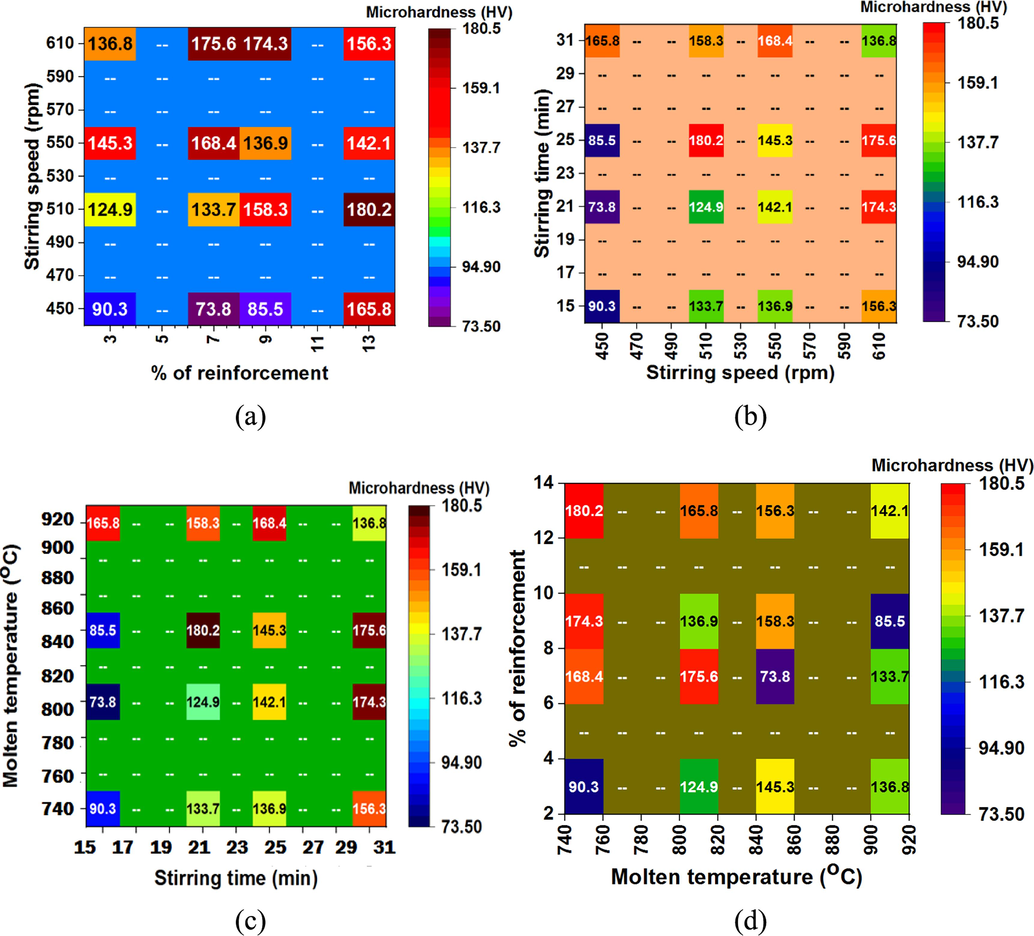
Heat map plots:- Correlation between the Factors (a) A and B (b) C and D (c) B and D (d) A & D. for altering the microhardness.
Wear testing at a molten temperature of 850 °C for 20 min with a stirring speed of 450 rpm and a reinforcement density of 6 wt% yielded a minimal wear rate of 0.086 mm3/m (Table 1). Fig. 2 (b) shows the results of using 12 wt% reinforcement, 500 rpm of stirring speed, 25 min of stirring time, and 750 °C of molten temperature to obtain microhardness increases equal to 180.2 HV (Table 1). Based on the results of the experiments, the optimal casting conditions are as follows: 6 wt% reinforcement, 450 rpm stirring speed, 20 min of stirring time, and 850 °C molten temperature. For the microhardness test, the optimal stirring conditions were 12 wt% reinforcement, 600 rpm stirring speed, 30 min of stirring duration, and 800 °C molten temperatures. The wear rate was influenced by a combination of factors, including the minimum stirring speed (contribution 20.54 % for microhardness), reinforcing (6 wt%), molten temperature (450 °C), and stirring time (20 min). Microhardness was determined by a combination of several variables, the largest of which was stirring speed (contribution 35.34 % for microhardness), followed by reinforcing, molten temperature, and stirring time. At 3 wt% reinforcement, 450 rpm stirring speed, 15 min of stirring time, and 900 °C molten temperature, the optimized wear rate was found to be 0.057 mm3/m (Fig. 5). With 12 wt% reinforcement, 600 rpm stir speed, 30 min of stir duration, and 750 °C molten temperature, the microhardness was raised to 213.52 HV (Fig. 3b).
5 Conclusion
Experimental confirmation that reinforcing AA8026 with varied percentages of Zirconium Oxide and Titanium dioxide and changing fabrication process parameters may affect its wear and micro-hardness was accomplished. Based on experimental data, Taguchi analysis optimized pouring temperature (molten temperature), stirring time, and other casting process parameters. These findings suggest the following.
With 6 wt% reinforcement, 450 rpm stirring speed, 20 min stirring time, and 850 oC molten temperature, the wear rate was 0.086 mm3/m. Similar microhardness improvements of 180.2HV were achieved with 12 wt% reinforcement, 500 rpm stirring speed, 25 min stirring duration, and 750 °C molten temperature. The investigations demonstrate that 6 wt% reinforcement, 450 rpm stirring speed, 20 min stirring duration, and 850 °C molten temperature offer the optimum casting outcomes. Microhardness tests found that 12 wt% reinforcement, 600 rpm stirring speed, 30 min stirring duration, and 800 °C molten temperatures work well. After reinforcing, molten temperature, and stirring time, stirring speed caused 20.54 % of wear. Microhardness tests indicated that stirring speed (35.34 %) was most important, followed by reinforcement, molten temperature, and stirring duration. Optimization yielded a wear rate of 0.057 mm3/m at 3 wt% reinforcement, 450 rpm stirring speed, 15 min stirring time, and 900oC molten temperature. Microhardness increased to 213.52 HV with 12 wt% reinforcement, 600 rpm stir speed, 30 min stir, and 750 oC molten temperature.
The findings show that altering synthesis parameters may increase wear variability from 0.057 mm3/m to 0.826 mm3/m (1349 %) and surface microhardness from 73.8 HV to 213.52 HV (189 %). So surface quality may be modified within this range for many purposes.
CRediT authorship contribution statement
Ravi Kumar Saidala: Writing – original draft, Conceptualization. Archana T: Writing – original draft, Conceptualization. Alias Paul: Writing – review & editing, Investigation. Naresh Kumar Reddy: Writing – review & editing, Investigation. T. Sathish: Writing – review & editing, Supervision. Abdullah A. Al-Kahtani: Writing – review & editing, Funding acquisition. Chander Prakash: Writing – review & editing. Mohd Shahazad: Writing – review & editing, Data curation. Satbir S. Sehgal: Writing – review & editing. Mohammad Yusuf: Writing – review & editing, Validation, Formal analysis.
Acknowledgement
The authors extend their sincere appreciation to the Researchers Supporting Project number (RSP2024R266), King Saud University, Riyadh, Saudi Arabia for the support.
Declaration of Competing Interest
The authors declare that they have no known competing financial interests or personal relationships that could have appeared to influence the work reported in this paper.
References
- Characterization & evaluation of Al7075 MMCs reinforced with ceramic particulates and influence of age hardening on their tensile behavior. J. Mech. Sci. Techno.. 2018;32(7):3123-3128.
- [Google Scholar]
- Conventional and additive manufacturing with metal matrix composites: a perspective. Procedia Manuf.. 2019;30:159-166.
- [Google Scholar]
- Comparative study of microstructure, physical and mechanical characterization of SiC/TiB2 reinforced Aluminium matrix composite. Silicon. 2021;13(6):2003-2010.
- [Google Scholar]
- Topological design for isotropic metamaterials using anisotropic material microstructures. Eng. Anal. Bound. Elem.. 2024;162:28-44.
- [Google Scholar]
- Bose S, Nandi T. Selection of Aluminum Hybrid Metal Matrix Composite Material Using Additive Ratio Assessment Approach and Comparing with the Experimental Results Varying Different Weight Percentage of the Reinforcements. In Advances in Unconventional Machining and Composites, 2020 (pp. 687-695). Springer, Singapore.
- Mechanical and tribological behaviour of nano scaled silicon carbide reinforced aluminium composites. J. Exp. Nanosci.. 2018;13(sup1):S1-S13.
- [Google Scholar]
- Synthesis and characterization of ZA-27 alloy matrix composites reinforced with zinc oxide nanoparticles. Eng. Sci. Technol. an Int.. 2017;20(3):1147-1154.
- [Google Scholar]
- Multifunctional TiO2/C nanosheets derived from 3D metal–organic frameworks for mild-temperature-photothermal-sonodynamic-chemodynamic therapy under photoacoustic image guidance. J. Colloid Interface Sci.. 2022;621:360-373.
- [Google Scholar]
- Study on the atomic removal behavior and damage formation mechanism of nano cutting copper-nickel alloy with diamond tool. Model. Simul. Mater. Sci. Eng.. 2024;32
- [Google Scholar]
- Experimental investigation on mechanical properties of an Al6061 hybrid metal matrix composite. J, Compos. Sci.. 2018;2(3):49
- [Google Scholar]
- Conventional stir casting versus ultrasonic assisted stir casting process: Mechanical and physical characteristics of AMCs. J. Alloys Compd.. 2019;805:502-508.
- [Google Scholar]
- Aluminum silicon carbide particulate metal matrix composite development via stir casting processing. Silicon. 2018;10(2):343-347.
- [Google Scholar]
- Stir casting technology for magnesium-based metal matrix composites for bio-implants-a review. Materials Today. Proceedings. 2022 May 20
- [Google Scholar]
- Hybrid combination of Taguchi-GRA-PCA for optimization of wear behavior in AA6063/SiCp matrix composite. Prod. Manuf. Res.. 2018;6(1):171-189.
- [Google Scholar]
- A review on mechanical and tribological properties of graphite reinforced self lubricating hybrid metal matrix composites. Rev. Adv. Mater. Sci.. 2018;56(1):1-20.
- [Google Scholar]
- Effect of stir casting parameters and mono/hybrid reinforcements on aluminium metal matrix composite–a review. Proc. Inst. Mech. Eng. C: J. Mech. Eng. Sci.. 2022;236(9):4904-4920.
- [Google Scholar]
- Application of the thermodynamic extremal principle to diffusion-controlled phase transformations in Fe-C-X alloys: Modeling and applications. Acta Mater. 2018;159:16-30.
- [Google Scholar]
- Synthesis and characterization of zinc oxide reinforced aluminum metal matrix composite produced by microwave sintering. J. Compos. Mater.. 2020;54(24):3625-3636.
- [Google Scholar]
- Kumar J, Kumar V, Sharma S, Chohan J, Kumar R, Singh S, Obaid AJ, Akram SV. Optimizations of reinforcing particulates and processing parameters for stir casting of aluminium metal matrix composites for sustainable properties. Materials Today: Proceedings. 2022 Nov 4.
- Micro structural characteristics and mechanical behaviour of aluminium matrix composites reinforced with titanium carbide. J. Alloys Compd.. 2017;723:795-801.
- [Google Scholar]
- Role of SiC on mechanical, tribological and thermal expansion characteristics of B4C/Talc-reinforced Al-6061 hybrid composite. Silicon. 2020;12(6):1491-1500.
- [Google Scholar]
- Effect of varying TiB2 reinforcement and its ageing behaviour on tensile and hardness properties of in-situ Al-4.5% Cu-xTiB2 composite. J. Alloys Compd.. 2019;793:454-466.
- [Google Scholar]
- Challenges, opportunities and analysis of the machining characteristics in hybrid aluminium composites (Al6061-SiC-Al2O3) produced by stir casting method. Int. Res. J. Adv. Science Hub. 2022
- [Google Scholar]
- Microstructural characterization and mechanical properties of TiB2 reinforced Al6061 matrix composites produced using stir casting process. Mater. Sci. Eng.: A. 2018;710:172-180.
- [Google Scholar]
- Qasim M. Shakir, Sarah D. Abdlsaheb, Rehabilitation of partially damaged high strength RC corbels by EB FRP composites and NSM steel bars, Structures, Volume 38, 2022, Pages 652-671. https://doi.org/10.1016/j.istruc.2022.02.023.
- Effect of grain modifier on mechanical and tribological properties of Al-Si alloy and composite. Silicon. 2021;13(3):841-855.
- [Google Scholar]
- Effect of Heat Treatment on Wear behavior of Hybrid Aluminum Metal Matrix Composites. Tribol. Ind.. 2019;41(3)
- [Google Scholar]
- Fabrication of hybrid metal matrix composites (HMMCs)–A review of comprehensive research studies. Materials Today. Proceedings. 2022
- [Google Scholar]
- Effects of reinforcement additions on properties of aluminium matrix composites-A review. Materials Today: Proceedings. 2021;44:637-641.
- [Google Scholar]
- An experimental investigation on mechanical and wear properties of Al7075/SiCp composites: effect of SiC content and particle size. J. Tribol.. 2018;140(3)
- [Google Scholar]
- Investigation of mechanical properties of aluminium 6061-silicon carbide, boron carbide metal matrix composite. Silicon. 2018;10(2):495-502.
- [Google Scholar]
- Experimental investigation and analysis of properties and dry sliding wear behavior of Al-Fe-Si alloy matrix composites. Silicon. 2021;13(4):1285-1294.
- [Google Scholar]
- Processing and characterization of AA2024/Al2O3/SiC reinforces hybrid composites using squeeze casting technique. Iran. J. Mater. Sci. Eng.. 2019;16(2):55-67.
- [Google Scholar]
- Evaluation of fracture mechanisms in Al-Si metal matrix nanocomposites produced by three methods of gravity sand casting, squeeze casting and compo casting in semi-solid state. Silicon. 2020;12(12):2977-2987.
- [Google Scholar]
- Strengthening the self-compacting reinforced concrete dapped ends with near surface mounted (NSM) steel bar technique. Int. J. Adv. Sci. Eng. Inf. Technol. 2021;11(2):663-673.
- [Google Scholar]
- High strength self-compacting corbels retrofitted by near surface mounted steel bars. Pollack Periodica. 2023;18(1):106-112.
- [CrossRef] [Google Scholar]
- Shakir, QASIM M., and SARAH D. Abdlsaheb. “Strengthening of the self-compacted reinforced concrete corbels using NSM steel bars and CFRP sheets techniques.” J. Eng. Sci. Technol 17, no. 3 (2022): 1764-1780.
- Effect of SiC on mechanical properties of al-based metal matrix composites produced by stir casting. Metal Sci. Heat Treatm.. 2022;64(5):316-320.
- [Google Scholar]
- Synthesis of AA2024-+ TiO2np) hybrid nanocomposite via stir casting process. Mater. Sci. Eng.: A. 2019;756:484-491.
- [Google Scholar]
- Srivyas PD, Charoo MS. Aluminum metal matrix composites a review of reinforcement; mechanical and tribological behavior. Int. J. Eng. Technol. 208;7(2.4):117-22.


