

Translate this page into:
Sulphur coated urea improves morphological and yield characteristics of transplanted rice (Oryza sativa L.) through enhanced nitrogen uptake
⁎Corresponding author. rao.ikram@mnsuam.edu.pk (Rao Muhammad Ikram)
-
Received: ,
Accepted: ,
This article was originally published by Elsevier and was migrated to Scientific Scholar after the change of Publisher.
Peer review under responsibility of King Saud University.
Abstract
Imbalanced and non-judicious use of nitrogen in agriculture is one of the major factors responsible for ecological disturbance and threat to biodiversity. Among cultivated crops, nitrogen losses in rice are the highest that resulted in low nitrogen use efficiency. Urea coating with sulphur can deaccelerate nitrogen release and contribute to higher availability for plants. An experiment was conducted during two consecutive years 2016 and 2017 for the assessment of sulphur coating on urea in transplanted rice under varied nitrogen levels. There were two levels of urea source, U1 = granular urea (UG) and U2 = sulphur coated urea (USC) and three levels of nitrogen rate were kept as, N1 = 100% of the recommended nitrogen (160 kg ha−1), N2 = 75% of the recommended nitrogen (120 kg ha−1) and N3 = 50% of the recommended nitrogen (80 kg ha−1). Results indicated that in both years highest kernel yield was recorded in USC as compared to UG. Almost all morphological traits were influenced by nitrogen levels and urea sources. Chlorophyll a and b were also significantly higher in USC at 90 and 120 DAT (days after transplanting). Nitrogen contents in leaf and panicle were also increased when nitrogen was applied in form of USC. Leaf nitrogen contents were almost same at 90 and 120 DAT while panicle nitrogen contents increased significantly at 120 DAT under USC. It is concluded that urea coating with sulphur is more efficient than application of granular urea. To obtain higher yield in puddled rice, it is recommended that nitrogen must be applied at the rate of 160 kg ha−1 through coating of sulphur.
Keywords
Nitrogen losses
Nutrient pollution
Slow releasing fertilizer
Micronutrients
Puddled rice

1 Introduction
Nitrogen application for agricultural purpose is one of the major activities that are responsible for disturbance of natural ecosystem and environmental problems at global level. Reactive nitrogen (Nr), that is lost from the agricultural fields, is the basis of various environmental and ecological disturbances. It is one of the major threats to biodiversity (Payne et al., 2017). It is evident from the last five decades that usage of nitrogen in agriculture has been rise at exponential rate (Lu and Tian, 2017). This terrific upsurge of nitrogen use is associated with increased nitrogen losses and reduced nitrogen use efficiency (NUE) that is only 20–35% in developing countries where major production of urea is consumed every year, main portion of the applied nitrogen 65–80% is lost to the environment (Naz and Sulaiman, 2016). Overdose of nitrogenous fertilizers is one of the foremost aspects that are responsible for N-losses (Ke et al., 2018; Raza et al., 2018).
Rice (Oryza sativa L.) is considered as one of the most important staple cereals, around half population of world is dependent upon rice for their daily food intake and calories. It is a source of persistence for the poorest people of the world, near about 750 million relays on it for their survival. Nitrogen is major nutrient that influence growth and development in rice production systems (Khan et al., 2012). Almost all forms of nitrogen are highly mobile in soil, unavailability of nitrogen at post-anthesis stage in rice results in reduced vegetative growth ultimately decreased translocation of assimilates from source to sinks (Ke et al., 2018).
Among cultivated crops, nitrogen losses in rice are highest followed by wheat and maize (Liu et al., 2016). The amount of nitrogen application is directly associated with nitrate (NO3) concentration in water runoff (Woodley et al., 2018). It is reported that nitrogen losses in the form of run-off are more prominent in aerobic (direct seeded) rice (Zhang et al., 2018a; He et al., 2017). Volatilized nitrogen in the form of methane (CH4) and ammonia (NH3) from anaerobic (puddled) rice is the source of greenhouse gases (Sutton et al., 2011; Mekonnen and Hoekstra, 2015) and acid rain (Cameron et al., 2013). The misplaced nitrogen through leaching takes part in contamination of ground water (Su et al., 2018; Zhang et al., 2018b), water bodies, fresh lakes (Paerl et al., 2011), eutrophication and biodiversity disturbance (Robertson and Vitousek, 2009).
Controlled release urea (CRU) reduces nitrogen losses and improves NUE in paddy field thus contribute to yield enhancement (Li et al., 2018). Use of coated urea decreases nitrogen volatilization and runoff consequently improves rice yield and nitrogen recovery (Wang et al., 2016; Li et al., 2018). It is also predicted by growth models that controlled release of nitrogen in rice field can contribute to yield enhancement and reduces environmental contamination of nitrogen (Dubey and Mailapalli, 2018). Urea coating with micronutrients is associated with increased nitrogen use efficiency in cereals like maize (Affendi et al., 2018). Deficiencies of micronutrients in cereals can be mitigated by their coating on fertilizer. This method is not only beneficial for the micronutrient application but also increases nitrogen use efficiency when coated on urea (Pooniya et al., 2018; Affendi et al., 2018). Use of sulphur coating on urea can help in slow release of nitrogen and contribute to improved nitrogen uses efficiency. Sulphur coated urea reduces nitrogen leaching in flooded rice and wheat (Ke et al., 2018; Shivay et al., 2016; Khan et al., 2015). Sulphur coated urea is better than other polymer coated urea because later is associated with delayed growth and reduction in dry matter accumulation in direct seeded rice (Rose, 2016).
To avoid N-losses in puddled rice, controlled release of nitrogenous fertilizers can serve the purpose. The coating of urea with compatible compounds can be beneficial not only slow distributing of nitrogen but also enhancement of NUE in rice. Keeping these objectives in mind, two-year field research was designed to understand the efficacy of manually coated urea in puddled rice.
2 Materials and methods
2.1 Description of site
To investigate the interactive effect of granular and sulphur coated urea along with nitrogen levels for transplanted rice, a research trial was conducted at experimental farm of Department of Agronomy, Bahauddin Zakariya University Multan Pakistan during consecutive years, 2016 and 2017. The site where experiment was conducted is located at 71.5° N longitude, 30.2° E latitude and at 121 masl elevation. It is classified as arid zone by Köppen’s classification (hot desert climate) (Fig. 1). This site receives very low annual precipitation i.e., less than 150 mm per year, hence agriculture is totally dependent upon irrigation water. Before conducting trial, four soil samples were taken from the field at the depths of 0–15 and 16–30 cm each year. The soil samples were subjected to analysis for selected physical and chemical properties (Table 1).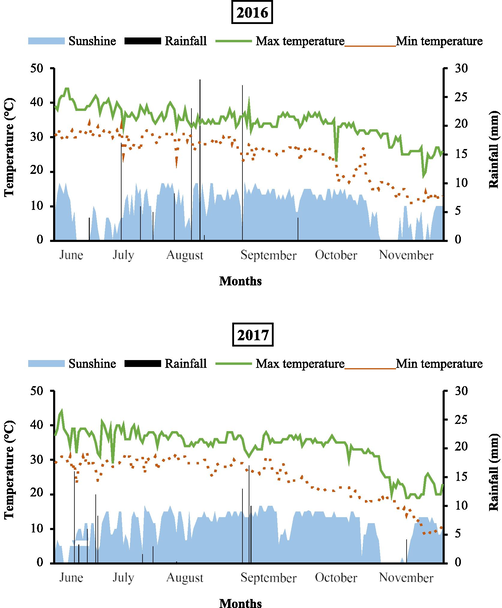
Weather data exhibiting minimum and maximum temperature (°C), rainfall (mm) and sunshine (hour) during experimental period.
Soil characteristics
Unit
2016
2017
0–15 cm
16–30 cm
0–15 cm
16–30 cm
Physical properties
Sand
%
26
24
29
27
Silt
%
51
57
50
56
Clay
%
23
19
21
17
Textural class
–
Silt loam
Silt loam
Silt loam
Silt loam
Chemical properties
Soil EC (ECe)
dSm−1
3.17
3.23
2.98
3.11
Soil pH (pHe)
1:1
8.4
8.6
8.3
8.4
Organic matter
%
0.59
0.43
0.57
0.46
Nitrogen (NO3-N)
mg kg−1
4.21
3.98
3.45
3.13
Phosphorus (NaHCO3-P)
mg kg−1
6
4
5
4
Potassium (NH4OAc-K)
mg kg−1
159
146
176
161
2.2 Experimental details
Seeds of rice (Oryza sativa L.) cv. Super Basmati were taken from Rice Research Institute (RRI), Kala Shah Kaku Sheikhupura Pakistan. In both years, randomized complete block design (RCBD) with split-plot arrangement was used. There were two levels of urea sources, U1 = granular urea (UG) and U2 = sulphur coated urea (USC) and three levels of nitrogen rates were kept as, N1 = 100% recommended nitrogen (160 kg ha−1), N2 = 75% recommended nitrogen (120 kg ha−1) and N3 = 50% recommended nitrogen (80 kg ha−1). Urea sources and nitrogen rates were kept as main-plot and sub-plot factors, respectively.
2.3 Urea coating
Sulphur coated urea (Usc) was prepared by manual method using rotating drum (Shivay, et al., 2015). Granular urea having measured amount 38 kg was taken in rotating drum. To adhere sulphur coating on urea, acacia gum was used (also known as gum Arabic). It considered as natural polymer and can be used for agricultural purposes (Patel and Goyal, 2015). Keeping the rate of 2 g acacia gum for 1 kg urea, 76 mL of acacia solution as prepared and sprinkled on urea in drum as suggested by Shivay et al. 2016 previously. Drum was rotated for 10 min then 2 kg sulphur powder (99%) was added into drum and again drum was rotated for further 15 min. Urea was taken out of drum and spread out on plastic sheet under shade for 10 min and stored. This coated urea was consisted of 5% (w/w) sulphur.
2.4 Nursery raising
Nursery was raised keeping recommended seed rate of 18 kg ha−1. On both years nursery was sown on 6th June 2016 and 5th June 2017. Seeds were soaked for 24 h in water than kept for 48 h in gunny sacks. After each of 6 h water was sprinkled on gunny sacks and seed was rotated to accelerate imbibition and germination. Nursery bed was prepared by making two cultivations followed by planking. Animal manure was also added and mixed with rotavator in nursery bed. Nursery field was irrigated and standing water was kept for 3 days. Afterwards nursery field was divided into plots of size 272.25 sq. ft (1 marla), in each marla, 500-gram seed was broadcasted. Fertilizer for nursery was applied at the rate of 100–60 kg ha- 1 (N-P), for each Marla, 250-gram N and 150-gram P was broadcasted using urea and triple super phosphate as fertilizer material.
2.5 Nursery transplantation
Nursery was transplanted with seedling age of 30 days. On both years nursery was transplanted on 5th July 2016 and 4th July 2017. Two seedlings were transplanted per hill keeping the distance of hill × hill = 22.5 cm (9 in.).
2.6 Puddled field preparation
Animal manure was added and rotavator was drawn. Afterwards field was flooded, and cultivator was drawn three times in standing water followed by planking. Rotavator was also used in standing water. Field was divided into plots, the net plot size was 7 m × 3.4 m. Nitrogen was applied in three splits according to treatments using urea (46% N) while Phosphorus @ 85 kg ha−1 and Potassium @ 60 kg ha−1 were applied before transplanting using the sources of TSP (46% P) and SOP (50% K), respectively. For weed control in puddled field, Butachlor (60 EC) @ 800 mL acre-1 was applied.
3 Harvesting and measurements
3.1 Morphological traits
Crop was harvested on 6th November 2016 and 9th November 2017. At harvest maturity, data for morphological and yield related parameters like plant height (cm), total tillers (m−2), productive tillers (m−2), panicle length (cm), number of kernels panicle-1, 1000-kernel weight (g), biological yield (kg ha−1), kernel yield (kg ha−1) and harvest index (%) were recorded.
3.2 Chlorophyll a, b and nitrogen determination
Samples of leaves and panicles were taken at 90 and 120 DAT (days after transplanting) for determination of chlorophyll a, b and nitrogen contents in leaf and panicle.
Chlorophyll a and b were quantified by acetone extraction method (Arnon, 1949). Fresh samples of leaves were taken from the field, immediately transferred to ice bucket for the transportation towards lab. Leaves sample of weight 0.2 g was taken, cut into tiny pieces, and extracted overnight in 80% acetone at 4 °C then it was centrifuged for 10 min at 8000 rpm. Readings were taken in spectrophotometer at 645 nm and 663 nm. Values were calculated by formula explained by Nagata and Yamashita (1992).
Nitrogen contents in leaves and panicle were determined by H2SO4 digestion and distillation (Chapman and Parker, 1961). Samples (leaf and panicle) were oven dried, 0.5 g sample was taken in Kjeldahl digestion flask and 5 g digestion mixture K2SO4:Cu2SO4:FeSO4 (10:0.5:1) was added, afterwards 10 mL concentrated H2SO4 (98%) was poured into flask. After an hour, digestion flask was placed on digester chamber. Temperature was raised slowly to 320 °C. When liquid attained transparent green colour, digestion was stopped, and sample was transferred to 100 mL volumetric flask and volume was made with deionized water. From this, 5 mL was taken, and distillation was performed against 40% NaOH using methyl red and bromocresol green (0.3%) as indicator. The quantity of acid utilized in titration was measured and readings were taken for quantification of nitrogen.
3.3 Statistical analysis
Recorded data were analysed statistically using two factors RCBD split-plot design through analytical software Statistix® 8.1 by ANOVA (analysis of variance) and LSD test at 5% probability (Steel et al., 1996). Year was not considered as factor variable. Standard error calculation and graphs making were done by MS-Excel® 2013.
4 Results and discussion
4.1 Morphological and yield characteristics
Results indicated that morphological and yield parameters were significantly influenced by source of urea and nitrogen levels. Data related to plant height was statistically significant during both years. Maximum plant height was recorded in N1 using USC as fertilizer material (121 cm) during both years (Table 2). Plant height at N2 through USC was far better than UG at N1. Minimum plant height was measured at N3 in UG and USC with least value observed in 2017 at same nitrogen rate in UG (83 cm). Means ± SE sharing unalike letters for main effects and interaction during each year differs significantly at p ≤ 0.05 (** = significant at p ≤ 0.01; *= significant at p ≤ 0.05; ns = non-significant; SE = standard error)
Nitrogen levels
2016
2017
UG
USC
Mean (N)
UG
USC
Mean (N)
Plant height (cm)
100 % recommended N (160 kg ha−1)
111.9 ± 0.93 bc
121.3 ± 0.92 a
116.6 A
106.1 ± 0.76c
121.2 ± 1.39 a
113.6 A
75 % recommended N (120 kg ha−1)
100.8 ± 0.80 d
115.2 ± 1.58b
108.3B
100.6 ± 1.30 d
116.4 ± 0.52b
108.5B
50 % recommended N (80 kg ha−1)
87.7 ± 1.23 e
111.1 ± 1.19c
99.4C
83.1 ± 1.18 e
108.3 ± 1.18c
95.7C
Mean (Urea)
100.1B
115.8 A
96.5B
115.3 A
LSD value (p ≤ 0.05)
U = 4.76 **
N = 2.61 **
U × N = 3.70 **
U = 3.29 **
N = 2.64 **
U × N = 3.73 **
Total tillers (m−2)
100 % recommended N (160 kg ha−1)
399.1 ± 7.76
435.2 ± 2.30
417.2 A
412.6 ± 5.78b
427.6 ± 2.40 a
420.1 A
75 % recommended N (120 kg ha−1)
389.2 ± 8.71
419.6 ± 1.76
404.3B
398.3 ± 1.76c
418.1 ± 1.73 ab
408.1B
50 % recommended N (80 kg ha−1)
369.6 ± 3.93
398.3 ± 2.02
384.8C
367.6 ± 5.36 d
400.3 ± 2.90c
384.7C
Mean (Urea)
385.8B
417.6 A
392.8B
415.3 A
LSD value (p ≤ 0.05)
U = 21.05 *
N = 7.87 **
U × N = ns
U = 8.61 **
N = 7.52 **
U × N = 10.64 *
Productive tillers (m−2)
100 % recommended N (160 kg ha−1)
339.1 ± 5.03c
378.3 ± 2.02 a
358.6 A
335.6 ± 3.48
368.3 ± 2.02
352.1 A
75 % recommended N (120 kg ha−1)
314.3 ± 2.33 e
361.4 ± 2.02b
337.8B
309.1 ± 1.52
344.6 ± 2.02
326.8B
50 % recommended N (80 kg ha−1)
294.3 ± 2.90f
325.3 ± 1.45 d
309.8C
301.6 ± 2.02
326.3 ± 3.84
314.1C
Mean (Urea)
315.8B
355.3 A
315.4B
346.4 A
LSD value (p ≤ 0.05)
U = 6.32 **
N = 6.03 **
U × N = 8.53 *
U = 8.76 **
N = 6.62 **
U × N = ns
Total tillers (m−2) varied significantly in 2016 and 2017 among U (urea sources) and N (nitrogen rates), their interaction was also statistically significant during 2017 (Table 2). Maximum total tillers (m−2) were recorded in 2016 (435) at N1 using USC as fertilizer material, same case was recorded in 2017. Least total tillers were observed in N3 through UG in both years 369 and 367. Among nitrogen dose, N1 gave maximum total tillers while least were recorded in N3. During both years, USC was statistically better than UG.
Productive tillers (m−2) considered as one of the main yield determining parameters, more productive tiller m−2 contribute to kernel yield increment. U and N was significant during both years. Among nitrogen levels, maximum productive tillers were recorded in N1, while USC performed better than UG (Table 2). Lowest productive tillers were recorded in UG 294 and 301 in 2016 and 2017, respectively. Highest productive tillers were observed in USC at the dose of N1 378 and 368 during 2016 and 2017 accordingly, whereas N2 applied in the form of USC gave better productive tillers than N1 dose of UG.
For panicle length (cm), interaction of U (urea sources) and N (nitrogen rates) were non-significant both years. Panicle length was more influenced by dose of nitrogen rather than source of fertilizer used for nitrogen nutrient provision. During 2017, U was also non-significant while in 2016, it was also slightly affected panicle length (Table 3). Nitrogen rates significantly influenced length of panicle each year. Maximum panicle length was recorded in USC at N1 (24 cm), at the same rate of nitrogen, UG also gave almost identical value. Means ± SE sharing unalike letters for main effects and interaction during each year differs significantly at p ≤ 0.05 (** = significant at p ≤ 0.01; *= significant at p ≤ 0.05; ns = non-significant; SE = standard error)
2016
2017
Nitrogen levels
UG
USC
Mean (N)
UG
USC
Mean (N)
Panicle length (cm)
100 % recommended N (160 kg ha−1)
21.9 ± 0.28
23.4 ± 0.49
22.7 A
23.7 ± 0.40
24.1 ± 0.17
23.9 A
75 % recommended N (120 kg ha−1)
20.3 ± 0.31
22.1 ± 0.20
21.2B
21.5 ± 0.40
23.3 ± 0.27
22.4B
50 % recommended N (80 kg ha−1)
19.7 ± 0.20
20.8 ± 0.40
20.2B
19.9 ± 0.39
21.1 ± 0.25
20.5C
Mean (Urea)
20.6B
22.1 A
21.7
22.8
LSD value (p ≤ 0.05)
U = 0.47 **
N = 0.92 **
U × N = ns
U = ns
N = 0.80 **
U × N = ns
No. of kernels panicle-1
100 % recommended N (160 kg ha−1)
95.1 ± 1.73b
102.3 ± 1.76 a
98.6 A
8.6 ± 2.33 a
102.3 ± 2.02 a
100.5 A
75 % recommended N (120 kg ha−1)
85.3 ± 2.02c
102.1 ± 1.15 a
93.6B
83.1 ± 2.08c
91.3 ± 0.57b
87.1B
50 % recommended N (80 kg ha−1)
71.0 ± 1.15 d
93.3 ± 0.88b
82.1C
73.3 ± 1.15 d
82.6 ± 1.20c
77.8C
Mean (Urea)
83.7B
99.2 A
84.8B
92.1 A
LSD value (p ≤ 0.05)
U = 3.73 **
N = 2.04 **
U × N = 2.89 **
U = 1.26 **
N = 4.30 **
U × N = 6.09 *
1000-kernel weight (g)
100 % recommended N (160 kg ha−1)
18.1 ± 0.33 cd
19.8 ± 0.26 a
18.9 A
18.13 ± 0.42
22.6 ± 3.60
20.3 A
75 % recommended N (120 kg ha−1)
17.7 ± 0.26 d
18.7 ± 0.37 bc
18.2B
17.57 ± 0.55
18.9 ± 0.78
18.2 AB
50 % recommended N (80 kg ha−1)
15.9 ± 0.26 e
19.1 ± 0.20 ab
17.4C
15.93 ± 0.39
18.1 ± 0.41
17.1B
Mean (Urea)
17.2B
19.1 A
17.2
19.8
LSD value (p ≤ 0.05)
U = 0.38 **
N = 0.69 **
U × N = 0.98 *
U = ns
N = 3.10 *
U × N = ns
Number of kernels per panicle also yield determining trait, more kernels per panicle contribute to high yield. U, N, and their interaction was significant both years for kernel number per panicle. Maximum kernels per panicle were recorded in N1 during 2017 at USC while in 2016, same value was shared by N2 and N1 (102). Least number of kernels per panicle were recorded in at N3 with UG. Among nitrogen doses, 100% and 75% recommended nitrogen gave almost same value (Table 3).
For 1000-kernel weight (g), interaction of U (urea sources) and N (nitrogen rates) was non-significant. Among N doses, 100% and 75% recommended nitrogen also shared same value for both urea sources that were also non-significant during 2017 (Table 3). Maximum kernel weight was recorded in N1 using USC as fertilizer source (22 g), whereas minimum 1000-kernel weight was observed in N3 at UG.
Nitrogen levels significantly affected biological yield (kg ha−1). During both years, maximum biological yield was recorded in N1. Among sources of urea there was also significant difference, USC resulted in higher biological than UG both years. Maximum biological yield was recorded in 100% and 75% recommended nitrogen during 2016 and 2017 at USC (8478 kg ha−1). Biological yield was significantly higher at N2 in USC than UG even at N1 (Table 4). Means ± SE sharing unalike letters for main effects and interaction during each year differs significantly at p ≤ 0.05 (** = significant at p ≤ 0.01; *= significant at p ≤ 0.05; ns = non-significant; SE = standard error)
2016
2017
Nitrogen levels
UG
USC
Mean (N)
UG
USC
Mean (N)
Biological yield (kg ha−1)
100 % recommended N (160 kg ha−1)
7572.6 ± 152
8478.3 ± 67
8025.5 A
7826.6 ± 244 bc
8447.1 ± 68 a
8136.8 A
75 % recommended N (120 kg ha−1)
7212.6 ± 173
8126.1 ± 86
7669.3B
7337.1 ± 64 d
8323.3 ± 58 ab
7830.1 A
50 % recommended N (80 kg ha−1)
6763.1 ± 94
7430.1 ± 135
7096.5C
6822.6 ± 113 e
7816.6 ± 86 cd
7319.6B
Mean (Urea)
7182.7B
8011.4 A
7328.7B
8195.6 A
LSD value (p ≤ 0.05)
U = 189.21 **
N = 189.10 **
U × N = ns
U = 401.16 **
N = 322.56 **
U × N = 456.1 *
Kernel yield (kg ha−1)
100 % recommended N (160 kg ha−1)
2969.3 ± 78
3646.6 ± 114
3308.1 A
2843.3 ± 38
3575.1 ± 68
3209.1 A
75 % recommended N (120 kg ha−1)
2696.6 ± 30
3360.1 ± 53
3028.3B
2477.6 ± 48
3271.1 ± 51
2874.3B
50 % recommended N (80 kg ha−1)
2196.6 ± 111
2693.1 ± 19
2444.8C
1985.3 ± 19
2771.3 ± 55
2378.3C
Mean (Urea)
2620.8B
3233.2 A
2435.4B
3205.7 A
LSD value (p ≤ 0.05)
U = 324.39 **
N = 164.75 **
U × N = ns
U = 231.12 **
N = 79.49 **
U × N = ns
Harvest index (%)
100 % recommended N (160 kg ha−1)
39.1 ± 0.35
43.3 ± 1.69
41.1 A
36.4 ± 1.52 bc
42.3 ± 1.02 a
39.3 A
75 % recommended N (120 kg ha−1)
37.4 ± 0.65
41.3 ± 0.37
39.4 A
33.7 ± 0.85c
39.3 ± 0.89b
36.5B
50 % recommended N (80 kg ha−1)
32.4 ± 1.68
36.2 ± 0.67
34.3B
29.1 ± 0.64 d
35.4 ± 0.81c
32.2C
Mean (Urea)
36.3B
40.2 A
33.1B
39.1 A
LSD value (p ≤ 0.05)
U = 3.60 *
N = 2.76 **
U × N = ns
U = 4.59 *
N = 2.07 **
U × N = 2.93 *
Maximum kernel yield (kg ha−1) was recorded in USC during both years. Data was significant for nitrogen levels and urea sources each year while interaction among U (urea sources) and N (nitrogen rates) was non– significant both years (Table 4). Maximum kernel yield was observed at N1 USC during 2016 (3646 kg ha−1). Kernel yield of USC at all nitrogen levels were higher than UG at its above level, kernel yield at N3 in USC was better than N2 in UG, same case was observed for N2.
Harvest index (%) was also affected by urea sources and nitrogen rates. Data was significant for U and N both years, but their interaction was non-significant for harvest index during 2016. Maximum harvest index was recorded at N1 using USC during 2016 (43%). Among nitrogen rates, maximum harvest index was observed at N1 for USC and UG during both years (Table 4).
4.2 Chlorophyll a, b and N-uptake
Data for chlorophyll a and b were significant for the effect of U and N at 90 DAT (days after transplanting), sources of urea and nitrogen levels affected chl a and b (Fig. 2). Maximum chl a and b was recorded in USC during 2017 at N2, same results were observed in 2016. The interaction of U (urea sources) and N (nitrogen rates) was also significant both years at 90 DAT. Minimum chl- a was recorded in UG during 2016 at N3. At 120 DAT, the interaction of U and N was non-significant both years (Fig. 3).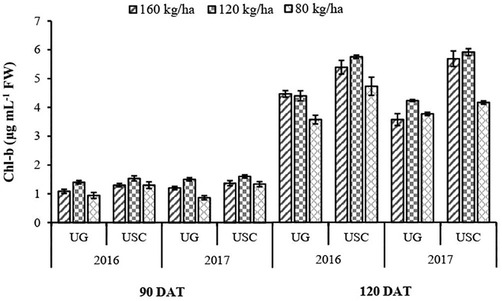
Chlorophyll-b (µg mL−1 FW) as affected by urea sources and levels of nitrogen at 90 and 120 DAT during 2016 and 2017.
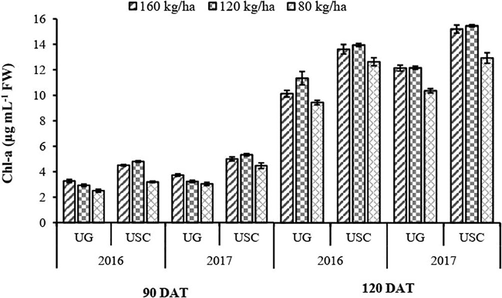
Chlorophyll-a (µg mL−1 FW) as affected by urea sources and levels of nitrogen at 90 and 120 DAT during 2016 and 2017.
Data regarding leaf nitrogen contents showed that the highest value was obtained in USC both years at 90 and 120 DAT. At 120 DAT, a slight increase in leaves were observed (Fig. 4). At N1, maximum nitrogen uptake was recorded. Panicle nitrogen contents increased in 120 DAT as compared to 90 DAT. Highest nitrogen uptake was recorded in USC both years, but under same urea source, variations were recorded among different nitrogen rates (Fig. 5). Highest nitrogen contents in panicle were recorded in USC at N2. Overall, in UG the value that obtained at N1 was comparable to USC at N1.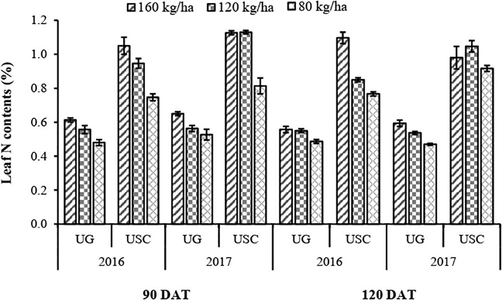
Leaf nitrogen contents (%) as affected by urea sources and levels of nitrogen at 90 and 120 DAT during 2016 and 2017.
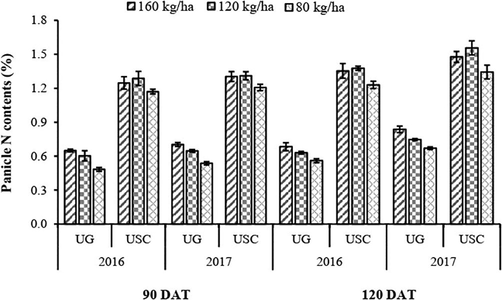
Panicle nitrogen contents (%) as affected by urea sources and levels of nitrogen at 90 and 120 DAT during 2016 and 2017.
5 Discussion
Nitrogenous fertilizers have become integral part of agricultural productions as it is engaged in numerous physiological processes of crops. Addition of N-fertilizers enhance crop yield, but at the same time, it is responsible for disturbance in natural ecosystem and reduction in NUE due to excessive loss. Among cultivated crops, rice has the highest nitrogen losses through water runoff and volatilization. Efficient agronomic practices can not only lessen these N-losses but also will be economical in enhancing yield. Urea coating is environment friendly and cost-effective method. Deficiency of micronutrients like sulphur can also be mitigated by their coating on core fertilizers.
Yield traits were boosted considerably at N1, since higher nitrogen rate can accelerate higher N-availability therefore resulted in dry matter accumulation and contributed to increase in kernel yield (Kumar et al., 2010; Ke et al., 2018), regardless of UG where results were slightly varied from N1 to N2. It may be since application of high dose of nitrogen in rice in the form of granular urea accelerates nitrogen losses (Shivay et al., 2015; Shivay et al., 2016), so reduction in N-dose directly abridged rice yield. Nitrogen losses in rice are the highest (Liu et al., 2016), on the other hand, maximum 1000-kernel weight, kernel yield, biological yield and harvest index were observed in USC. Coating of urea reduces nitrogen losses (Wang et al., 2016; Li et al., 2018) thus improves plant availability of nitrogen. Higher uptake of nitrogen resulted in increased panicle length, numbers of grains per panicle and grain weight. Sulphur coated urea (USC) performed better than granular urea (UG) in obtaining higher chlorophyll a and b. The stability in chlorophyll contents directly contributed to dry matter portioning. Increased uptake of nitrogen was recorded in leaf and panicle at both 90 and 120 DAT under USC that were in accordance with the results of Khan et al., (2015) who quantified that sulphur coated urea improves nitrogen uptake and dry matter production. Urea coating with nutrients also reduces their deficiencies and contribute to yield enhancement in cereals (Affendi et al., 2018). In transplanted rice, use of USC contributes to increased kernel yield (Ke et al., 2018). Urea is highly volatile compound, so excessive nitrogen is lost to the environment that becomes unavailable for plants. The major contribution of coated urea in enhancing NUE is slow releasing of nitrogen from fertilizers (Li et al., 2018). Accessibility of more N to plants improved nitrogen recovery, chlorophyll, and total dry matter (Wang et al., 2016). Sulphur has key role in physiological processes of plants such as formation of chlorophyll that helps in producing carbohydrates, fats, oils, and other compounds. Urea coated with sulphur enhanced its availability and played its part in dry matter assimilation. It also reduced N-release from urea thus contributed to N-accessibility for enhanced duration (Rose, 2016). Urea coated with sulphur reduces N-leaching (Ke et al., 2018; Shivay et al., 2016a,b).
6 Conclusion
From the above discussion of two years experiment, it is concluded that coating of urea with sulphur is more effective in all respects than granular urea. Urea coated with sulphur helps in slow release of nitrogen, therefore it reduces nitrogen losses increases nitrogen availability and uptake. It is recommended that nitrogen must be applied at the rate of 160 kg ha−1 through sulphur coating to obtain higher yield of aromatic transplanted rice.
Acknowledgements
This project was supported by Researchers Supporting Project Number (RSP-2021/5) King Saud University, Riyadh, Saudi Arabia
Declaration of Competing Interest
On behalf of all authors, the corresponding author state that there is no conflict of interest.
References
- Copper enzymes in isolated chloroplasts. Polyphenoloxidase in Beta vulgaris. Plant. Physiol.. 1949;24:1-15.
- [Google Scholar]
- Nitrogen losses from the soil/plant system: a review. Ann. Appl. Biol.. 2013;162(2):145-173.
- [Google Scholar]
- Determination of NPK method of analysis for soil, plant and water. USA: Pvt. Div. Agric. Univ California; 1961. p. :150-179.
- Development of control release urea fertilizer model for water and nitrogen movement in flooded rice. Paddy Water Environ.. 2018;16(1):1-13.
- [Google Scholar]
- Drainage and leaching losses of nitrogen and dissolved organic carbon after introducing maize into a continuous paddy-rice crop rotation. Agr. Ecosyst. Environ.. 2017;249:91-100.
- [Google Scholar]
- Combined controlled-released nitrogen fertilizers and deep placement effects of N leaching, rice yield and N recovery in machine-transplanted rice. Agr. Ecosyst. Environ.. 2018;265:402-412.
- [Google Scholar]
- Effects of sulfur and urease coated controlled release urea on dry matter yield, N uptake and grain quality of rice. J. Anim. Plant Sci.. 2015;25:679-685.
- [Google Scholar]
- Comparative rice yield and economic advantage of foliar KNO3 over soil applied K2SO4. Pak. J. Agric. Sci.. 2012;49:481-484.
- [Google Scholar]
- Effect of neem-oil coated prilled urea with varying thickness of neem (Azadirachta indica A. Juss)- oil coating and N rates on productivity and nitrogen-use efficiency of lowland irrigated rice under Indo-Gangetic plains. J. Plant. Nutr.. 2010;33:1939-1959.
- [Google Scholar]
- Nitrogen losses, use efficiency, and productivity of early rice under controlled-release urea. Agr. Ecosyst. Environ.. 2018;251:78-87.
- [Google Scholar]
- Global assessment of nitrogen losses and trade-offs with yields from major crop cultivations. Sci. Total. Environ.. 2016;572:526-537.
- [Google Scholar]
- Global nitrogen and phosphorus fertilizer use for agriculture production in the past half century: shifted hot spots and nutrient imbalance. Earth Syst. Sci Data.. 2017;9(1):181-192.
- [Google Scholar]
- Global gray water footprint and water pollution levels related to anthropogenic nitrogen loads to fresh water. Environ. Sci. Technol.. 2015;49(21):12860-12868.
- [Google Scholar]
- Simple method for simultaneous determination of chlorophyll and carotenoids in tomato fruit. J. Japan. Soc. Food Sci. Technol.. 1992;39(10):925-928.
- [Google Scholar]
- Slow release coating remedy for nitrogen loss from conventional urea: a review. J. Control Release.. 2016;225:109-120.
- [Google Scholar]
- Efficiency of coated urea on nutrient uptake and maize production. Commun. Soil. Sci. Plan.. 2018;49(11):1394-1400.
- [Google Scholar]
- Controlling harmful cyanobacterial blooms in a hyper-eutrophic lake (Lake Taihu, China): the need for a dual nutrient (N & P) management strategy. Water Res.. 2011;45:1973-1983.
- [Google Scholar]
- Applications of natural polymer gum arabic: a review. Int. J. Food Prop.. 2015;18(5):986-998.
- [Google Scholar]
- Nitrogen deposition and plant biodiversity: past, present, and future. Front. Ecol. Environ.. 2017;15(8):431-436.
- [Google Scholar]
- Relative performance of boron, sulphur and zinc coatings onto prilled urea for increasing productivity and nitrogen use efficiency in maize. Exp. Agr.. 2018;54(4):577-591.
- [Google Scholar]
- Piling up reactive nitrogen and declining nitrogen use efficiency in Pakistan: a challenge not challenged (1961–2013) Environ. Res. Lett.. 2018;13(3):034012.
- [CrossRef] [Google Scholar]
- Nitrogen in agriculture: balancing the cost of an essential resource. Annu. Rev. Env. Resour.. 2009;34(1):97-125.
- [Google Scholar]
- Polymer-coated urea delays growth and accumulation of key nutrients in aerobic rice but does not affect grain mineral concentrations. Agron.. 2016;6(1):9.
- [CrossRef] [Google Scholar]
- Sulphur-coated urea as a source of sulphur and an enhanced efficiency of nitrogen fertilizer for spring wheat. Cereal. Res. Commun.. 2016;44(3):513-523.
- [Google Scholar]
- Effect of nitrogen levels and coated urea on growth, yields and nitrogen use efficiency in aromatic rice. J. Plant Nutr.. 2016;39(6):875-882.
- [Google Scholar]
- Principles and Procedures of Statistics, a Biometric Approach (third ed.). New York: McGraw Hill Book Co., Inc.; 1996.
- Assessing groundwater quality and health risks of nitrogen pollution in the Shenfu mining area of Shaanxi Province, northwest China. Expos. Health.. 2018;10(2):77-97.
- [Google Scholar]
- Sutton, M.A., Howard, C.M., Erisman, J.W., Billen, G., Bleeker, A., Grennfelt, P., Van Grinsven, H. and Grizzetti. B., 2011. The European nitrogen assessment: sources, effects and policy perspectives. (eds.) Cambridge University Press.
- Suppression of ammonia volatilization from rice–wheat rotation fields amended with controlled-release urea and urea. Agron. J.. 2016;108(3):1214-1224.
- [Google Scholar]
- Long-term cropping effects on partitioning of water flow and nitrate loss between surface runoff and tile drainage. J. Environ. Qual.. 2018;47(4):820-829.
- [Google Scholar]
- Direct seeded rice increases nitrogen runoff losses in southeastern China. Agr. Ecosyst. Environ.. 2018;251:149-157.
- [Google Scholar]
- Human health risk assessment of groundwater nitrogen pollution in Jinghui canal irrigation area of the loess region, northwest China. Environ. Earth Sci.. 2018;77:273.
- [Google Scholar]


