

Translate this page into:
Subsurface structural mapping from high-resolution gravity data using advanced processing methods
⁎Corresponding author. eldosoky@yahoo.com (Ahmed M. Eldosouky) ahmed.eldosouky@sci.suezuni.edu.eg (Ahmed M. Eldosouky)
-
Received: ,
Accepted: ,
This article was originally published by Elsevier and was migrated to Scientific Scholar after the change of Publisher.
Peer review under responsibility of King Saud University.
Abstract
The study area has a complex geological structure and is studied for mapping the density interfaces using geophysical techniques. However, it has not been studied for mapping geological structures, such as contacts and faults that appear as lineaments in gravity data. In this study, the lineaments in the area have been delineated using Bouguer gravity anomaly data, though some modern processing methods, such as horizontal gradient amplitude (HGA), tilt angle of horizontal gradient amplitude (THGA), and enhancement of horizontal gradient amplitude (EHGA). Most of the identified lineaments are trending in the NW–SE direction and some WE-trending lineaments in the southeastern region. This study provides new information for a better understanding of the structural framework and tectonic setting of the Thua Thien Hue area.
Keywords
Lineaments
Gravity
Edge detection
EHGA
Thua Thien Hue
Subsurface mapping

1 Introduction
The potential field methods measure tiny changes in the magnetic and gravity fields. These fields can give information on the crustal structure of the Earth (Eldosouky, 2019; Pham et al., 2019, 2020a, 2021a; Sehsah and Eldosouky, 2020; Nguyen et al., 2020). Gravity field data are critical for structural mapping (Sehsah et al., 2019; Eldosouky et al., 2020a; Eldosouky and Saada, 2020), especially for information on geological structures (Nabighian et al., 2005) and have signals with a large dynamic amplitude range that depend on the geometries, depths, and density properties of the sources (Ferreira et al., 2013). Edge enhancement techniques are generally used to emphasize the characteristics of the gravity field to interpret the geology of gravity anomaly data (Pham, 2020a; Eldosouky et al., 2020b). Various techniques are available in the literature, most of which are based on gradients of gravity data (Nasuti and Nasuti, 2018; Eldosouky and Mohamed, 2021; Pham et al., 2021b, 2021c). Some edge detector techniques, such as the horizontal gradient amplitude (Cordell et al., 1985), analytic signal (Roest et al., 1992), tilt derivative (Miller and Singh, 1994), theta (Wijns et al., 2005), normalized horizontal derivative (Cooper and Cowan, 2006), and tilt derivative of the horizontal gradient amplitude (Ferreira et al., 2013), are used to outline the boundaries of density structures. However, the boundaries detected by these techniques are rather diffuse (Oksum et al., 2019; Pham et al., 2021a, 2021d). Therefore, some filters, such as the improved normalized horizontal tilt angle (Li et al., 2014), improved theta method (Yuan et al., 2016), improved enhanced tilt angle (Nasuti and Nasuti, 2018), total directional theta method (Zareie and Moghadam, 2019), enhanced horizontal derivative amplitude (Pham et al., 2020b), Heaviside step function (Pham, 2021), softsign function (Pham et al., 2021d), and improved logistic functions (Pham et al., 2020c, Melouah and Pham, 2021) have been developed to improve the resolution of the edges.
The Thua Thien Hue area extends from latitude 15.47° N to 17.29° N and longitude 106.49° E to 108.30° E. A previous gravity study in the area focused only on estimating the depths to density interfaces by inverting gravity data (Hung et al., 2019).
In this study, the horizontal gradient amplitude (HGA), tilt derivative of the horizontal gradient amplitude (THGA), and enhanced horizontal gradient amplitude (EHGA) to the Bouguer data of the Thua Thien Hue has been applied to determine faults/lineaments. The results obtained from this work provide new elements to improve knowledge of the structure of the Thua Thien Hue area.
2 Geological setting
The geological structures of the Thua Thien Hue area are divided by some tectonic faults as a result of the collision of the Eurasian and Indian-Australian plates (Tapponnier et al., 1982, Xuan et al., 2020). The area has one of the biggest titanium resources in the world (Giuliani et al., 2011). In this area, the geological platform of the southwestern and southern parts belongs to the Truong Son fold system, and that of the northeastern part belongs to the Red River basin (Trang, 1996). The study area’s strata include Paleozoic, Late Proterozoic-Early Paleozoic metamorphic, Neogene terrigenous, and Quaternary unconsolidated sediments. These formations include the Nui Vu formation of Late Proterozoic-Cambrian age, A Vuong formation of Cambrian-Ordovician age, Long Dai formation of Ordovician-Silurian age, Tan Lam formation of Early Devonian age, Co Bai formation of Middle-Late Devonian age, Pliocene-Lower Pleistocene sediment, and A Lin formation. In the study area, the Quaternary unconsolidated sediment is composed of sand, breccia, silt, and pebble, predominantly distributed in the northeastern region along the coast and narrow areas along rivers and streams (Fig. 1).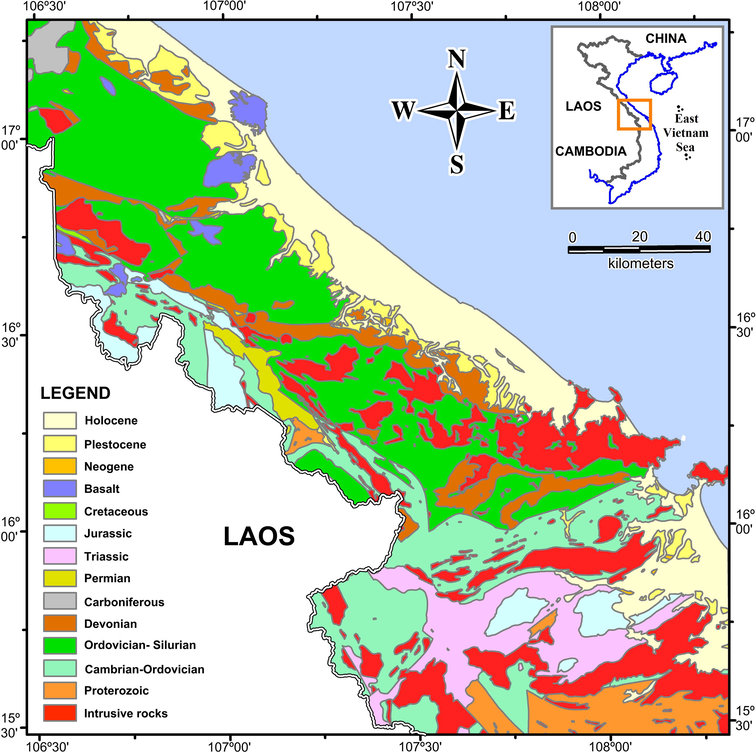
Schematic geological map (Trang, 1996).
3 Data and methodology
3.1 Data
The gravity data set was computed by Pham (2020b) using 1′ × 1′ grid gravity data derived from the CryoSat‐2 and Jason‐1 satellites, which has twice the accuracy than the previous gravity model (Sandwell et al., 2014). Fig. 3a displays the Bouguer anomalies after applying corrections to the free-air gravity anomaly data using densities of 1.03 g/cm3 and 2.67 g/cm3 for the seawater and crustal rock, respectively (Pham, 2020b). Recently, applications of edge enhancement techniques to satellite gravity data have shown great success (Narayan et al., 2017; Kunnummal and Anand, 2019; Kumar et al., 2020; Pham et al., 2021c).
3.2 Methodology
Extracting the lateral boundaries of the subsurface structures is a frequently required task in interpreting gravity data. The HGA is a commonly used technique, using peak values to extract the edges. The HGA of gravity data F is calculated from the two horizontal gradients
and
, using Cordell et al. (1985) formula
Fig. 2b displays the HGA of the gravity data (Fig. 2a) of 2D sources that are shown at the bottom of Fig. 2. As can be seen, the HGA is dominated by high amplitude responses from the shallower structure.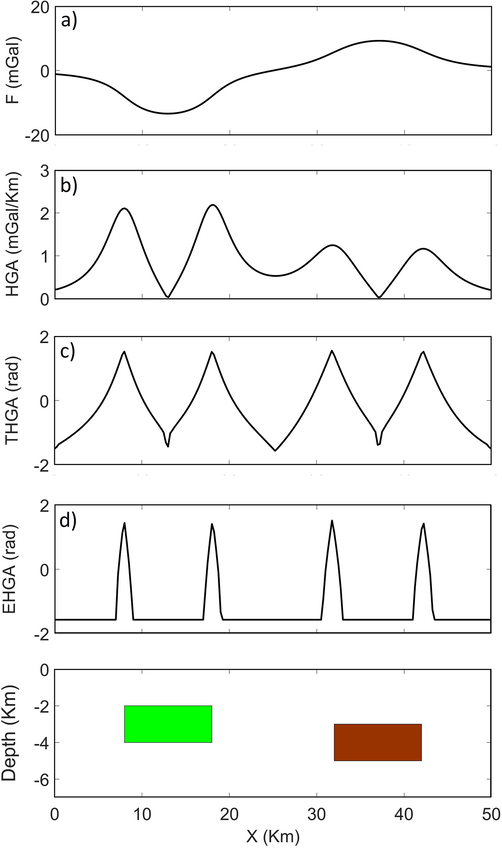
(a) Gravity of the 2D gravity model, (b) THG, (c) THGA, and (d) EHGA with k = 8.
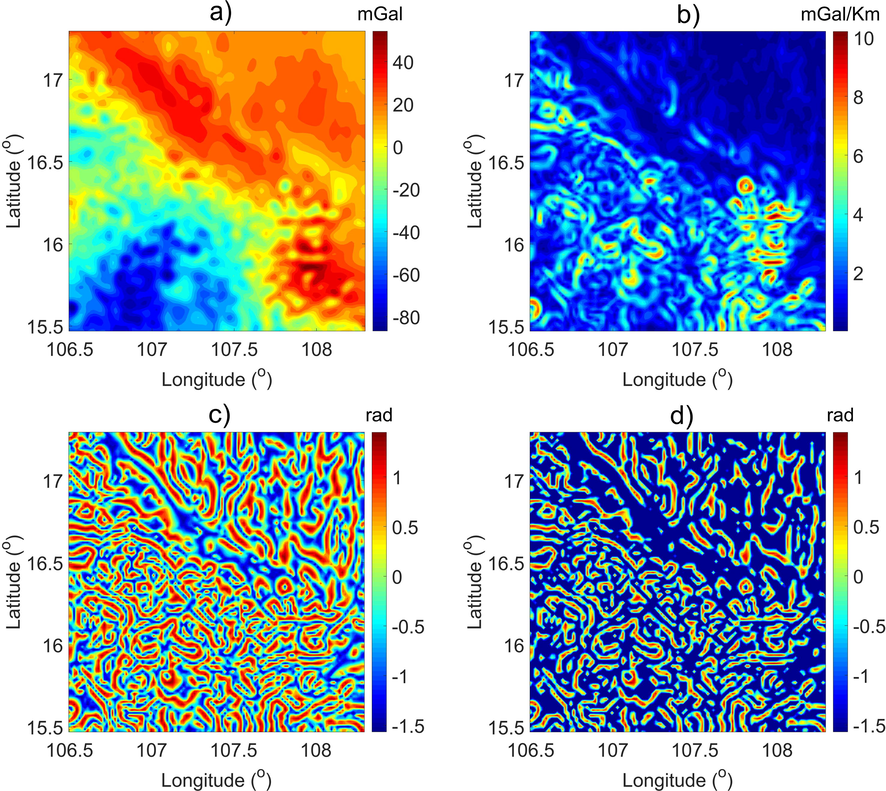
(a) Bouguer gravity data of the Thua Thien Hue area, (b) HGA, (c) THGA, and (d) EHGA.
To equalize the anomalies with different amplitudes, Ferreira et al. (2013) proposed using the THGA as follows
Pham et al. (2020b) recently introduced another filter, the EHGA, which is defined as follows
and k is a positive number defined by the interpreter. A value of k that is ≥2 will produce the best result. The EHGA value is limited to between −π⁄2 and +π⁄2, where its peaks are located over the source lateral boundaries. As shown in Fig. 1c, the EHGA produces a sharper image on the body edges than the HGA and THGA filters.
4 Results
The HGA, THGA, and EHGA methods were applied to the Bouguer gravity data in Fig. 3a. Fig. 3b displays the HGA image of the gravity data. Because the HGA technique depends on the burial depth of the source, it does not produce a balanced image for the gravity lineaments. The northeastern portion of the area has lower HGA amplitude values, which might be related to increasing basement burial depths in the East Vietnam Sea. Conversely, the increase in amplitude in the southwestern and southern parts of the Thua Thien Hue could be related to the basement (Hung et al., 2019). Fig. 3c and d show the THGA and EHGA maps, respectively. Unlike the HGA method, the THGA and EHGA methods can equalize the amplitudes of small and large anomalies. Both methods are effective in providing more detailed structures compared to the HGA method.
To reduce the noise effect and improve the effects of deep structures, we applied a 5 km upward continuation filter to the gravity data in Fig. 3a before using edge detection techniques. Fig. 4a shows the Bouguer gravity data after the upward continuation of 5 km. Fig. 4b, c, and d show the results determined by applying the HGA, THGA, and EHGA methods, respectively. Although the HGA method is more effective in enhancing the deep structures in the East Vietnam Sea than its previous result, the detected result is faint. Again, the THGA and EHGA methods provide more detailed features than the HGA method.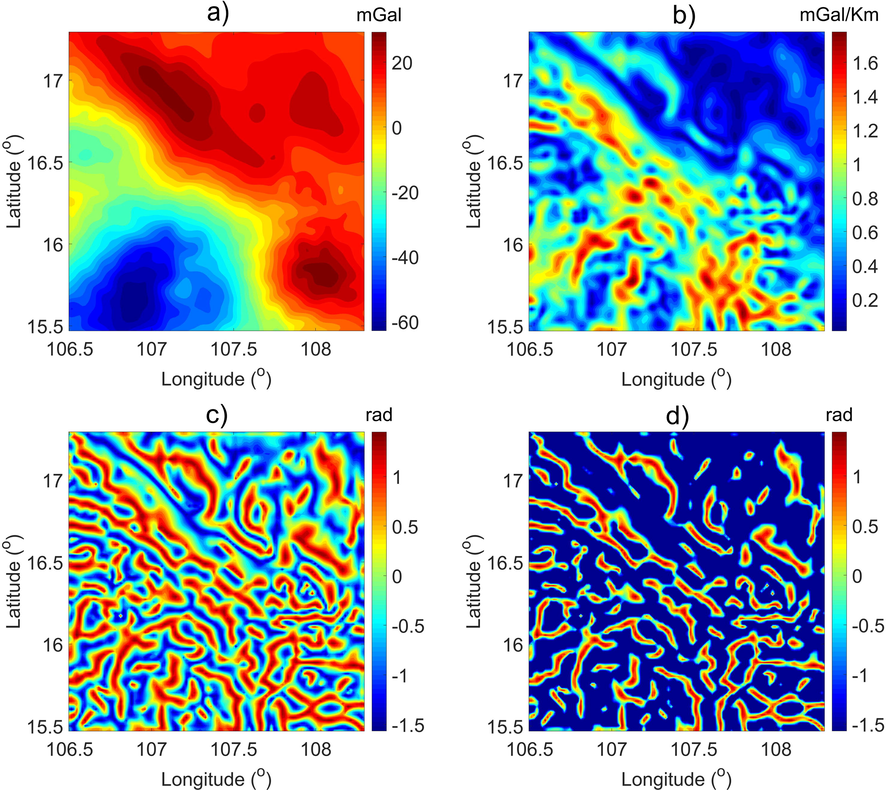
(a) Bouguer gravity data of the Thua Thien Hue area after upward continuation of 5 km, (b) HGA, (c) THGA, and (d) EHGA.
5 Discussions
The results detected by the THGA and EHGA methods (Fig. 3c and d) indicate that several trends exist in the data, with the NW–SE trend being dominant. These results correlate well with the trend of geology structures in the area (Fig. 1). Although the THGA and EHGA methods are more effective in enhancing the main gravity structures than the HGA method, the EHGA can bring lineaments with higher resolution. The edges determined by the EHGA method are marked to locate the lineaments (Fig. 5a). The rose diagram of these marked lineaments is displayed in Fig. 5c. This diagram shows some main trends with the dominated lineament trends in NW–SE direction. By comparing Figs. 1 and 5a, we can see that the boundaries of the intrusive rocks are well extracted by the EHGA method. The obtained result also reveals N-S trending lineaments in the East Vietnam Sea and NE–SW trending lineaments in the southeastern region.
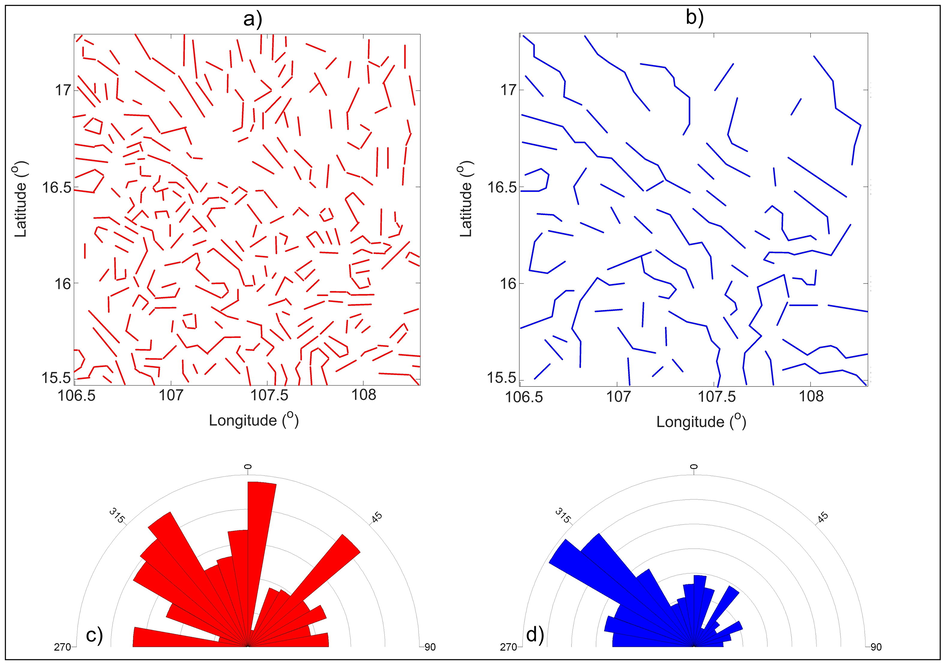
As can be observed from Fig. 4, the NW–SE trending lineaments of upward continued data in the THGA and EHGA (Fig. 4c and d) maps appear more distinctly than the map HGA (Fig. 4b). The southeastern region displays the E–W trending lineament, indicative of a deep subsurface feature in the region. Although both the THGA and EHGA methods can equalize different amplitude anomalies, the results detected using the EHGA provide sharper lineaments. In this case, the edges in the EHGA map are also marked to locate the lineaments (Fig. 5b). The rose diagram of these marked lineaments is displayed in Fig. 5d. We can see that most of the extracted lineaments are NW–SE trending and some E–W, N–S trending lineaments in the southeastern region. Fig. 6 displays the superposition of the lineaments in Fig. 5a and b. As can be seen from this figure, the NW–SE trending lineaments of the upward-continued data are more clear. On the other hand, the EHGA peaks demonstrate the existence of many lineaments that are not extracted by geological mapping alone. It has been anticipated that the lineaments trending NW–SE extracted in this study are related to the same activity of tectonic plates (Tapponnier et al., 1982; Lacassin et al., 1997).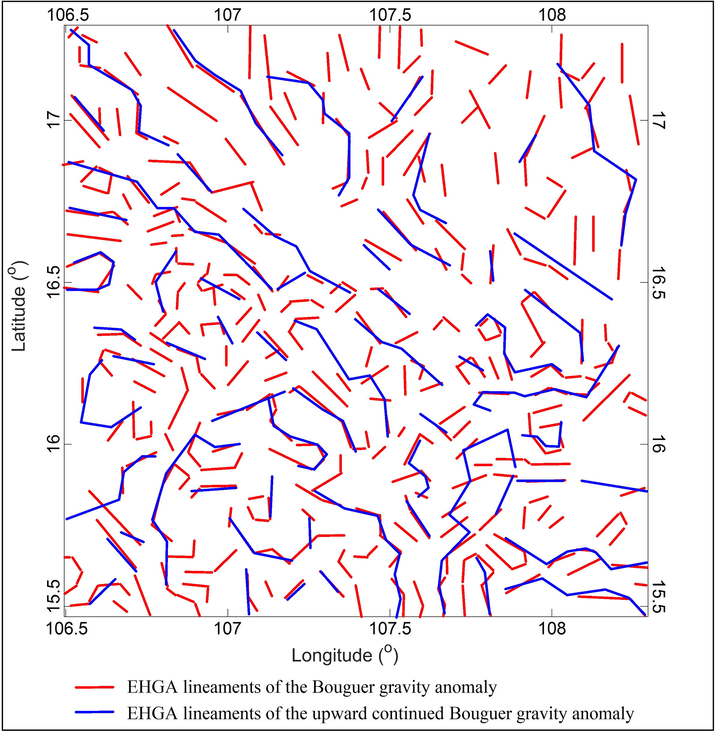
Superposition of the lineaments in Fig. 5a and b.
6 Conclusions
Different edge enhancement methods (HGA, THGA, and EHGA) are applied to the Bouguer gravity data to extract the structural features of the Thua Thien Hue area. The obtained results show that the THGA and EHGA methods enhanced the lineaments of all anomalies, whereas the HGA method extracted the lineaments mostly of large-amplitude anomalies. Furthermore, the EHGA method can produce lineaments with higher resolution than the HGA and THGA methods. We also found that most boundaries delineated in this study are lineaments with the NW–SE trend being dominant, sympathetic to the known geologic information of the area. In addition, the obtained results demonstrate the existence of many lineaments that are not extracted by geological mapping alone. The results of this work will immensely help understand the tectonic and structural framework of the Thua Thien Hue area.
Acknowledgements
The authors extend their appreciation to the Deanship of Scientific Research at King Saud University, Saudi Arabia for funding this work through the research group No. RGP -1436-011.
Declaration of Competing Interest
The authors declare that they have no known competing financial interests or personal relationships that could have appeared to influence the work reported in this paper.
References
- Enhancing potential field data using filters based on the local phase. Comput. Geosci.. 2006;32(10):1585-1591.
- [Google Scholar]
- Cordell, L., Lindrith, Grauch, V.J.S., 1985. Mapping basement magnetization zones from aeromagnetic data in the San Juan basin. New Mexico in Hinze, W. J., (ed.), The utility of regional gravity and magnetic anomaly maps: Society of Exploration Geophysicists, p. 181–197.
- Aeromagnetic data for mapping geologic contacts at Samr El-Qaa area, North Eastern Desert, Egypt. Arab. J. Geosci.. 2019;12:2.
- [CrossRef] [Google Scholar]
- Edge detection of aeromagnetic data as effective tools for structural imaging at Shilman area, South Eastern Desert, Egypt. Arab. J. Geosci.. 2021;14:13.
- [Google Scholar]
- Enhancing linear features in aeromagnetic data using directional horizontal gradient atWadi Haimur area, South Eastern Desert, Egypt. Carpathian J. Earth Environ. Sci.. 2020;15(2):323-326.
- [Google Scholar]
- A comparative study of THG, AS, TA, Theta, TDX and LTHG techniques for improving source boundaries detection of magnetic data using synthetic models: a case study from G. Um Monqul, North Eastern Desert, Egypt. J. Afr. Earth Sci.. 2020;170:103940.
- [Google Scholar]
- Source edge detection (SED) of aeromagnetic data: synthetic examples and a case study from Haimur area, south Eastern Desert, Egypt. Arab J Geosci. 2020;13:626.
- [CrossRef] [Google Scholar]
- Ferreira, F.J.F., de Souza, J., de B. e S. Bongiolo, A., de Castro, L.G., 2013. Enhancement of the total horizontal gradient of magnetic anomalies using the tilt angle. Geophysics 78(3), J33–J41.
- Soils and sediments of the Thua Thien-Hue Province (central Vietnam): recognizing trace element sources and the likely influence of natural events. J. Environ. Monit.. 2011;13(5):1383.
- [CrossRef] [Google Scholar]
- Study on structure of the Earth’s crust in Thua Thien-Hue province and adjacent areas by using gravity and magnetic data in combination. Vietnam J. Marine Sci. Technol.. 2019;19(4):517-526.
- [Google Scholar]
- New insights on Kimberlite emplacement around the Bundelkhand Craton using integrated satellite-based remote sensing, gravity and magnetic data. Geocarto Int. 2020
- [CrossRef] [Google Scholar]
- Qualitative appraisal of high-resolution satellite derived free air gravity anomalies over the Maldives Ridge and adjoining ocean basins, Western Indian Ocean. J. Asian Earth Sci.. 2019;169:199-209.
- [Google Scholar]
- Tertiary diachronic extrusion and deformation of western Indochina: Structural and 40Ar/39Ar evidence from NW Thailand. J. Geophys. Res.. 1997;102(B5):10013-10037.
- [Google Scholar]
- Optimised edge detection filters in the interpretation of potential field data. Exploration Geophys.. 2014;45(3):171-176.
- [Google Scholar]
- An improved ILTHG method for edge enhancement of geological structures: application to gravity data from the Oued Righ valley. J. African Earth Sci.. 2021;177:104162.
- [CrossRef] [Google Scholar]
- Potential field tilt a new concept for location of potential field sources. J. Appl. Geophys.. 1994;32(2-3):213-217.
- [Google Scholar]
- Historical development of the gravity method in exploration. Geophysics. 2005;70(6):63ND-89ND.
- [Google Scholar]
- Delineation of structural features over a part of the Bay of Bengal using total and balanced horizontal derivative techniques. Geocarto Int.. 2017;32(4):351-366.
- [Google Scholar]
- NTilt as an improved enhanced tilt derivative filter for edge detection of potential field anomalies. Geophys. J. Int.. 2018;214(1):36-45.
- [Google Scholar]
- Sedimentary basement structure of the Southwest Sub-basin of the East Vietnam Sea by 3D direct gravity inversion. Marine Geophys. Res.. 2020;41:7.
- [Google Scholar]
- Inverting gravity anomalies over the Burdur sedimentary basin, SW Turkey. Acta Geodaetica Geophys.. 2019;54(4):445-460.
- [Google Scholar]
- A comparative study on different filters for enhancing potential field source boundaries: synthetic examples and a case study from the Song Hong Trough (Vietnam) Arab. J. Geosci.. 2020;13:723.
- [Google Scholar]
- A comparative study on different methods for calculating gravity effect of an uneven layer: Application to computation of Bouguer gravity anomaly in the East Vietnam Sea and adjacent areas. VNU J. Sci.: Math.-Phys.. 2020;36(3):106-114.
- [Google Scholar]
- A high resolution edge detector for interpreting potential field data: a case study from the Witwatersrand basin, South Africa. J. Afr. Earth Sci.. 2021;178:104190.
- [CrossRef] [Google Scholar]
- Estimation of curie point depths in the southern Vietnam continental shelf using magnetic data. Viet. J. Earth Sci.. 2019;41(3):216-228.
- [Google Scholar]
- A new high-resolution filter for source edge detection of potential data. Geocarto Int. 2020
- [CrossRef] [Google Scholar]
- Pham, L.T., Oksum, E., Gomez-Ortiz, D., Do, T.D., 2020a. MagB_inv: a high performance Matlab program for estimating the magnetic basement relief by inverting magnetic anomalies. Comput. Geosci. 104347.
- Enhancement of potential field source boundaries using an improved logistic filter. Pure Appl. Geophys.. 2020;177(11):5237-5249.
- [Google Scholar]
- On the performance of phase-based filters for enhancing lateral boundaries of magnetic and gravity sources: a case study of the Seattle Uplift. Arab. J. Geosci.. 2021;14(2)
- [CrossRef] [Google Scholar]
- An improved approach for detecting ridge locations to interpret the potential field data for more accurate structural mapping: a case study from Vredefort dome area (South Africa) J. Afr. Earth Sci.. 2021;175:104099.
- [CrossRef] [Google Scholar]
- An improved approach for detecting the locations of the maxima in interpreting potential field data. Arab. J. Geosci.. 2021;14:43.
- [Google Scholar]
- Edge detection of potential field sources using the softsign function. Geocarto Int. 2021
- [CrossRef] [Google Scholar]
- Magnetic interpretation using the 3-D analytic signal. Geophysics. 1992;57(1):116-125.
- [Google Scholar]
- New global marine gravity model from CryoSat-2 and Jason-1 reveals buried tectonic structure. Science. 2014;346(6205):65-67.
- [Google Scholar]
- Neoproterozoic hybrid forearc – MOR ophiolite belts in the northern Arabian-Nubian Shield: no evidence for back-arc tectonic setting. Int. Geol. Rev. 2020
- [CrossRef] [Google Scholar]
- Unpaired ophiolite belts in the neoproterozoic allaqi-heiani suture, the arabian-nubian Shield: evidences from magnetic data. J. Afr. Earth Sci.. 2019;156(2019):26-34.
- [CrossRef] [Google Scholar]
- Propagating extrusion tectonics in Asia: New insights from simple experiments with plasticine. Geology. 1982;10(12):611-616.
- [Google Scholar]
- Trang, N.V., 1996. Geological and mineral resources map of Huong Hoa-Hue-Da Nang sheet (1:200,000). Department of Geology and Minerals of Vietnam, Hanoi, 94 p. (in Vietnamese).
- Soil Gas Radon Measurement for Identifying Active Faults in Thua Thien Hue (Vietnam) J. Geosci. Environ. Protection. 2020;08(07):44-64.
- [Google Scholar]
- Advantages of horizontal directional Theta method to detect the edges of full tensor gravity gradient data. J. Appl. Geophys.. 2016;130:53-61.
- [Google Scholar]
- The application of theta method to potential field gradient tensor data for edge detection of complex geological structures. Pure Appl Geophys.. 2019;176(11):4983-5001.
- [Google Scholar]
Appendix A
Supplementary data
Supplementary data to this article can be found online at https://doi.org/10.1016/j.jksus.2021.101488.
Appendix A
Supplementary data
The following are the Supplementary data to this article:


