

Translate this page into:
Structural mapping of the west central Arabian Shield (Saudi Arabia) using downward continued magnetic data
⁎Corresponding author. luanpt@hus.edu.vn (Luan Thanh Pham)
-
Received: ,
Accepted: ,
This article was originally published by Elsevier and was migrated to Scientific Scholar after the change of Publisher.
Peer review under responsibility of King Saud University.
Abstract
In this study, we have applied a stable downward continuation technique to magnetic anomalies from the global geomagnetic field model MAG2V3 to improve the resolution of magnetic data of the west central Arabian Shield, Saudi Arabia. Then, advanced interpretation methods such as the tilt angle of the horizontal gradient (TAHG), horizontal gradient of a modified tilt angle (HGSTDR), and enhanced horizontal gradient (EHGA) have been applied to downward continued magnetic dataset to highlight the main structural features in the region. The observed geologic structures from the magnetic analysis revealed NW-SE, NE-SW, and ENE-WSW orientations in the west central Arabian Shield. The depths of these structures were computed by the analytic signal (AS) technique and the obtained result shows depths varying from 1.2 to 9.2 km. This study provided a new map of the subsurface geological structures for a better understanding of the tectonic evolution of the west central Arabian Shield.
Keywords
Magnetic interpretation
Subsurface structures
MAG2V3
west central Arabian Shield

1 Introduction
Geophysical methods are used as a powerful tool to map geologic structures (Ekinci et al., 2012, 2013, 2015; Duong et al., 2021; Wijanarko et al., 2022; Narayan et al., 2016, 2021, 2022, 2023; Trung et al., 2023; Xayavong et al., 2023). The magnetic data obtained from the global geomagnetic field model MAG2V3 is characterized by low cost and broad coverage compared to other geophysical methods (Nabighian et al., 2005; Hinze et al., 2012). Interpretation of magnetic anomalies provides important information about hidden geological features (Saada et al., 2021a, 2022). The shapes of the magnetic anomalies are intrinsically smoothed with respect to that of their structures. Thus, magnetic data collected from aerial surveys or the ground should be enhanced to improve its spatial resolution. Downward continuation of magnetic data can provide a better resolution of geologic structures due to the enhancement of short wavelength anomalies. However, the downward continuation using the traditional frequency domain technique is unstable and divergent (Tran and Nguyen, 2020). Some authors (e.g., Fedi and Florio, 2002; Pasteka et al., 2012) introduced stable downward continuation methods to solve this issue. Another stable technique based on the Taylor series expansion of anomalies was also introduced by Tran and Nguyen (2020).
Apart from the downward continuation, numerous techniques have been developed for mapping geologic formations by deciphering magnetic anomalies (Pham et al., 2023; Ekwok et al., 2022a, b). These methods are based on gradients of data (Saada et al., 2021b; Prasad et al., 2022a; Pham et al., 2022a, Kamto et al., 2023; Pham and Prasad, 2023). In general, there are two categories of edge detection methods: unbalanced and balanced. The total gradient (Nabighian, 1972), horizontal gradient (Cordell, 1979), high order total gradient (Hsu et al., 1996), and high order horizontal derivative (Fedi and Florio, 2001) are the commonly used unbalanced methods. To detect the boundaries of small and large signals, some normalized methods have been introduced. For example, the tilt angle (Miller and Singh, 1994), theta map (Wijns et al., 2005), normalized statistics (Cooper and Cowan, 2008), and orthogonal Hilbert transforms (Cooper, 2009). Some high-resolution methods have been introduced by others, for example, the tilt derivative of the horizontal gradient (Ferreira et al., 2013), the horizontal gradient of a modified tilt angle (Nasuti et al., 2019), improved theta (Zareie, and Moghadam, 2019), logistic functions (Pham et al., 2019, 2020), enhanced horizontal gradient (Pham et al., 2022b), enhanced total gradient (Prasad et al., 2022a), analytic signals-based detector (Jorge et al., 2023). Eldosouky et al., (2022a), Pham and Prasad (2023) reviewed the effectiveness of the edge estimation techniques in terms of their precision in the determination of the edges of sources on both observed and synthetic data.
The west central part of Saudi Arabia is bounded to the east by Hadan, to the west by the Red Sea, to the south by Mecca, and to the north by Harrat Rahat (Fig. 1). The crustal structures of the west central Arabian Shield have been studied by some researchers using gravity and seismic data (Al-Amri, 1998, 1999; Nyblade et al., 2006; Eldosouky et al., 2021, 2022b; Qaysi et al., 2022). Some other studies in the area were centered on mapping geological structures using magnetic data. AlSaud (2008) used the vertical derivative and tilt derivative to map structures in the area from magnetic data. However, the use of these methods brings false structures, as reported by Eldosouky et al., (2022a, c). Eldosouky et al. (2021) used the enhanced horizontal gradient to map the lithospheric structure of the whole Arabian Shield. Melouah et al. (2023) used the logistic methods and some other techniques to bring a clear map for the structures of the area. Abdelrahman et al. (2023) mapped geothermal anomalies in the area using magnetic data. All these studies used magnetic data instead of downward continued magnetic data that can provide more detailed results.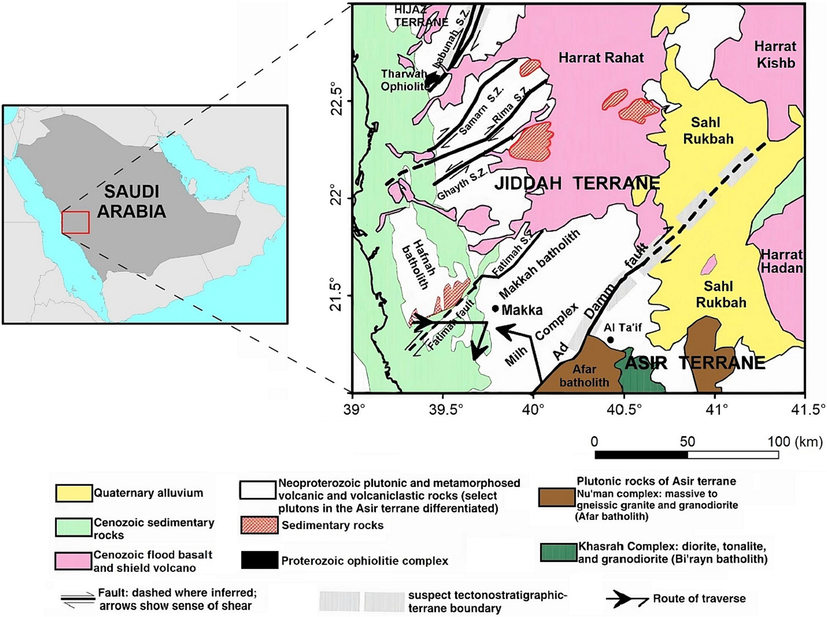
Regional geological map of the west central Arabian Shield overlaid by major tectonic features (after AlSaud, 2008).
In this paper, some advanced interpretation techniques such as the tilt of the horizontal gradient (TAHG), horizontal gradient of a modified tilt (HGSTDR), and enhanced horizontal gradient (EHGA) were applied to interpret downward continued magnetic anomalies in the west central Arabian Shield (Saudi Arabia) instead of directly using magnetic data from the MAG2V3 model like some previous studies. We also estimated the depth of the obtained structures by the analytic signal technique. The use of downward continued magnetic data in this study helped to generate a new structural map with higher resolution.
2 Geological setting
The study region is situated between latitudes 21° and 23° N and longitudes 39° to 41.5° E in the west-central region of Saudi Arabia (Fig. 1). The Ad Damm fault zone dominates the west central region of Saudi Arabia, which divides the region into two contrasting structural domains and runs diagonally across it from northeast to southwest (Fig. 1). The region comprises four main rock units: Cenozoic sedimentary rocks, Neoproterozoic plutonic and metamorphosed volcanic and volcaniclastic formations, Cenozoic flood basalt and shield volcano and Quaternary alluvium (Fig. 1). The southern part of the west-central region of Saudi Arabia exposes the Plutonic rocks of the Asir terrane, comprising biotite, orthogneiss, monzogranite, and hornblende biotite monzogranite to granodiorite orthogneiss, as reported by AlSaud (2008). In contrast, sedimentary rocks are predominantly found in the Jiddah terrane with a scattered distribution. According to AlSaud (2008), the oldest rocks exposed in the research region are basalt, quartzite, quartz-rich schist, marble, and amphibolites. Some lava intrusion structures were recognized in the study region (Moore and AlRehaili, 1989).
3 Data and methods
3.1 Data
The global magnetic model EMAG2v3 (Meyer et al., 2017) was used to extract the magnetic data for the study area. This model has been used by many authors in determining structures in the Earth's crust (Mohamed and Deep, 2021; Eldosouky et al., 2021, Lei et al., 2022; Njeudjang et al., 2023; Abdelrahman et al., 2023, Solano-Acosta et al., 2023). The data having a 2′×2′ resolution is obtained by a combination of data from ship, satellite, and airborne magnetic measurements. The last version of the global magnetic model (i.e., EMAG2v3 version) is a significant update of the previous release of the Earth's magnetic field. Fig. 6a presents the magnetic anomalies of the west central Arabian Shield. The range of anomalies is − 134 to 137 nT and the magnetic map shows dominant E–W and NE–SW anomaly trends. As shown in Fig. 2, the highest peak of 137 nT is observed in the northeastern region, while most negative values are observed in the southern region.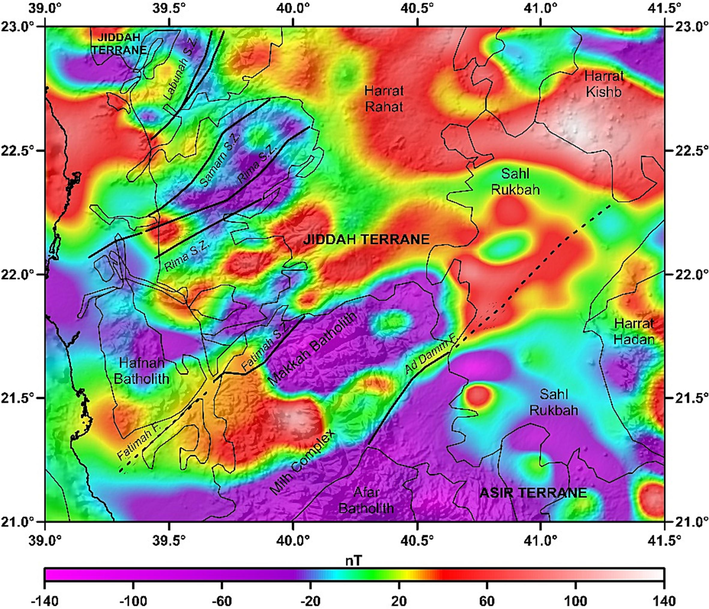
Magnetic anomaly map of the study area with major tectonic features. The thin lines are the boundaries of major geological provinces, dark black colored lines are the major faults and the discontinuous lines are the major shear zones.
3.2 Methods
3.2.1 Downward continuation
Tran and Nguyen (2020) developed a stable technique for downward continuation. According to Fedi and Florio (2002), the downward continued anomaly is given by the Taylor series as the following equation:
where
is the downward continuation distance, and
,
,
are the vertical gradients of orders 1, 2, 3, … , N of magnetic data
, which can be determined from the following equation system (Tran and Nguyen, 2020):
Solving Eq. (3) with n = 10, we obtain
,
,
and by substituting these gradients into Eq. (1), the downward continued field can be written as:
3.2.2 Edge determination
The TAHG was presented by Ferreira et al. (2013) to extract the body edges. This detector is known as the arctangent of the ratio between the horizontal gradient derivatives, and is expressed as:
where HG is the horizontal gradient, which is defined by:
The detector uses the peaks to outline the geological boundaries. The tests of Ferreira et al. (2013) pointed out that its sensitivity to depth is low, and it can estimate the edges accurately.
The HGSTDR is presented by Nasuti et al. (2019) to improve the resolution of the source edges. It computes the horizontal gradient of a modified tilt angle to map the body edges, and is expressed as (Nasuti et al., 2019):
where the STDR is defined by:
where k is the absolute field value of the studied site. The peaks of the filter are used to outline the body edges (Nasuti et al., 2019).
The EHGA is another normalized detector that uses the peak locations to highlight the edges of the magnetic structures. The detector is based on the horizontal gradient derivatives, which is expressed as (Pham et al., 2022a):
where p ≥ 2 (Pham et al., 2022a, c). The maximum EHGA locations respond to the geological boundaries.
3.2.3 Depth determination
The AS method (Salem and Ravat, 2003) uses the total gradient and its enhanced version to process gridded data. Salem and Ravat (2003) showed that the top depth
of a contact can be computed as:
where AS is the total gradient that is expressed as (Nabighian, 1972; Roest et al., 1992):
and EAS is the second total gradient, and is written as (Hsu et al., 1996):
4 Results and discussion
Since the global model EMAG2v3 provides magnetic anomalies at an altitude of 4 km above the geoid, the magnetic map (Fig. 2) is smooth. To generate a higher resolution magnetic map for the west central Arabian Shield, the downward continuation method of Tran and Nguyen (2020) has been applied to magnetic data in Fig. 2. The downward continued magnetic map of the study area is displayed in Fig. 3. It is observed from Fig. 3 that the downward continuation is stable, and its result fits well with TMI data. The downward continued magnetic map amplifies the data range (Fig. 3). As it can be seen, the small amplitude anomalies are shown more clearly in the downward continuation map (Fig. 3).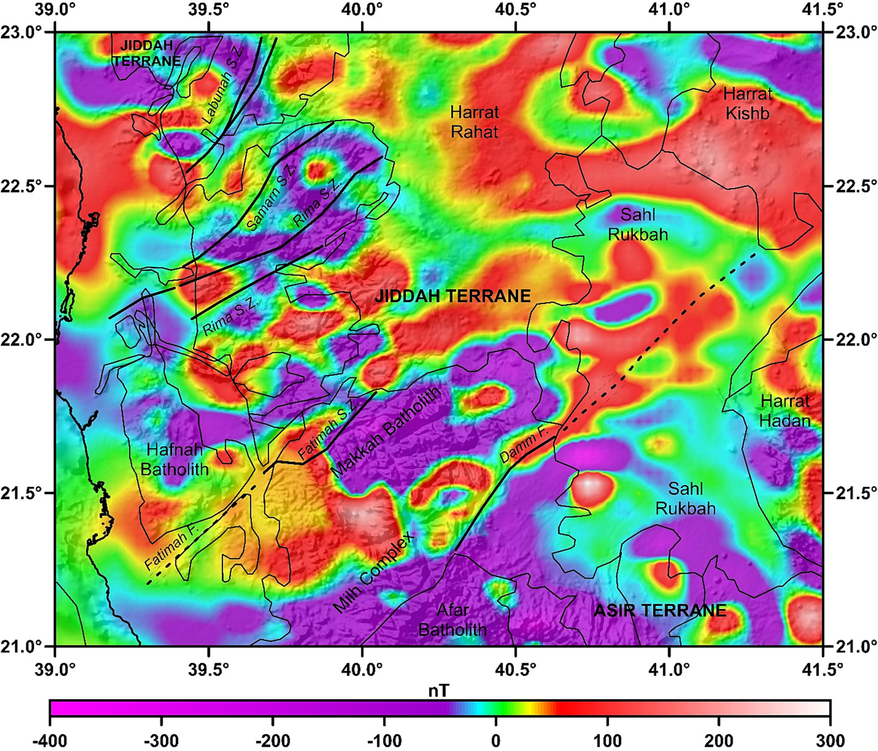
4 km downward continued magnetic anomaly map of the study region. The thin lines are the boundaries of major geological provinces, dark black colored lines are the major faults and the discontinuous lines are the major shear zones.
The magnetic inclination and declination of the west central Arabian Shield are 32.67° and 3.64° respectively. These values are obtained from IGRF using center coordinates of the area. The downward continued data were gotten from the RTP (reduction to pole) map before applying the interpretation techniques since the TMI anomalies are not located exactly over the magnetic structures, which could cause misinterpretation. Using this RTP technique, the anomalous field is symmetric above the centers of the source bodies. Fig. 4 displays RTP magnetic map of the west central Arabian Shield. The result is stable without linear artifacts (Fig. 4), thus, the RTP data can be used to extract the magnetic structures of the area.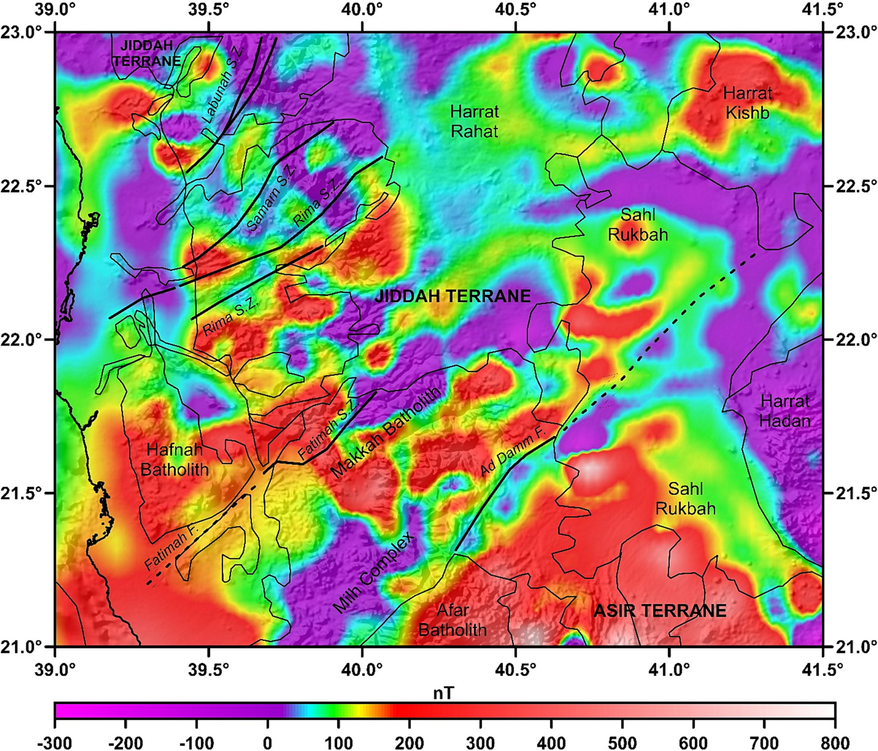
Magnetic anomaly map of the study region reduced to pole which is described in Fig. 3. The thin lines are the boundaries of major geological provinces, dark black colored lines are the major faults and the discontinuous lines are the major shear zones.
Fig. 5 presents the results obtained from the TAHG of RTP magnetic anomalies in Fig. 4. The TAHG ranges from − π∕2 to + π∕2 (Fig. 5) where its peaks respond to magnetic structures. Since the TAHG is a normalization filter, it can detect all structural boundaries of strappingly and feebly magnetized bodies. As shown in Fig. 5, the method identified a variety of lineaments with the dominance of the NW-SE, NE–SW and ENE–WSW orientations. Although the method can detect all the edges with different amplitudes, it does not provide sharper anomalies over the source edges (Fig. 5). This limitation is also pointed out by some recent studies (Pham et al., 2020; Prasad et al., 2022b).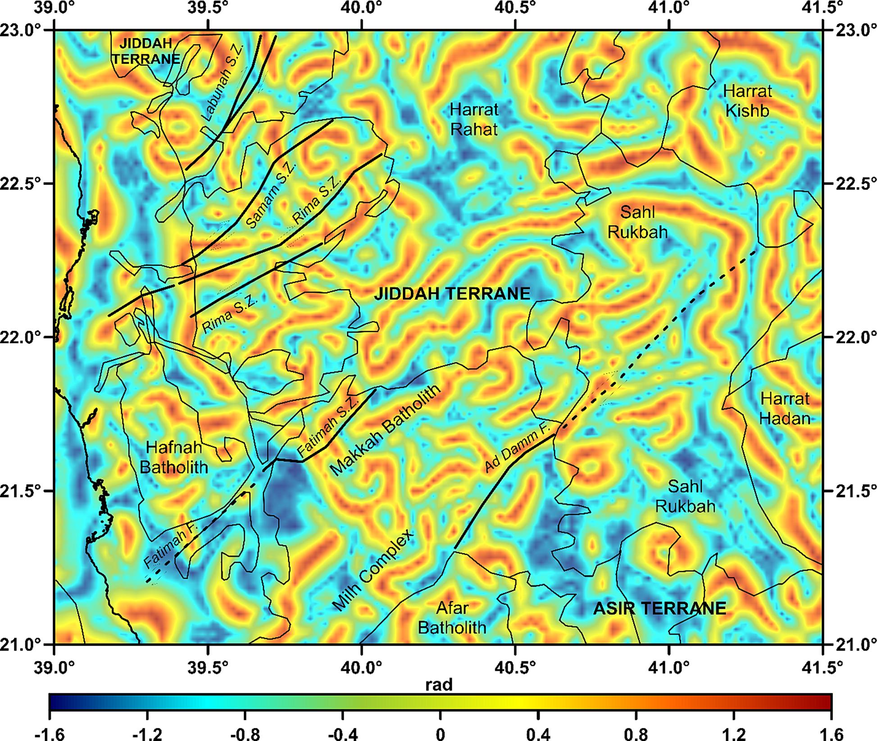
TAHG of reduced to pole magnetic anomaly which is described in Fig. 4. The thin lines are the boundaries of major geological provinces, dark black colored lines are the major faults and the discontinuous lines are the major shear zones.
Fig. 6 shows the results determined from applying the HGSTDR to RTP magnetic data in Fig. 4. The HGSTDR transform range is from 0 to 2.5 (Fig. 5) and location of ridge lines is used to delineate to magnetic edges. Since the HGSTDR is the horizontal gradient of a normalized filter (i.e., modified tilt angle), it can balance signals with different amplitudes. One can see that the HGSTDR shows sharper responses over structures than the TAHG. The edges in the HGSTDR map are clearly oriented in the NW-SE, NE–SW and ENE–WSW directions. Although the HGSTDR yields sharpened signals, it tends to link magnetization boundaries. As displayed in the model studies of Pham et al. (2021), the HGSTDR technique allows for accurate mapping of the body edges, but it may produce false information.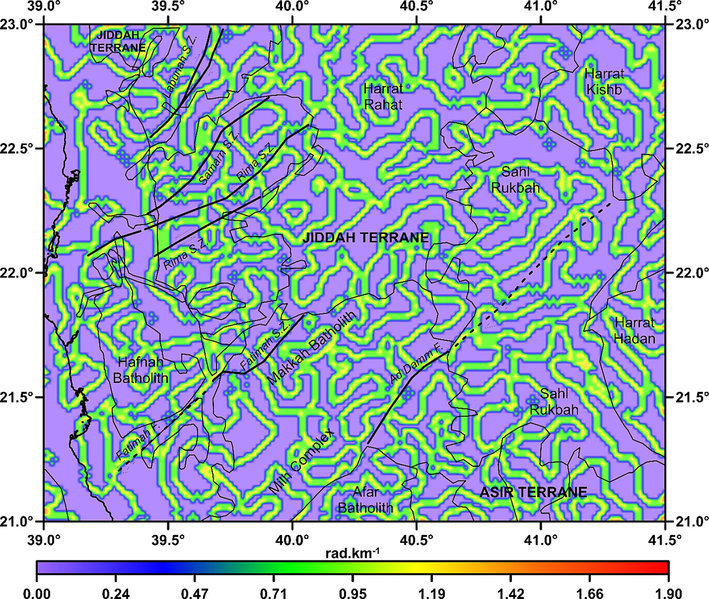
HGSTDR of reduced to pole magnetic anomaly which is described in Fig. 4. The thin lines are the boundaries of major geological provinces, dark black colored lines are the major faults and the discontinuous lines are the major shear zones.
The EHGA technique was applied to RTP magnetic anomalies in Fig. 4 to determine the edges of the causative bodies. Fig. 7 shows the results of the EHGA that ranges from − π∕2 to + π∕2. The maxima in the EHGA map can detect the edges which are approximately coincident with faults or any boundary bounding two compartments of different magnetizations. High anomalous zones indicate existence of the magnetic lineaments in the NW-SE, NE–SW and ENE–WSW directions. By comparing the outputs, it is observed that the shapes of the EHGA anomalies are very close to those from the TAHG technique. However, the EHGA technique has been able to bring a clearer depiction of structural edges and lithological contacts in the west central Arabian Shield. The EHGA map presents sharper signals than those from the TAHG map. Unlike the HGSTDR, the EHGA can delineate all structures without any secondary edges, as reported by Ekwok et al., (2022c) and Eldosouky et al., (2022d).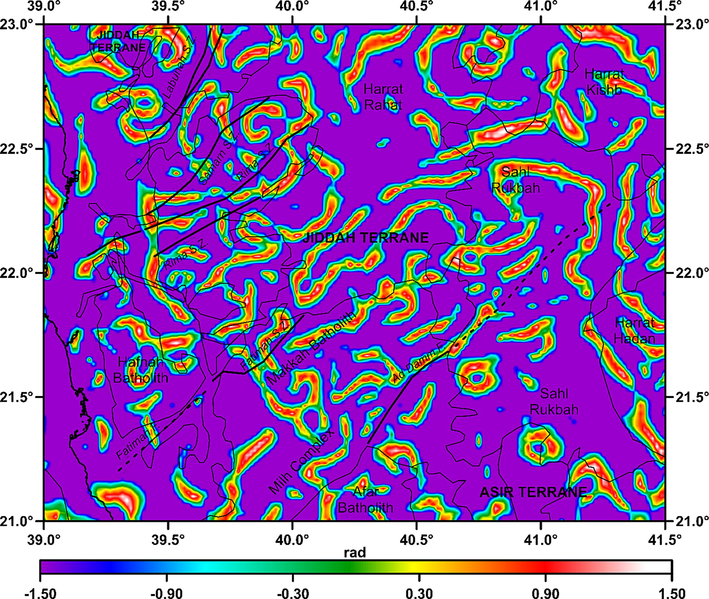
EHGA of reduced to pole magnetic anomaly which is described in Fig. 4. The thin lines are the boundaries of major geological provinces, dark black colored lines are the major faults and the discontinuous lines are the major shear zones.
For further validation of the structures determined by the edge detectors, we applied the AS techniques to RTP magnetic data in Fig. 4 to better describe magnetic structures and identify their depths. In this technique, we only showed the solution over the peaks of the total gradient, which were estimated by the technique of Blakely and Simpson (1986). Fig. 8 displays the source depths from the AS method, while Fig. 9 presents the histogram of these estimates. We can see from these figures, the depths of most of magnetic sources range from 3 to 5.5 km with a mean depth of 4.3 km.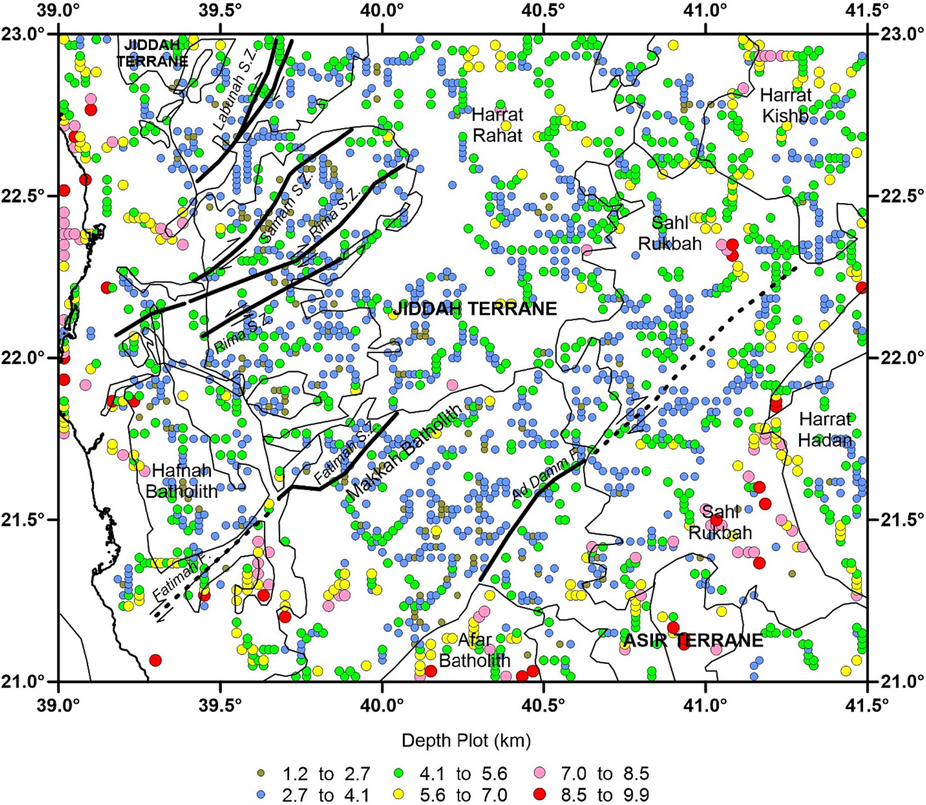
AS depth of reduced to pole magnetic anomaly which is described in Fig. 4. The thin lines are the boundaries of major geological provinces, dark black colored lines are the major faults and the discontinuous lines are the major shear zones.
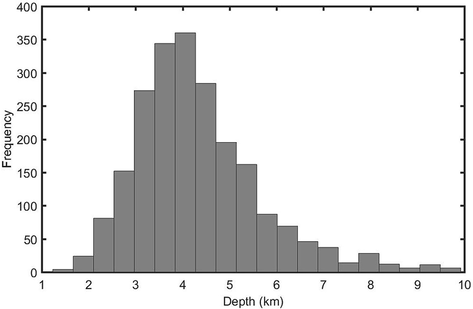
Histogram of the depth solutions.
Since the EHGA filter can delineate all the magnetic sources with less ambiguity, it is recommended for geologic structural mapping. The lineaments in the west central Arabian Shield were extracted from the EHGA map are displayed in Fig. 10a. For a comparison, Fig. 10a also presents the depth estimates superimposed on the EHGA lineaments. It can be seen that the determined magnetic edges match with many AS solutions (Fig. 10a). Fig. 10b shows the rose diagram of the lineaments from magnetic interpretation. We can see that a range of lineaments was detected in Fig. 10a with the NW-SE, NE–SW and ENE–WSW orientations predominating (Fig. 10b). One can see that the EHGA method clearly enhanced the magnetization signatures that are not noticeably seen from the magnetic maps in Figs. 2, 3 and 4.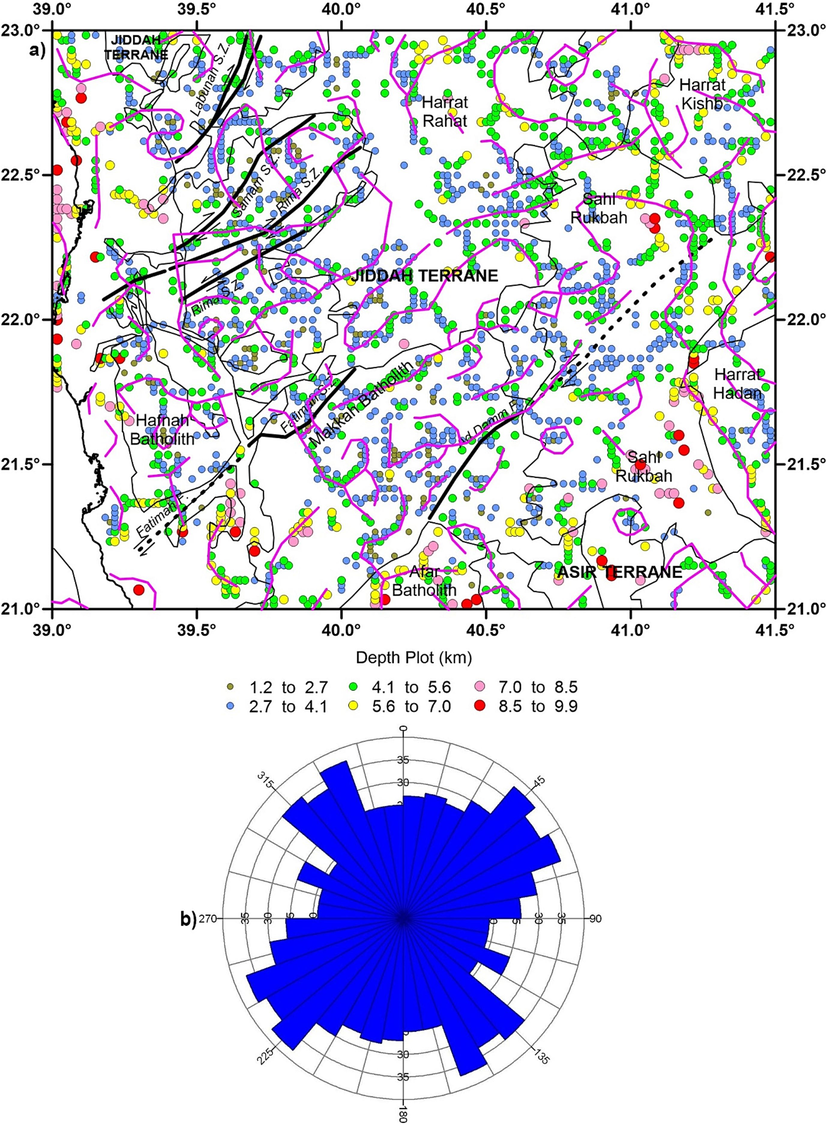
(a) Source depth and lineaments (pink lines) of the study area. (b) Rose diagram of magnetic lineaments. The thin black lines are the boundaries of major geological provinces, dark black colored lines are the major faults and the discontinuous lines are the major shear zones.
From tectonic standpoint, the study area is a part of one of the Earth's important megastructures (Robertson, 2004; Eldosouky et al., 2021). Therefore, the delineated edges (Figs. 7 and 10a) were investigated to reveal detailed structural and geophysical maps of the west central Arabian Shield. Close analysis of the generated rose diagram and structural maps indicate that the region is affected by several structural trends that have NW-SE, NE-SW and ENE-WSW orientations. The main NW-SE structural trend is linked to the direction of the Najd-Fault-Sysytem in the Arabian Shield (Dixon et al., 1987; Eldosouky et al., 2021, 2022b; Melouah et al., 2023). This NW-SE trend signifies that pre-Red Sea main fault systems had a powerful effect on the rifting-mechanism that dominates and manages the present deformation (Dixon et al., 1987; Richter et al., 1991). The major NE-SW trend of the west central Arabain Shield is associated with the Samran-fold belt which suggests to have originated in the late-Proterozoic (Camp and Roobol, 1991a, b). The ENE-WSW is of Cretaceous age and is one of the dominant trends affecting the study area. The present findings agree with Eldosouky et al. (2021) but in our present study, it can be mapped giving a more reliable interpretation and presenting the dominant structures in detail. These results could be useful for future investigations in the west central Arabian Shield.
5 Conclusions
Magnetic data from the MAG2V3 model of the west central Arabian Shield have been enhanced using a stable downward continuation technique. Advanced methods including the TAHG, HGSTDR, EHGA and AS have been used to interpret this downward continued magnetic dataset. The obtained results provided a range of lineaments with the NW-SE, NE-SW, and ENE-WSW-oriented trends predominating. The findings also showed that most of depths of magnetic sources range from 3 to 5.5 km with a mean depth of 4.3 km. With the use of these findings, we were able to differentiate the anomalies from geologic structures with varying magnetizations, and generate a new structural map for the studied region. The present findings could be useful for future investigations in the study area.
Acknowledgments
The authors extend their appreciation to the Deputyship for Research and Innovation, “Ministry of Education” in Saudi Arabia for funding this research through project no. (IFKSUOR3-192-6). KNDP thanks the Director, CSIR-NGRI, for his encouragement and permission to submit this work (NGRI/Lib/2023/ Pub-96).
Disclosure statement
No potential competing interest was reported by the authors.
Declaration of Competing Interest
The authors declare that they have no known competing financial interests or personal relationships that could have appeared to influence the work reported in this paper.
References
- Exploratory Mapping of the Geothermal Anomalies in the Neoproterozoic Arabian Shield, Saudi Arabia. Using Magnetic Data. Minerals. 2023;13:694.
- [Google Scholar]
- The crustal structure of the western Arabian Platform from the spectral analysis of long-period P-wave amplitude ratios. Tectonophysics. 1998;290:271-283.
- [Google Scholar]
- The crustal and upper mantle structure of the interior Arabian platform. Geophys J Int. 1999;136:421-430.
- [Google Scholar]
- Structural mapping from high resolution aeromagnetic data in west central Arabian Shield, Saudi Arabia using normalized derivatives. Arab J Geosci. 2008;1:129-136.
- [Google Scholar]
- Approximating edges of source bodies from magnetic or gravity anomalies. Geophysics. 1986;51(7):1494-1498.
- [Google Scholar]
- Geologic map of the Cenozoic lava field of Harrat Rahat. Ministry of Petroleum and Mineral Resources. Map GM-123, Scale. 1991;1:250,000.
- [Google Scholar]
- Edge enhancement of potential-field data using normalized statistics. Geophysics. 2008;73(3):H1-H4.
- [Google Scholar]
- Cordell, L., 1979. Gravimetric expression of graben faulting in Santa Fe Country and the Espanola Basin. 30th Field conference New Mexico. New Mexico Geological Society Guidebook:59–64.
- Control of Red Sea rift geometry by Precambrian structures. Tectonics. 1987;6:551-571.
- [Google Scholar]
- Relationship between seismicity and active faults in Thanh Hoa province detected by local seismic network. Vietnam J Earth Sci.. 2021;43(2):199-219.
- [Google Scholar]
- A geophysical approach to the igneous rocks in the Biga Peninsula (NW Turkey) based on airborne magnetic anomalies: Geological implications. Geodinamica Acta. 2012;25:267-285.
- [Google Scholar]
- On the effectiveness of directional derivative based filters on gravity anomalies for source edge approximation: synthetic simulations and a case study from the Aegean graben system (western Anatolia, Turkey) J Geophys Eng. 2013;10(3):035005
- [Google Scholar]
- Interpretation of gravity anomalies to delineate some structural features of Biga and Gelibolu peninsulas, and their surroundings (north-west Turkey) Geodinam Acta. 2015;27(4):300-319.
- [Google Scholar]
- Application of High-Precision Filters on Airborne Magnetic Data: A Case Study of the Ogoja Region. Southeast Nigeria. Minerals. 2022;12(10):1227.
- [Google Scholar]
- Application of the enhanced horizontal gradient amplitude (EHGA) filter in mapping of geological structures involving magnetic data in southeast Nigeria. Journal of King Saud University-Science. 2022;34(8):102288
- [Google Scholar]
- Application of the enhanced horizontal gradient amplitude (EHGA) filter in mapping of geological structures involving magnetic data in Southeast Nigeria. J. King Saud Univ.-Sci.. 2022;34:102288
- [Google Scholar]
- Eldosouky, A.M., Pham, L.T., El-Qassas, R.A.Y., Hamimi, Z., Oksum, E., 2021. Lithospheric Structure of the Arabian–Nubian Shield Using Satellite Potential Field Data. In: Hamimi Z., Fowler AR., Liégeois JP., Collins A., Abdelsalam M.G., Abd EI-Wahed M. (Eds.), The Geology of the Arabian-Nubian Shield. Regional Geology Reviews. Springer, Cham.
- Structural interpretation of potential field data using the enhancement techniques: a case study. Geocarto Int. 2022;37(27):16900-16925.
- [CrossRef] [Google Scholar]
- Mapping Main Structures and Related Mineralization of the Arabian Shield (Saudi Arabia) Using Sharp Edge Detector of Transformed Gravity Data. Minerals. 2022;12:71.
- [Google Scholar]
- High precision structural mapping using edge flters of potential feld and remote sensing data: a case study from Wadi Umm Ghalqa area, South Eastern Desert. Egypt. Egypt J Remote Sens Space Sci. 2022;25(2):501-513.
- [Google Scholar]
- Delineation of structural lineaments of Southeast Nigeria using high resolution aeromagnetic data. Open Geosciences. 2022;14(1):331-340.
- [Google Scholar]
- Detection of potential fields source boundaries by enhanced horizontal derivative method. Geophys. Prospect.. 2001;49:40-58.
- [Google Scholar]
- A stable downward continuation by using the ISVD method. Geophys. J. Int.. 2002;151(1):146-156.
- [Google Scholar]
- Ferreira, F.J.F., de Souza, J., de B. e S. Bongiolo, A., de Castro, L.G., 2013. Enhancement of the total horizontal gradient of magnetic anomalies using the tilt angle. Geophysics 78 (3), J33–J41.
- Gravity and magnetic exploration, principles, practices and applications. Cambridge: Cambridge University Press; 2012.
- High- resolution detection of geologic boundaries from potential field anomalies: an enhanced analytic signal technique. Geophysics. 1996;61:1947-1957.
- [Google Scholar]
- A balanced edge detector for aeromagnetic data. Vietnam J Earth Sci. 2023;45(3):326-337.
- [Google Scholar]
- Contribution of advanced edge detection filters for the structural mapping of the Douala Sedimentary Basin along the Gulf of Guinea. Vietnam J Earth Sci. 2023;45(3):287-302.
- [Google Scholar]
- Magnetic Structure and its Tectonic Implication Around Longmenshan Fault Zone Revealed by EMAG2v3. Front. Earth Sci.. 2022;10:848824
- [Google Scholar]
- Lithospheric structural dynamics and geothermal modeling of the Western Arabian Shield. Sci Rep. 2023;13:11764.
- [Google Scholar]
- Derivation and Error Analysis of the Earth Magnetic Anomaly Grid at 2 arc min Resolution Version 3 (EMAG2v3) Geochemistry, Geophysics, Geosystems. 2017;18(12):4522-4537.
- [Google Scholar]
- Potential field tilt a new concept for location of potential field sources. J. Appl. Geophys.. 1994;32(2–3):213-217.
- [Google Scholar]
- Depth to the bottom of the magnetic layer, crustal thickness, and heat flow in Africa: Inferences from gravity and magnetic data. Journal of African Earth Sciences. 2021;179:104204
- [Google Scholar]
- Geologic map of the Makka quadrangle. Sheet 21 D, Ministry of Petroleum and Mineral resources. Map GM-107C, Scale. 1989;1:250,000.
- [Google Scholar]
- The analytical signal of two-dimensional magnetic bodies with polygonal cross-section, its properties and use for automated interpretation. Geophysics. 1972;37(3):780-786.
- [Google Scholar]
- The historical development of the magnetic method in exploration. Geophysics. 2005;70(6):33-61.
- [Google Scholar]
- Delineation of structural features over a part of the Bay of Bengal using total and balanced horizontal derivative techniques. Geocarto International. 2016;32(4):351-366.
- [Google Scholar]
- New insights into the structural and tectonic settings of the Bay of Bengal using high-resolution earth gravity model data. Acta Geophys. 2021;69:2011-2033.
- [Google Scholar]
- Comparative evaluation of five global gravity models over a part of the Bay of Bengal. Advances in Space Research. 2022;71(5):2416-2436.
- [Google Scholar]
- Accuracy assessment of various supervised machine learning algorithms in litho-facies classification from seismic data in the Penobscot field. Scotian Basin. Front. Earth Sci.. 2023;11:1150954.
- [Google Scholar]
- STDR: a novel approach for enhancing and edge detection of potential field data. Pure Appl. Geophys.. 2019;176(2):827-841.
- [Google Scholar]
- Estimation of radiogenic heat production of the Adamawa region in Cameroon, Central Africa: an insight from spectral analysis of EMAG2 data. Arab J Geosci. 2023;16:442.
- [Google Scholar]
- Seismic structure of the Arabian Shield lithosphere and RedSea margin. Margins Newsletter. 2006;17:13-15.
- [Google Scholar]
- REGCONT: A Matlab based program for stable downward continuation of geophysical potential fields using Tikhonov regularization. Comput. Geosci.. 2012;49(4):278-289.
- [Google Scholar]
- Edge enhancement of potential field data using the logistic function and the total horizontal gradient. Acta Geod. Geophys.. 2019;54(1):143-155.
- [Google Scholar]
- Enhancement of potential field source boundaries using an improved logistic filter. Pure Appl. Geophys.. 2020;177(11):5237-5249.
- [Google Scholar]
- Determination of subsurface lineaments in the Hoang Sa islands using enhanced methods of gravity total horizontal gradient. Vietnam J Earth Sci. 2022;44(3):395-409.
- [Google Scholar]
- A new high resolution filter for source edge detection of potential field data. Geocarto Int.. 2022;37(11):3051-3068.
- [Google Scholar]
- Analysis of gravity data for extracting structural features of the northern region of the Central Indian Ridge. Vietnam J Earth Sci. 2023;45(2):147-163.
- [Google Scholar]
- High precision subsurface structural mapping of the Trompsburg complex (South Africa) from gravity and magnetic data. Adv Space Res. 2023;71(5):2348-2356.
- [Google Scholar]
- A Novel Enhanced Total Gradient (ETG) for Interpretation of Magnetic Data. Minerals. 2022;12(11):1468.
- [Google Scholar]
- A novel filter “ImpTAHG” for edge detection and a case study from Cambay Rift Basin. India. Pure Appl Geophys. 2022;179(6–7):2351-2364.
- [Google Scholar]
- Crustal Structure Beneath the Arabian Shield Based on the Receiver Function Method. Geosciences. 2022;12:399.
- [Google Scholar]
- Geophysical observations offshore Saudi Arabia: seismic and magnetic measurements. Tectonophysics. 1991;198:297-310.
- [Google Scholar]
- Development of concepts concerning the genesis and emplacement of Tethyan ophiolites in the eastern Mediterranean and Oman regions. Tectonophysics. 2004;66:331-387.
- [Google Scholar]
- Magnetic interpretation using the 3-D analytic signal. Geophysics. 1992;57(1):116-125.
- [Google Scholar]
- Insights on the tectonic styles of the Red Sea rift using gravity and magnetic data. Marine and Petroleum Geology 2021105253
- [Google Scholar]
- New insights into the contribution of gravity data for mapping the lithospheric architecture. Journal of King Saud University - Science. 2021;33(3):101400
- [Google Scholar]
- Understanding the structural framework controlling the sedimentary basins from the integration of gravity and magnetic data: A case study from the east of the Qattara Depression area, Egypt, Journal of King Saud University –. Science. 2022;34(2):101808
- [Google Scholar]
- A combined analytic signal and Euler method (AN-EUL) for automatic interpretation of magnetic data. Geophysics. 2003;68(6):1952-1961.
- [Google Scholar]
- New insights of the crustal structure across Estonia using satellite potential fields derived from WGM-2012 gravity data and EMAG2v3 magnetic data. Tectonophysics. 2023;846:229656
- [Google Scholar]
- A novel method for computing the vertical gradients of the potential field: application to downward continuation. Geophys. J. Int.. 2020;220(2):1316-1329.
- [Google Scholar]
- Quaternary stratigraphy of southern Vietnam continental margin. Vietnam Journal of Earth Sciences. 2023
- [CrossRef] [Google Scholar]
- Magnetotellurics study of Atambua area, West Timor. Indonesia. Vietnam Journal of Earth Sciences. 2022;45(1):67-81.
- [Google Scholar]
- Xayavong, V., Vu Duc, M., Singsoupho, S., Nguyen Anh, D., K.N.D., P., Vu Minh, T., & Do Anh, C. 2023. Combination of 2D-Electrical Resistivity Imaging and Seismic Refraction Tomography methods for groundwater potential assessments: A case study of Khammouane province, Laos. Vietnam Journal of Earth Sciences 45(2), 238–250.
- The application of theta method to potential field gradient tensor data for edge detection of complex geological structures. Pure Appl Geophys.. 2019;176(11):4983-5001.
- [Google Scholar]
Appendix A
Supplementary data
Supplementary data to this article can be found online at https://doi.org/10.1016/j.jksus.2023.103039.
Appendix A
Supplementary data
The following are the Supplementary data to this article:


