

Structural and enhanced photoelectrochemical cell properties of α-hematite -molybdenum disulfide and polyhexylthiophene nanodiamond based nanocomposite prepared by sol-gel method
-
Received: ,
Accepted: ,
This article was originally published by Elsevier and was migrated to Scientific Scholar after the change of Publisher.
Peer review under responsibility of King Saud University.
Abstract
The α-Fe2O3-MoS2 nanocomposite materials were synthesized using sol-gel technique and investigated by using scanning electron microscopy (SEM), FTIR, X-ray diffraction, UV–vis and Raman analyses. In this study, we used the conducting polymer electrode named polyhexylthiophene (RRPHTh) with nanodiamond (ND) nanomaterials abbreviated as “RRPHTh + ND”. The photocurrent, “electrode” & the “electrolyte” interface of “α-Fe2O3-MoS2″ and ”RRPHTh + ND“ nanocomposite films were studied using the electrochemical method. The developed MoS2-α-Fe2O-RRPHTh + ND nanocomposite films showed ∼ 3 times higher current–density and energy conversion efficiency as compared to the parent “electrode” in an electrolyte of 1 M of NaOH in “photoelectrochemical (PEC) cell”. Furthermore, improved hydrogen release was observed for the Fe2O3-MoS2 and ”RRPHTh + ND“ nanomaterials-based electrodes when compared to aluminum doped Fe2O3, Fe2O3, and MoS2 doped-Fe2O3 films.
Keywords
Nanocomposite
Water splitting
α-Fe2O3
Photoelectrochemical

1 Introduction
The world's population is rapidly increasing, which raises the world's energy demands on a frequent basis. To date, world’s economy and modern-day life are highly dependent on fossil fuel reserves such as coal, gas, and oil. These are the main and primary world’s energy resources. A recent report showed that coal, oil, and natural gas fulfilled around ∼ 86 % of the total world’s energy requirement by sharing 27%, 34%, and 25% respectively (Azam et al., 2020; Zaman et al., 2020). However, it is the fact that these traditional energy sources are diminishing with a rapid pace. Therefore, to meet the energy demands of the globe, alternative and long-lasting energy resources need to be discovered to avoid energy crises. Another issue with these available conventional energy resources is their carbon emission that is toxic for eco-system. Renewable energy resources such as solar power, biomass-derived energy, hydropower, fuel cell technology, and tidal & wind power are the good sources of sustainable energy to fulfil fast-growing world’s energy demand. In addition, energy harvesting using smart materials is gaining popularity (Alzaid et al., 2021; Wheeler et al., 2012; Akram et al., 2018; Hussain et al., 2017). Therefore, to balance the real-time electricity supply, researchers are concentrating to investigate cost-effective, more efficient, and consistent energy-storage systems.
In this scenario, conversion of solar energy to electrical energy by utilizing the photoelectrochemical (PEC) cells (Wheeler et al., 2012) has attracted the recent research trends. These cells have various advantages like relatively cheaper thin film fabrication process, reduced absorption losses, and significant reduction in energy conversion efficiency as compared with the p-n junction-based solar cells (Ram et al., 2011; Li et al., 2011; Sivula et al., 2011; Ahn et al., 2015; Hiralal et al., 2011; Alrobei et al., 2017). Further, the sol–gel synthesis technique is a simple method for developing nanomaterials (Adil et al., 2021; Ansari et al., 2019; Ansari et al., 2021; Desai et al., 2020; Gherab et al., 2020; Shaik et al., 2019).
Tailoring the band gap of the photocatalytic materials made them suitable for use in photoelectrochemical (PEC) cell for water splitting applications (Wheeler et al., 2012; Li et al., 2011; Sivula et al., 2011; Ahn et al., 2015; Hiralal et al., 2011; Hisatomi et al., 2014). Different lower band gap semiconductors such as WO3, BiVO4, Ta3N5 and Fe2O3 are being used in PEC cell (Ahn et al., 2015). Improved water-to-hydrogen conversion efficiency has been achieved by using a relatively inexpensive, low bandgap, abundantly available, nontoxic in nature and high chemically stable material (α-Fe2O3) as an anode in the PEC cell (Ahn et al., 2015). Despite these several advantages, α-Fe2O3 has some serious shortcomings such as high resistivity, relatively shorter hole diffusion length and photoexcitation lifetime with poor oxygen evolution reaction kinetics (Tamirat et al., 2016). Modification with different metallic elements was found to be effective for the enhancement of water splitting and photo-conversion capability (Sartoretti et al., 2005; Kennedy et al., 1978; Shwarsctein et al., 2008; Shwarsctein et al., 2009; Alrobei et al., 2017; Hu et al., 2008; Saremi-Yarahmadi et al., 2009; Kay et al., 2006). It was found that zinc and aluminum doped α-Fe2O3 materials showed improved PEC properties (Alrobei et al., 2017).
Molybdenum disulfide (MoS2) is found to be one of the promising 2D- dichalcogenide material with a band gap value of 1.8–1.9 eV (Ahn et al., 2015). Stimulating photocatalytic activity was shown by MoS2 owing to its chemical composition and suitable for several applications in photocatalytic devices (Li et al., 2011; Xiang et al., 2012), phototransistors (Yin et al., 2011; Choi et al., 2012; Lee et al., 2012; Miao et al., 2015) and sensors (Ahn et al., 2015; He et al., 2012; Wu et al., 2012; Li et al., 2012). Furthermore, MoS2 showed a very vital role to transfer charge by recombination of electron-hole pairs that were created as a result of photo-energy and correlate the rate of charge transfer among surface and electrons generated in photo-conversion (Han et al., 2014).
Previously, MoS2-α-Fe2O3 was studied by using impedance and cyclic voltammetry measurements to explore the electrolyte interface, electrochemical electrode and photoelectrochemical properties. It was found that in the α-Fe2O3 nanomaterials, electron transport properties were facilitated by doping 0.1%, 0.2%, 0.5%, 1%, 2% and 5% MoS2 particles and attaining a homogenous structure. In addition, for photoelectrochemical applications, nano-hybrid RRPHTh along with another dopant (ZnO, TiO2, nanodiamond) were utilized by our group (Ram et al., 2011; Ram et al., 2016).
RRPHTh-nanodiamond electrode was investigated by Ram et al. and reported high photoelectrochemical conversion efficiency of the order of magnitude greater than TiO2-RRPHTh and ZnO-RRPHTh nanohybrid film (Ram et al., 2016). In the current work, “RRPHTh + ND” as a p-electrode and MoS2- α-Fe2O3 as a n-electrode in liquid and solid-based “photoelectrochemical cells” was investigated. In this regard, “RRPHTh + ND” based working electrode and MoS2-α-Fe2O3 based counter electrode were used to explore the photoelectrochemical properties. The chronoamperometric studies were done with visible light radiations, simulated for solar radiations as well as 60 W lamp to analyze and identify the photoelectrochemical properties of PEC cell.
2 Materials and Method
2.1 Materials
Iron chloride (FeCl3), sodium hydroxide (NaOH), aluminum chloride (AlCl3), MoS2, ammonium hydroxide (NH4OH) and poly(3-Hexylthiophene) (Sigma-Aldrich) were used as a starting material. The fluorine tin oxide (FTO-) coated glass having a resistance value of ∼ 10 Ω was used (Sigma-Aldrich).
2.2 Synthesis of Nanomaterials
Sol-gel method was utilized to synthesize the “α-Fe2O3” and “MoS2- α-Fe2O3”. By using 500 ml round bottom flasks, different FeCl3 (with AlCl3) concentrations were prepared. Then, in resulting solution, NaOH was mixed and stirred by using a magnet. The chemical reaction was carried out at 90–100 °C for 24hrs and then the solution was cooled. After that, this material was separated via centrifuge. The continuous cleaning was done by using water. The obtained material (MoS2-α-Fe2O3) dried in furnace for one hr at various temperatures; 25, 100, 200, 300, 400 and 500 °C. Subsequently, cooled material was stored in the bottle with tight lid for different characterizations.
2.3 Film formation
The different concentrations of MoS2-α-Fe2O3 were developed by blending it with “acetic acid” to achieve homogenous mixture for film casting. Different MoS2-α-Fe2O3 compositions with 0.1%, 0.2%, 0.5%, 1%, 2% and 5% were grinded and then mixed with 10 ml of acetic acid and left for 10 hrs. After that, the films were made by using this solution on silicon quartz and “fluorine tin oxide”. Synthesized films were then cured at various temperatures; ranging 300 to 500 °C for one hr. These films were cooled to 25 °C and utilized for SEM, X-ray diffraction (XRD), UV–vis and cyclic voltammetry measurements.
2.4 RRPHTh + ND/NaOH/Fe2O3-ND based photoelectrochemical cell
“50 mg” of RRPHTh was dissolved in “50 ml of chloroform” to make conducting polymer solution. Then, “50 mg” of ND was dissolved to the solution and stirred for 24 hrs (Ram et al., 2011). The “RRPHTh + ND” film was synthesized by using solution casting and “spin coating techniques” on silicon (FTO coated glass) substrates. Working electrode was made of silicon and FTO coated “RRPHTh + ND”. Reference electrode was made of Ag/AgCl. Counter electrode was made of MoS2-Fe2O3 in the photoelectrochemical cell.
The chronoamperometry and cyclic voltammetry measurement were made by using 0.1 M and 1 M NaOH concentration. The effect of MoS2 to α-Fe2O3 is schematically shown in Fig. 1.
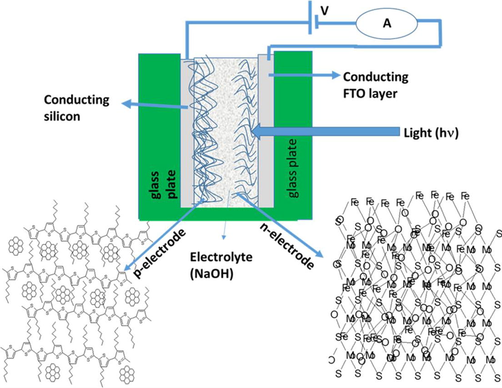
- The schematic diagram of hydrogen production by using current material.
3 Results and discussions
3.1 SEM
Field Emission Hitachi S800 SEM was utilized to study the “MoS2- α-Fe2O3, α-Fe2O”3 and “RRPHTh + ND” films microstructural properties. Electron dispersion spectroscopy (EDS) was used to investigate the elemental analysis of the prepared films. Fig. 2(a) displays the “SEM” micrographs of “α-Fe2O3” nanomaterials. A well dispersed spherical shaped particles with size ranging from “100–300 nm” were observed. An increase in the particle size was observed for “MoS2-α-Fe2O3” (see Fig. 2(b)). A relatively uniform, dense and sphere like particles were observed for the “α-Fe2O3” and “MoS2- α-Fe2O3” films. The ND hybrid RRPHTh conducting polymer showed the particle’s size ranging from “100 to 500 nm”. The well covered RRPHTh were relatively rough over ND particles forming nano hybrid structure.
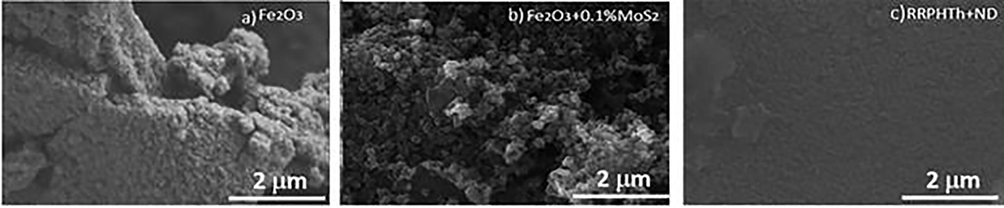
- Microstructural analysis of various studied materials.
3.2 FTIR
Fe-O widening and twisting vibration mode for α-Fe2O3 nanomaterial are linked to the infrared bands at 468 and 522 cm−1 as shown in Fig. 3(a). FTIR spectra of α-Fe2O3 + 0.1% MoS2 is shown in Fig. 3(b). The O–H stretching and in-plane bending vibrations of α-Fe2O3 nanomaterial (Sahoo et al., 2010) are linked to IR bands at 1389 and 1406 cm−1 as shown in Fig. 3(b). Furthermore, at 543 and 1629 cm−1, the IR bands named as OH− group that is in-plane bending vibrations and the presence of MoS2 (Sahoo et al., 2010) causes γas Mo-S vibration. However, out of plane twisting vibrations for γas Mo-O vibration caused the at bands at 638, 802, and 892, connected to OH− group. Stretching vibration of α-Fe2O3 + 0.1% MoS2 (Sahoo et al., 2010) is shown by Fe-O existence. FTIR spectra of “RRPHTh + ND” is displayed in Fig. 3(c) present various bands. The feature band of nano-diamond are the bands at 1739 cm−1. The existence of functional group in the nano-diamond (Ram et al., 2011) causes the presence of 1687, 1129 and 630 cm−1 bands. Fig. 3(c) shows the RRPHTh characteristics peaks (413, 475, 514, 758, 800, 852, 1000, 1058, 1092, 1260, 1300, 1390, 1446, 1497, 1635, 1687, and 1820) that is in good agreement with previous work (Ram et al., 2011).
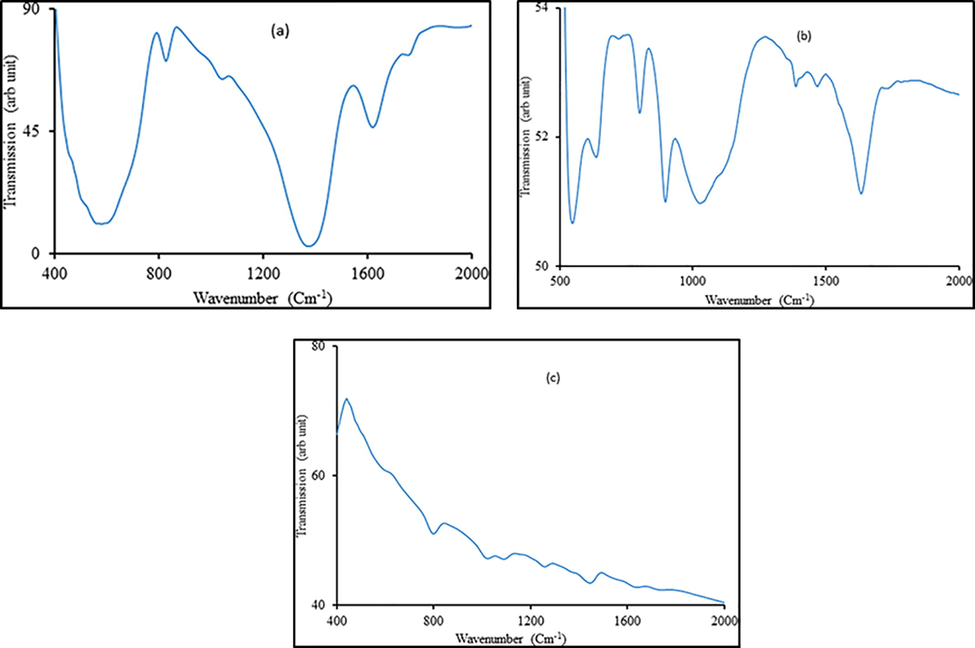
- FTIR pattern of various studied materials.
3.3 UV–Vis
Various nanomaterials absorption peaks like as; “α-Fe2O3”, α-Fe2O3 + 0.1% MoS2, and “RRPHTh + ND” were concluded by using an “UV–Vis spectrometer Jasco V-530”. “α-Fe2O3” film UV–vis absorption spectra is shown in Fig. 4(a). The absorption band at 550 nm is in good agreement with previous work of (Alrobei et al., 2017). Fig. 4(b) shows the characteristics absorption bands at 372, 383, 405, 443, 476, 613 nm of α-Fe2O3 + 0.1% MoS2. Fig. 4c shows the characteristics band at 411, 474, 502, 587, 696, 835 nm for “RRPHTh + ND” based film, similarly observed by (Alrobei et al., 2017). The band gap of MoS2 fluctuates between ∼ 1.2–1.9 eV, while the band gap of “α-Fe2O3” is ∼ 2.1 eV. So, the band gap of “MoS2-α-Fe2O3” is evaluated in the range of ∼ 1.94 to ∼ 2.4 eV, that fits in the visible light region, the samples conductivity is increased by MoS2 doping. Possibly photogenerated electron from the conduction band of MoS2 gets transmitted to the conduction band of hematite, while the holes from hematite are shifted to valence band of MoS2. This electron transmission may result in enhancement of photocatalytic activity of “MoS2-α-Fe2O3” composite. The phenomenon is schematically shown in Fig. 5.
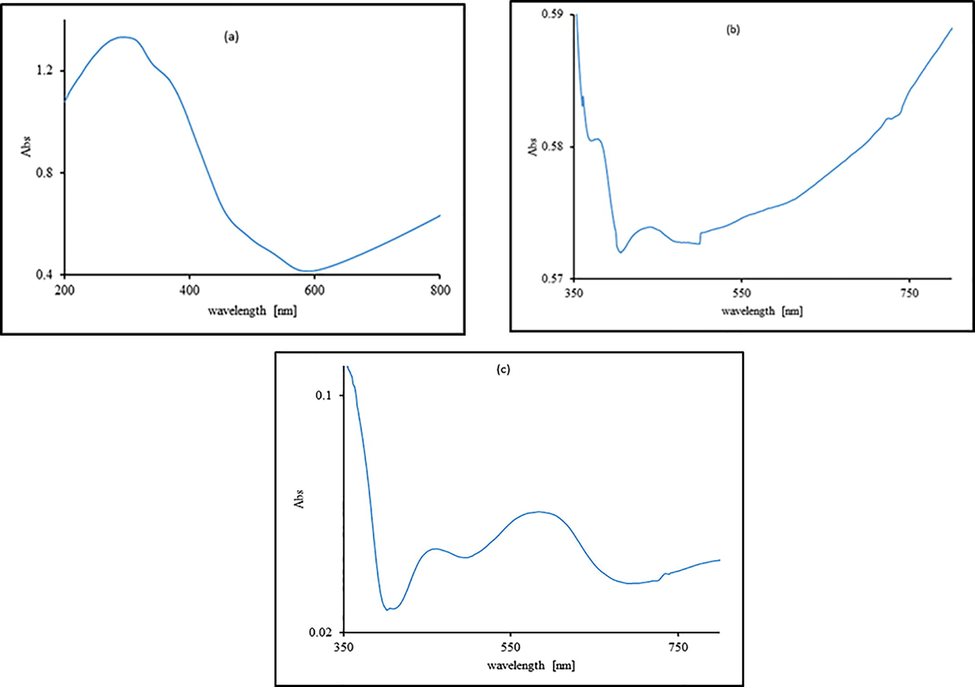
- UV–vis absorption pattern of various investigated materials.
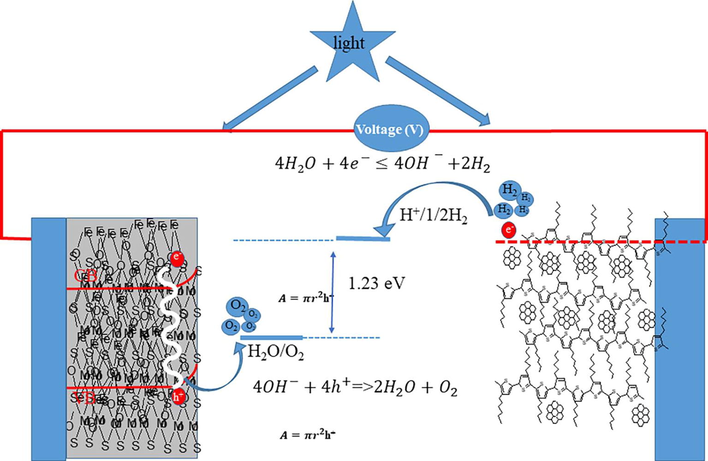
- Schematic diagram of water splitting process by using developed material.
3.4 Photo-electrochemical properties of p-n junction based on MoS2-α-Fe2O3 and RRPHTh + ND electrodes in photoelectrochemical cell
In the photoelectrochemical cells, the “MoS2-α-Fe2O3” as n-electrode and “RRPHTh + ND” as p-electrode in liquid (1 M NaOH, HCl) and solid (PVA-HCl or PVA-H3PO4 gel) electrolytes were analyzed. The chronoamperometry and cyclic voltammetry were examined on the p-n junction based “photoelectrochemical cell”. Fig. 5 indicates the water splitting process in “RRPHTh + ND” as p and n-type “MoS2-Fe2O3” in 1 M water-based electrolyte “photoelectrochemical cell” under a photoexcitation and under applied electrical potential. In the photoelectrochemical cell, the NaOH was used as electrolyte. 0.1 and 1 M concentration of NaOH-based “electrolytes” were used to make the cyclic voltammetry (CV) along with chronoamperometry measurement. In water, the MoS2 modified α-Fe2O3 has band gap fluctuating from 2.5 to ∼ 1.94 eV. At electrode of “RRPHTh + ND”, the hydrogen gas was created while oxygen (O2) was released at MoS2-α-Fe2O3 based electrode.
3.5 Cyclic voltammetry study of MoS2-α-Fe2O3 and “RRPHTh + ND” electrodes in photoelectrochemical cell
Fig. 6 shows the cyclic voltammetry (CV) pattern for “MoS2—Fe2O3” and “RRPHTh + ND” based electrodes in 0.1 M NaOH solution with and without light. The photocurrent value is nearly twice as high as it is without light, as demonstrated in the CV curves. Though, at light below 2 V, the photocurrent swings 30 times greater for n-type based electrodes containing 1 percent MoS2 —Fe2O3 in p-type “RRPHTh + ND” with 1 M NaOH “electrolyte”.
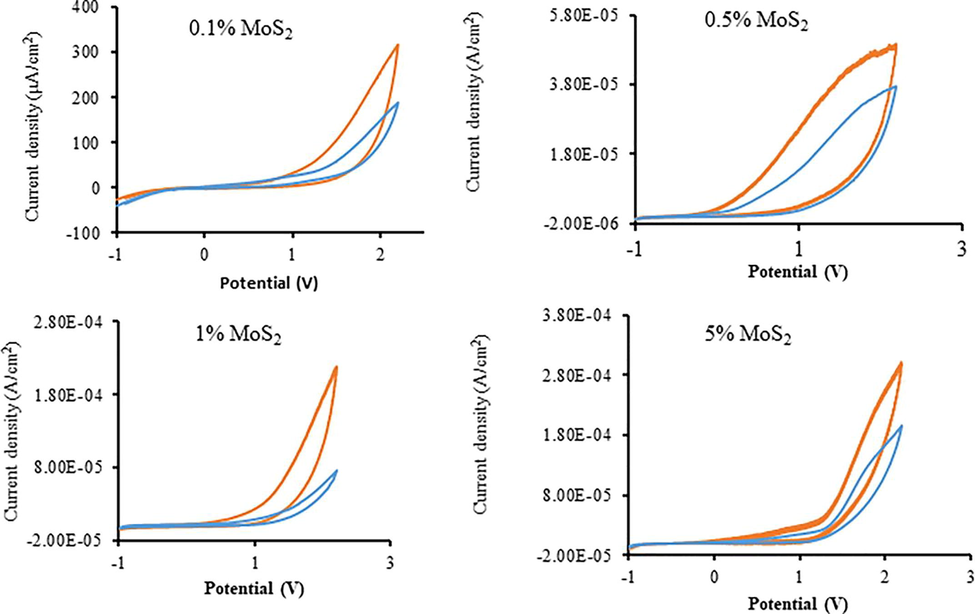
- Cyclic voltammetry findings of the developed material in PEC with and without light.
3.6 Chronoamperometry MoS2-α-Fe2O3 and “RRPHTh + ND” electrodes in photoelectrochemical cell
Fig. 7 shows the chronoamperometry results of “MoS2—Fe2O3” and “RRPHTh + ND” in 0.1 M NaOH solution. The instantaneous photoelectrochemical current in a device with 0.1 percent MoS2—Fe2O3 as an n-type electrode and “RRPHTh + ND” as a p-type electrode in a cell containing 0.1 M NaOH electrolyte was detected. Under the light, the photocurrent is visible. However, the transient current is immediately noticeable due to the combination of electrons and holes, and the photocurrent in 0.1 percent MoS2—Fe2O3 as n-type and “RRPHTh + ND” as p-type electrode-based “electrodes” in photoelectrochemical cells is diminished.
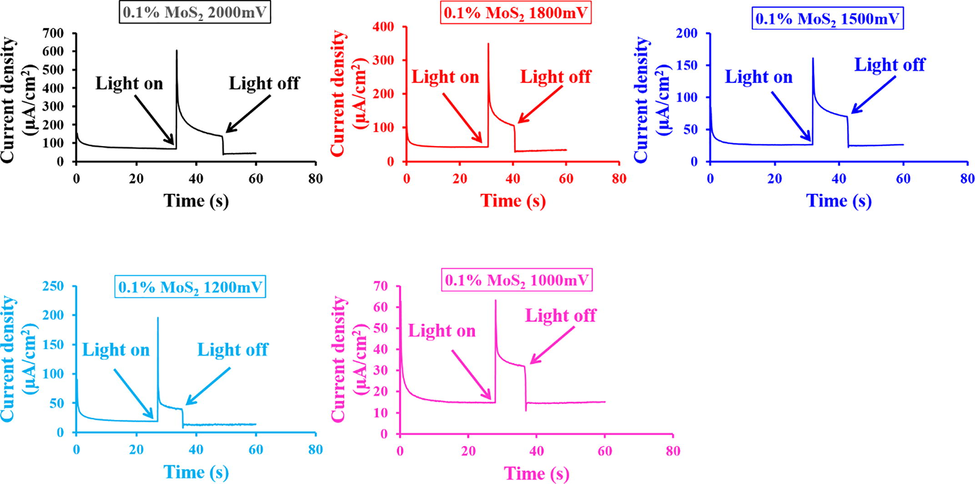
- Current transient findings of the developed material in PEC with and without light.
The chronoamperometry outcomes of various MoS2 ratios (0.1%, 0.2%, 1%, and 5% MoS2) in “α-Fe2O3” as n-type “electrode” and “RRPHTh + ND” as p-type “electrode” in a cell containing 0.1 M NaOH electrolyte are shown in Fig. 8. For 1% MoS2-α-Fe2O3 based n-type based “electrode” with “RRPHTh + ND” as p-type “electrode” in a cell containing 0.1 M NaOH electrolyte, the “current density” has been noticed to be greatest. For 1% MoS2-α-Fe2O3, the photocurrent became stable after 2–3 sec. However, a gradual decrease of photocurrent was observed for 0.1 and 0.2 % of MoS2-α-Fe2O3 nanocomposites. On the other hand, due to accumulation of MoS2 in α-Fe2O3 nanomaterial, 5% of MoS2 in α-Fe2O3 nanocomposites does not show higher photocurrent.
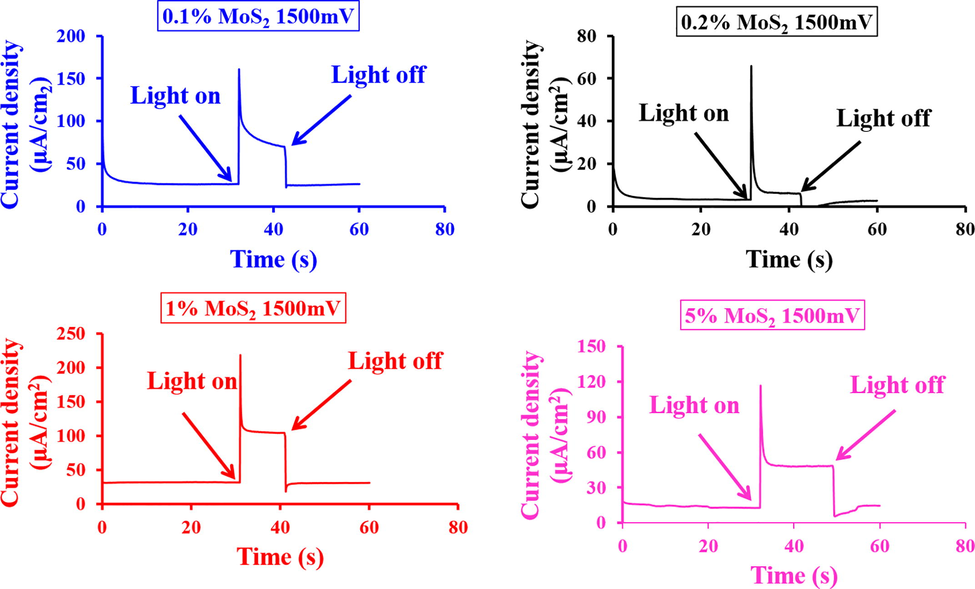
- Current transient findings of the developed material in PEC with light switch on and off with applied potential of 1500 mV.
The chronoamperometry findings of various MoS2 ratios (i.e., 0.1, 0.2, 1, and 5% of MoS2) in “α-Fe2O3” as n-type “electrode” and “RRPHTh + ND” as p-type “electrode” in a cell containing 0.1 M NaOH “electrolyte” at a potential of “∼2000 mV” is shown in Fig. 9. The observed current density for 0.1 and 1% MoS2 -α-Fe2O3 based n-type “electrode” was found to be highest. For 0.1% MoS2 in MoS2-α-Fe2O3 nanocomposite material, relatively larger current transient was observed. On the other hand, for 1% modified MoS2-α-Fe2O3 nanocomposite film, a stable photocurrent was observed after two to three (∼2–3) sec. The chronoamperometry findings expose that 1% modified MoS2-α-Fe2O3 nanocomposite is appropriate to get higher photocurrent density.
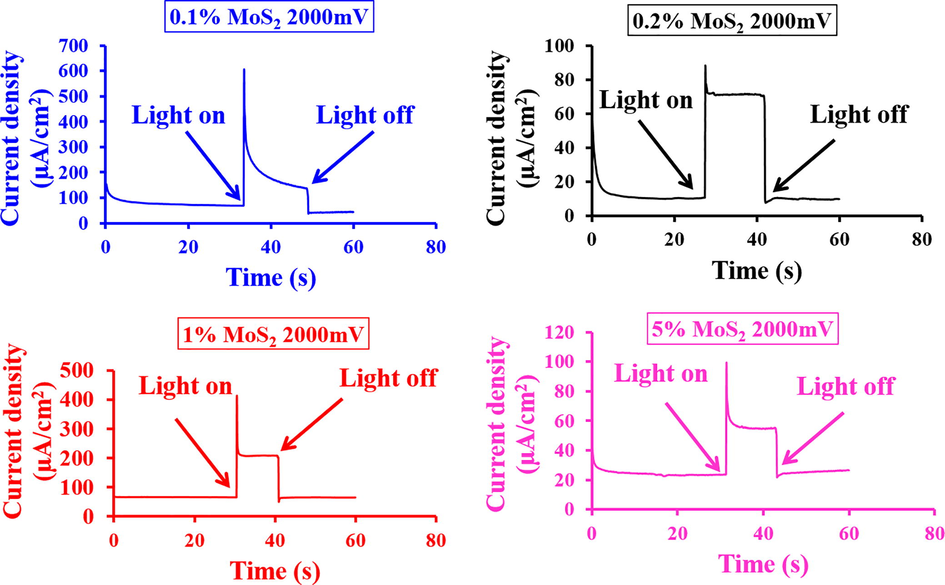
- Current-transient findings of the developed material in PEC with light switch on and off with applied potential of 2000 mV.
4 Conclusions
The MoS2 -α-Fe2O3 electrode was produced and the photoelectrochemical properties were calculated. Films made of Fe2O3 and MoS2-Fe2O3 exhibit a uniform and complex sphere of particles. 1 percent MoS2-Fe2O3 indicates stable photocurrent. In MoS2-Fe2O3 nanomaterials, the band at 53.23 has been linked to MoS2. The photoelectrochemical photocurrent has been observed to be proportioned to the applied potential ranging from 0 to ∼ 2 V. According to chronoamperometry findings, 1% MoS2 modified “α-Fe2O3 nanocomposites” can be appropriate to achieve higher photocurrent density. The p-n photoelectrochemical cell demonstrates a stable photoelectrochemical cell that allows for the removal of the photo-corrosion process, inhibits the outflow of solvent, and has relatively low absorption of “light” owing to the electrolyte thin layer.
Acknowledgment
This publication was supported by the Deanship of Scientific Research at Prince Sattam bin Abdulaziz University, Alkharj, Saudi Arabia, under the research project no. 2020/01/17063.
Declaration of Competing Interest
The authors declare that they have no known competing financial interests or personal relationships that could have appeared to influence the work reported in this paper.
References
- Dielectric Studies of Bi2MoO6/Graphene Oxide and La-Doped Bi2MoO6/Graphene Oxide Nanocomposites. Metals. 2021;11(4):559.
- [Google Scholar]
- MoSx supported hematite with enhanced photoelectrochemical performance. J. Mater. Chem. A. 2015;3(43):21444-21450.
- [Google Scholar]
- Temperature stable dielectric properties of lead-free BiFeO3–BaTiO3 modified with LiTaO3 ceramics. Mater. Lett.. 2018;217:16-19.
- [Google Scholar]
- Aluminum–α-hematite thin films for photoelectrochemical applications. Surf. Rev. Lett.. 2017;8:1950031.
- [Google Scholar]
- A New Insight in the Physical and Photoelectrochemical Properties of Molybdenum Disulfide Alpha-Hematite Nanocomposite Films. Am. J. Chem.. 2017;08(08):523-539.
- [Google Scholar]
- LiTaO3 assisted giant strain and thermally stable energy storage response for renewable energy storage applications. Ceram. Int.. 2021;47(11):15710-15721.
- [Google Scholar]
- Physico-chemical properties and catalytic activity of the sol-gel prepared Ce-ion doped LaMnO3 perovskites. Sci. Rep.. 2019;9:7747.
- [Google Scholar]
- Sol-Gel Synthesis of Dy-Substituted Ni0.4Cu0.2Zn0.4(Fe2-xDyx)O4 Nano Spinel Ferrites and Evaluation of Their Antibacterial, Antifungal, Antibiofilm and Anticancer Potentialities for Biomedical Application. Int. J. Nanomed.. 2021;16:5633-5650.
- [Google Scholar]
- Dinuclear uranium (VI) salen coordination compound: an efficient visible-light-active catalyst for selective reduction of CO2 to methanol. Dalton Trans.. 2020;49:17243-17251.
- [Google Scholar]
- High-detectivity multilayer MoS2 phototransistors with spectral response from ultraviolet to infrared. Adv. Mater.. 2012;24(43):5832-5836.
- [Google Scholar]
- Influence of Zn-Zr substitution on the crystal chemistry and magnetic properties of CoFe2O4 nanoparticles synthesized by sol-gel method. Phys. B Condens. Matter.. 2020;596:412400.
- [CrossRef] [Google Scholar]
- Fabrication and characterizations of Al nanoparticles doped ZnO nanostructures-based integrated electrochemical biosensor. J. Mater. Res. Technol.. 2020;9(1):857-867.
- [Google Scholar]
- One-Step Hydrothermal Synthesis of 2D Hexagonal Nanoplates of α-Fe2O3/Graphene Composites with Enhanced Photocatalytic Activity. Adv. Funct. Mater.. 2014;24(36):5719-5727.
- [Google Scholar]
- Fabrication of Flexible MoS2 Thin-Film Transistor Arrays for Practical Gas-Sensing Applications. Small. 2012;8(19):2994-2999.
- [Google Scholar]
- Nanostructured hematite photoelectrochemical electrodes prepared by the low temperature thermal oxidation of iron. Sol. Energ. Mat. Sol. C.. 2011;95(7):1819-1825.
- [Google Scholar]
- Recent advances in semiconductors for photocatalytic and photoelectrochemical water splitting. Chem. Soc. Rev.. 2014;43(22):7520-7535.
- [Google Scholar]
- Pt-doped α-Fe2O3 thin films active for photoelectrochemical water splitting. Chem. Mater.. 2008;20(12):3803-3805.
- [Google Scholar]
- Phase structure and electromechanical behavior of Li, Nb co-doped 0.95 Bi0.5Na0.5TiO3 –0.05 BaZrO3 ceramics. 2017;43:S204-S208.
- [CrossRef]
- Photooxidation of water at α-Fe2O3 electrodes. J. Electrochem. Soc.. 1978;125:709-714.
- [Google Scholar]
- MoS2 nanosheet phototransistors with thickness-modulated optical energy gap. Nano Lett.. 2012;12(7):3695-3700.
- [Google Scholar]
- Fabrication of single-and multilayer MoS2 film-based field-effect transistors for sensing NO at room temperature. Small. 2012;8(1):63-67.
- [Google Scholar]
- MoS2 nanoparticles grown on graphene: an advanced catalyst for the hydrogen evolution reaction. J. Am. Chem. Soc.. 2011;133(19):7296-7299.
- [Google Scholar]
- Surface plasmon-enhanced photodetection in few layer MoS2 phototransistors with Au nanostructure arrays. Small. 2015;11(20):2392-2398.
- [Google Scholar]
- Novel nanohybrid structured regioregular polyhexylthiophene blend films for photoelectrochemical energy applications. J. Phys. Chem. C. 2011;115(44):21987-21995.
- [Google Scholar]
- Ram, M.K., Kumar, A., 2016. Nano-hybrid structured regioregular polyhexylthiophene (RRPHTh) blend films for production of photoelectrochemical energy. in: U.S. Patent (Ed.) U.S.
- Characterization of γ-and α-Fe2 O3 nano powders synthesized by emulsion precipitation-calcination route and rheological behaviour of α-Fe2 O3. Int. J. Eng. Sci. Technol.. 2010;2(8):118-126.
- [Google Scholar]
- Nanostructured α-Fe2O3 electrodes for solar driven water splitting: effect of doping agents on preparation and performance. The Journal of Physical Chemistry C.. 2009;113(12):4768-4778.
- [Google Scholar]
- Photoelectrochemical oxidation of water at transparent ferric oxide film electrodes. J. Phys. Chem. B. 2005;109(28):13685-13692.
- [Google Scholar]
- Solvothermal Preparation and Electrochemical Characterization of Cubic ZrO2 Nanoparticles/Highly Reduced Graphene (HRG) based Nanocomposites. Materials.. 2019;12(5):711.
- [Google Scholar]
- Electrodeposited aluminum-doped α-Fe2O3 photoelectrodes: experiment and theory. Chem. Mater.. 2010;22(2):510-517.
- [Google Scholar]
- Electrodeposition of α-Fe2O3 doped with Mo or Cr as photoanodes for photocatalytic water splitting. J. Phys. Chem. C. 2008;112(40):15900-15907.
- [Google Scholar]
- Solar water splitting: progress using hematite (α-Fe2O3) photoelectrodes. ChemSusChem. 2011;4(4):432-449.
- [Google Scholar]
- Using hematite for photoelectrochemical water splitting: a review of current progress and challenges. Nanoscale Horiz.. 2016;1(4):243-267.
- [Google Scholar]
- Nanostructured hematite: synthesis, characterization, charge carrier dynamics, and photoelectrochemical properties. Energy Environ. Sci.. 2012;5(5):6682.
- [CrossRef] [Google Scholar]
- Electrochemically reduced single-layer MoS2 nanosheets: Characterization, properties, and sensing applications. Small. 2012;8(14):2264-2270.
- [Google Scholar]
- Synergetic effect of MoS2 and graphene as cocatalysts for enhanced photocatalytic H2 production activity of TiO2 nanoparticles. J. Am. Chem. Soc.. 2012;134(15):6575-6578.
- [Google Scholar]
- Structural and Electrochemical Analysis of Decarburized Graphene Electrodes for Supercapacitor Applications. Crystals. 2020;10(11):1043.
- [CrossRef] [Google Scholar]


