

Translate this page into:
Structural analysis and basement topography of Gabal Shilman area, South Eastern Desert of Egypt, using aeromagnetic data
⁎Corresponding author. ahmed.eldosouky@sci.suezuni.edu.eg (Ahmed M. Eldosouky)
-
Received: ,
Accepted: ,
This article was originally published by Elsevier and was migrated to Scientific Scholar after the change of Publisher.
Peer review under responsibility of King Saud University.
Abstract
The existing work deals with the structural analysis and detecting basement depth of G. Shilman area, South Eastern Desert (SED), Egypt. This work includes interpreting aeromagnetic data to map out structures within the study area and determine the depth of the magnetic basement which can be an aide to advance exploratory study. The first vertical derivative (1st VD) enhanced the short-wavelength and high-frequency features of the data. The analytic signal (AS) and horizontal gradient magnitude (HGM) maps well the structures of G. Shilman area. Statistical analysis of the delineated structures indicated that the NW, N_S, NNE and NE are the main structural trends controlling the study area. This suggests that the area was dominated by various stress regimes. The source parameter imaging (SPI) method which acts strongly at all magnetic latitudes was applied to the data to map the basement topography of G. Shilman area. The basement depths vary from about 0.1 km to about 1.5 km at the deepest part of the study area. The depth examination indicates that the recent deposits are not thick and reflect the shallow nature of the basement in G. Shilman area. The results of our study gives more accurate interpretation for the structural regime of the study area and can be applied for alike areas.
Keywords
Aeromagnetic
First vertical derivative
AS
HGM
Spi

1 Introduction
Magnetic method considers one of the common beneficial accessible tools that assist in the identification of the surface and subsurface geology. The goal of the utilization of the aeromagnetic analysis is to help in explaining the problems of provincial geologic mapping and structure (Eldosouky, 2019; Sehsah et al., 2019; Eldosouky and Mohamed, 2021; Melouah and Pham, 2021), representation of buried contacts, position of the presumable fields of rock differentiation, mineralization (Eldosouky et al., 2017, 2020a, 2021; Ekwok et al., 2019) and density of sedimentary cover. The magnetic enhancement has an interest that it is a quick and adequate technique for investigating the subsurface geologic structure, geothermal potentials, crustal studies, and outlining the basement fractures (Ibraheem et al., 2018; Eldosouky et al., 2020b; Sehsah and Eldosouky, 2020; Pham et al., 2020, 2021; Melouah et al., 2021a,b).
Interpretation of magnetic data can be used to confirm the association between tectonics of and the structures within the sediments that overlying the basement. The linear features enhancement in potential field data is greatly helpful as it enables dykes, faults, and other features to be presented more obvious, thus assisting the geologic understanding process (Cooper, 2003).
In the present work, we deal with accurate mapping of geological structures and depth to basement rocks for more understanding of the structural framework of the study area. To achieve these objectives, we will apply 1st VD, AS, HGM, and SPI to RTP aeromagnetic data of G. Shilman area, SED, Egypt for well understanding of structural regimes and basement depth of the study area.
2 Geology of the study area
G. Shilman area situated to the southeast direction of Aswan in the south eastern desert (SED) of Egypt between latitudes of 22° 35′ 00″ and 22° 50′ 00″ N and longitudes of 33° 37′ 50″ and 33° 52′ 50″ E (Fig. 1). The Northern Sudan, Egyptian Eastern Desert (EED), and western part of Saudi Arabia have been collectively named the Arabian–Nubian Shield (ANS), which is distinguished by four principal rock associations: (i) an arc association; (ii) an ophiolite association; (iii) a gneiss association; and (iv) intrusions of granite (Abdel Rahman, 1995).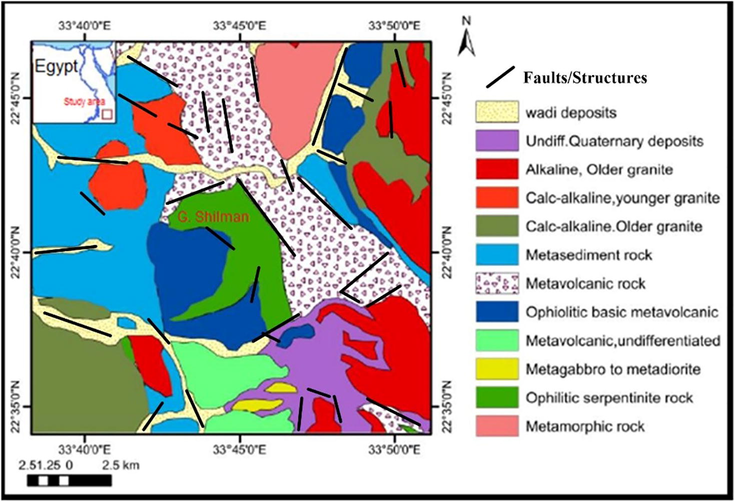
Location and geology of G. Shilman area.
The foremost rock types in G. Shilman area are represented by ophiolites, syn-orogenic granodiorite, metasediments including marble, and metavolcanics (Fig. 1). The northwestern extension of the Allaqi-Heiani belt is defined by the ophiolitic rocks (Kröner et al., 1987). They are intruded by granodiorite and overlain by the arc metavolcanic–metasediment sequence. The ophiolites include completely talc-carbonates, serpentinized peridotite, amphibolites and metagabbros (Abd El-Naby et al., 2000; Abdeen and Abdelghaffar, 2011). The most considerable serpentinite block occurs at G. Shilman producing a thrust nappe, which is also connected with a large metagabbro source. Older granites appear in the eastern part of G. Shilman area while younger granites occupy small portion at the northwestern part. Metavolcanic rocks are represented in the central part trending in the NW-SE direction. Metasediments cover the most northwestern part of the study area with small traces to the east of metavolcanics (Abd El-Naby et al., 2000; Abdeen and Abdelghaffar, 2011) as shown in Fig. 1.
Abd El-Naby et al. (2000) studied G. Shilman area and its surroundings and concluded that the study area revealed the remnants of back-arc oceanic crust, which causes a metamorphic sole underneath an allochthonous ultramafic source, which was overthrusted as a hot body.
3 Data and methodology
3.1 1st vertical derivative (1st VD)
1st VD filter preferentially amplifies short-wavelength components of the data at the expense of longer wavelengths (Foss, 2011). 1st VD filter is commonly implemented to gridded data using FFT (Fast Fourier Transform) technique. Several VD of the magnetic domain can be estimated by multiplying the amplitude spectra of the field by a factor of the form:
3.2 Analytic signal (AS)
AS is a modern gradient technique, which is linked to magnetic fields by the derivatives. Roest et al., (1992), explained that the amplitude of the AS can be determined from the three orthogonal derivatives of the magnetic data using the following expression:
3.3 Horizontal gradient magnitude (HGM)
Horizontal gradient magnitude (HGM) approach (Blakely and Simpson, 1986; Nasreddine and Haydar, 2001) is conceivably the most simplistic method of determining the locations of magnetic contact and depths because it does not require the consideration of vertical derivatives but only the consideration of the two first-order horizontal derivatives of the domain. Thus, for a grid of magnetic field value T (x, y), the HGM is expressed by:
3.4 Source parameter imaging (SPI) technique
Thurston and Smith (1997) developed the SPI method (SPI technique is called local wavenumber) because all the parameters that make up the body which include susceptibility contrast, dip, and depth are computed from the complex AS. Fairhead et al. (2004) linked the source depth to the SPI (k) of the magnetic field which can be obtained from the computed HGM and VD of the RTP grid. The SPI method acts well at all magnetic latitudes which gives it the advantages for G. Shilman area. The SPI is given by:
For the dipping contact, the K maxima are positioned directly overhead the contact edges and are independent of the remanent magnetization, strike, dip, declination and inclination of the magnetic data. The depth is determined at the edge of the source from the reciprocal of the SPI.
The methodology of our study is illustrated in Fig. 2.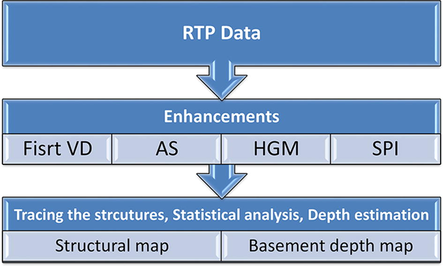
Flowchart of the applied methodology.
4 Results
In our existing work, aeromagnetic data are employed to analyze the structural trends and basement topography of G. Shilman area. To perform this target, the reduced to the pole (RTP) map (Aero-Service, 1984) was enhanced (Fig. 3). The RTP map (Fig. 3) shows magnetic highs and lows. There are many positive NW-trending magnetic anomalies in the central and western parts and NE-trending positive anomalies in the north-eastern part of the study area. The southern part of the area is characterized by negative anomalies trending in the NW and N-S directions.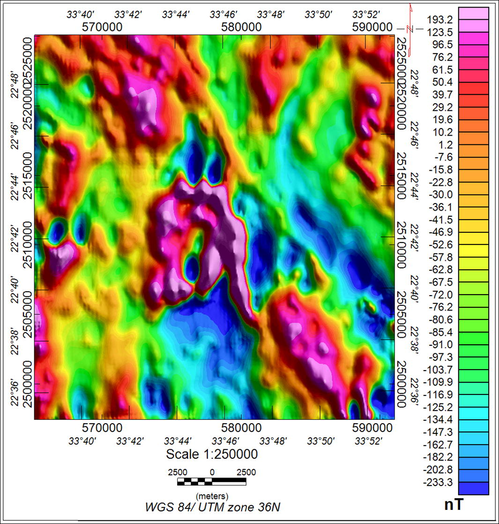
RTP map of G. Shilman area.
RTP map of the study area (Fig. 3) shows magnetic intensities (positive and negative anomalies) vary from −260 nT (Lows) to 250 (Highs) nT. It is clear to notice that the high magnetic values are related to ophiolitic serpentine and granites while low magnetic values are associated with metavolcanic and metasediment rocks.
The first step of the structural analysis is to identify the high- and low-frequency elements of the data that are related to surface/subsurface geology. To enhance local features for outlining the edges of anomalous sources from the data, 1st VD map (Fig. 4a) was computed from the RTP grid. The 1st VD map shows that most of the local anomalies were in the N-S, NNE and NW directions.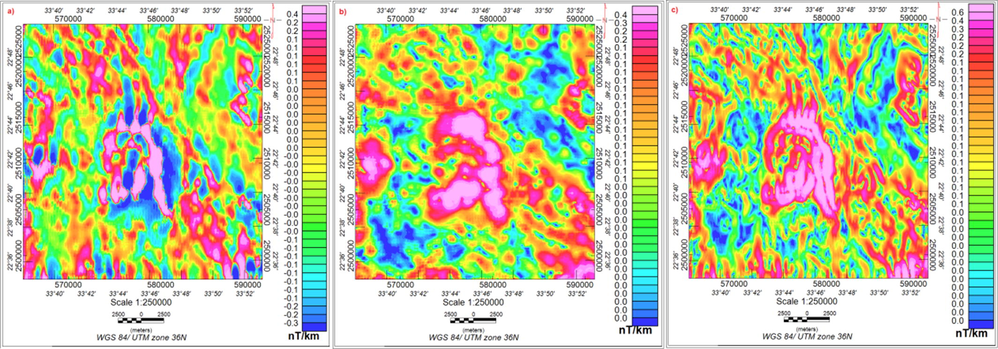
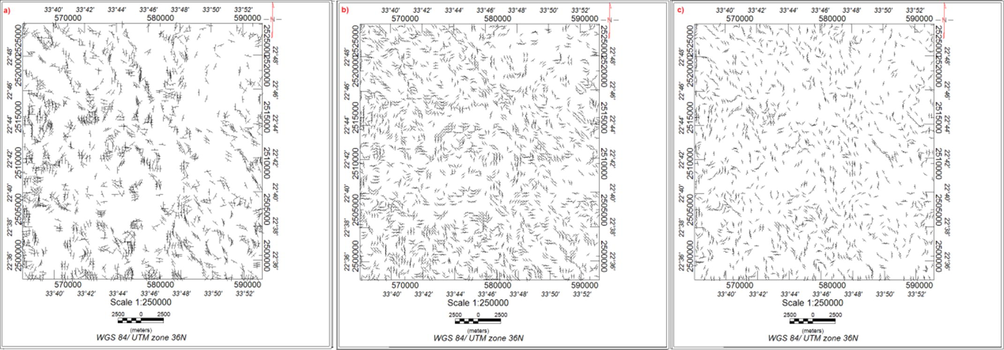
a) 1st vertical derivative; b) Analytic signal; and c) Horizontal gradient magnitude maps of G. Shilman area.
The AS map (Fig. 4b) emphasize the differences in the magnetization of the magnetic bodies in the study area and delineate discontinuities and anomalies texture. On the other hand, the HGM filter is applied to the RTP data to detect the contact locations of the bodies at depths as shown in Fig. 4c.
To distinguish the tectonic trends affecting G. Shilman area, the dominant magnetic structures on the 1st VD, AS and HGM maps (Fig. 4a, 4b and 4c) were traced and presented in the structural maps in figures (5a, 5b and 5c respectively) and statistically interpreted taking into record the azimuth and number of the structural trends in each 10° and displayed in the form of rose diagrams (Fig. 6a, 6b and 6c) respectively.
5 Discussion
Lineaments that describe fracture/fault zones of G. Shilman area (Fig. 5a and 6a) from 1st VD revealed that the N-S, NW and NNE directions are the main structural trends controlling the shallow and local sources while the NW, NE, N-S, and ENE directions are the dominant ones revealed from the AS maps (Fig. 5b and 6b) and HGM maps (Fig. 5c and 6c). This indicates that the structural regime affecting the study area causing the N-S direction is the most recent while the NW direction the predominant structural tectonic trend at G. Shilman area (Eldosouky and Elkhateeb, 2018).
According to Zoheir and Klemm (2007), Zoher et al. (2017) and Elkhateeb et al., 2021, the deformation history of the central part of the Allaqi-Heiani suture indicated that the is an intense crustal shortening took place throughout the collision of east and west Gondwana (640–550 Ma). As a result, the Allaqi-Heiani suture was deformed by the post-accretionary N–S trending Hamisana Zone and related NW–SE sinistral and NE–SW dextral transpressional faults, during the Late Pan-African Najd orogen (e.g., Abdeen and Abdelghaffar, 2011).
The SPI depth map of G. Shilman area (Fig. 7) derived from the RTP data (Fig. 3) shows depth ranges from 0.1 km to about 1.5 km. The light to deep blue colors with depth ranges from 0.1 to 0.271 km show regions of shallow lying magnetic bodies. Red to pink colors with depth ranges from 0.6 to 1.4 km show areas of thicker sediments or deep-lying magnetic sources. SPI map (Fig. 7) maps basement topography well in G. Shelman area.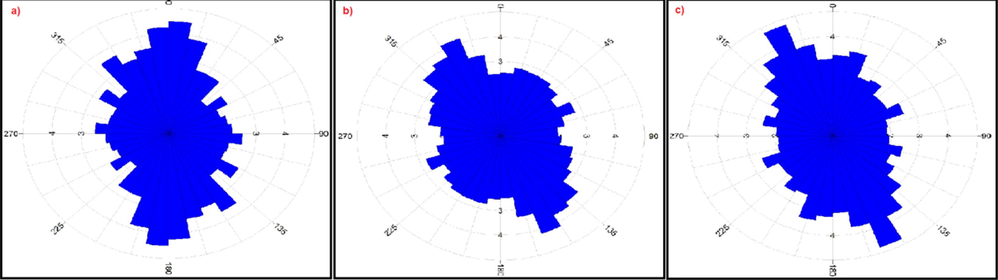
a) Lineament rose diagram of .1st VD map; b) Lineament rose diagram of .AS map; and c) Lineament rose diagram of .HGM map.
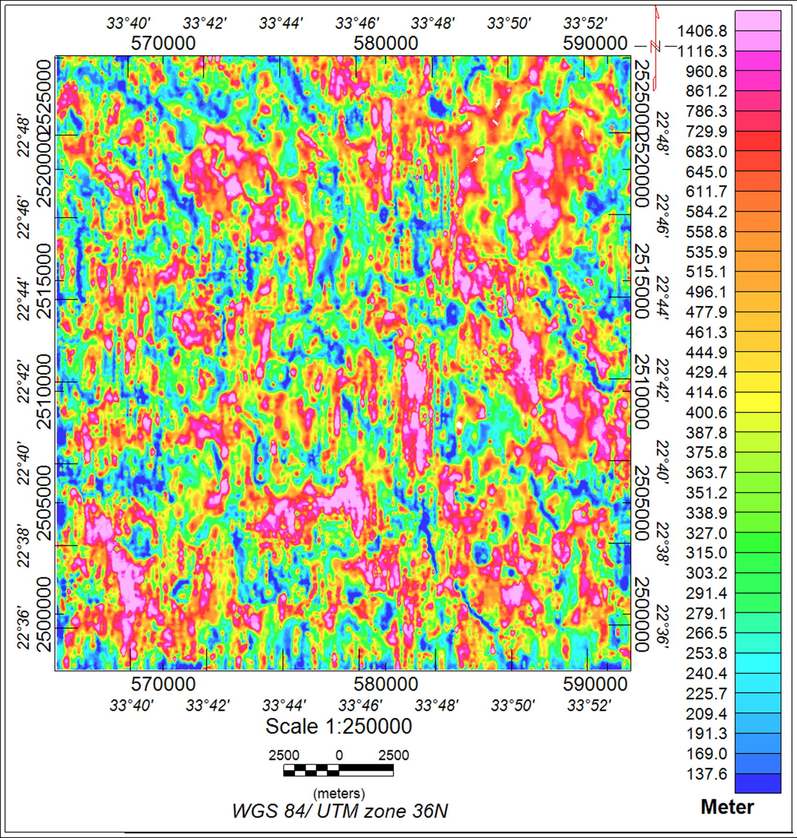
Source parameter imaging depth map of G. Shilman area.
6 Conclusion
The existing work deals with the analysis and interpretation of structural trends and mapping the basement topography of G. Shilman area, SED of Egypt, using aeromagnetic data. A variety of enhancement techniques were applied to RTP data of G. Shilman area. 1st vd, AS and HGM were applied to analyze the structural trends while SPI technique was applied to map basement topography.
1st VD map of the study area outlined the structural features related to local sources (short-wavelength components) and illustrated that the N-S, NW and NNE directions were the most tectonic trends controlling the study area. Moreover, the 1st VD mapped well the edges of shallow sources. AS and HGM maps delineated the tectonic structural trends that controlling G. Shilman area. Structural and statistical analysis of these maps represented that the NW, NE, N-S and NNE directions were the most structural trends and the NW direction was predominant. Furthermore, HGM delineated edges of the magnetic sources more obviously than the edges which were represented by AS. The SPI depth map of the study area showed depths varied from 0.1 to about 1.5 km. The applied enhancement techniques in the present work can be employed in alike rugged areas in the Egyptian Eastern Desert and other similar parts of the world for the structural analysis and depth estimation purposes. The present study shows the role of magnetic data in accurate detection of structures and depth to the basement that can be applied for mapping the structures in different complicated areas around the world.
Acknowledgements
This research was supported by Researchers Supporting Project number (RSP-2021/249), King Saud University, Riyadh, Saudi Arabia.
Declaration of Competing Interest
The authors declare that they have no known competing financial interests or personal relationships that could have appeared to influence the work reported in this paper.
References
- Syn- and postaccretionary structures in the Neoproterozoic Central Allaqi-Heiani suture zone, Southeastern Egypt. Precambr. Res.. 2011;185(3-4):95-108.
- [Google Scholar]
- Evolution of the Pan-African Wadi Haimur metamorphic sole, Eastern Desert, Egypt. J. Metamorphic Geol.. 2000;18:639-651.
- [Google Scholar]
- Tectonic-magmatic stages of shield evolution: the Pan-African belt of northeastern Egypt. Tectonophysics. 1995;242:223-240.
- [Google Scholar]
- Aeroservice Co. (1984): Final operational report of airborne Magnetic /radiation Survey in the Eastern Desert, Egypt. Aeroservice for EGPC, Houston, Texas, April 1984. Six volumes. An internal report. No.3609.
- Blakely, R.J., and Simpson, R.W., (1986): Approximating edges of source bodies from magnetic and gravity anomalies. Geophysics 51 (7), 1494–1498 (July).
- Enhancement and modeling of aeromagnetic data of some inland basins, southeastern Nigeria. J. Afr. Earth Sc.. 2019;155:43-53.
- [Google Scholar]
- Integration of remote sensing and aeromagnetic data for mapping structural features and hydrothermal alteration zones in Wadi Allaqi area, South Eastern Desert of Egypt. J. Afr. Earth Sci.. 2017;130:28-37.
- [Google Scholar]
- Texture analysis of aeromagnetic data for enhancing geologic features using co-occurrence matrices in Elallaqi area, South Eastern Desert of Egypt. NRIAG J. Astron. Geophys.. 2018;7(1):155-161.
- [Google Scholar]
- Aeromagnetic data for mapping geologic contacts at Samr El-Qaa area, North Eastern Desert. Egypt. Arab J Geosci. 2019;12:2.
- [CrossRef] [Google Scholar]
- Integrating aeromagnetic data and Landsat-8 imagery for detection of post-accretionary shear zones controlling hydrothermal alterations: The Allaqi-Heiani Suture zone, South Eastern Desert, Egypt. Adv. Space Res.. 2020;65(3):1008-1024.
- [Google Scholar]
- Enhancing linear features in aeromagnetic data using directional horizontal gradient at Wadi Haimur area, South Eastern Desert, Egypt. Carpathian J. Earth Environ. Sci.. 2020;15(2):323-326.
- [Google Scholar]
- Edge detection of aeromagnetic data as effective tools for structural imaging at Shilman area, South Eastern Desert. Egypt. Arab J Geosci. 2021;14:13.
- [CrossRef] [Google Scholar]
- Eldosouky, A.M., El-Qassas, R.A.Y., Pour, A.B., Mohamed, H., Sekandari, M. (2021). Integration of ASTER satellite imagery and 3D inversion of aeromagnetic data for deep mineral exploration. Adv. Space Res., Volume 68, Issue 9, Pages 3641-3662, ISSN 0273-1177, https://doi.org/10.1016/j.asr.2021.07.016.
- Probability of mineral occurrence in the Southeast of Aswan area, Egypt, from the analysis of aeromagnetic data. Arab J Geosci. 2021;14:1514.
- [CrossRef] [Google Scholar]
- Fairhaed, J. D., Green, C. M., Verduzco, B., and Mackenzie, C., (2004): A new set of magnetic field derivatives for mapping mineral prospects. 17th ASEG Geophysical Conference and Exhibition, Sydney, Australia, Expanded Abstract.
- Foss, C., (2011): Magnetic data Enhancement and Depth Estimation. (H. Gupta, Ed.) Encyclopedia of Earth Sciences Series, 736-746.
- Structural interpretation of aeromagnetic data for the Wadi El Natrun area, northwestern desert, Egypt. J. Afr. Earth Sci.. 2018;139:14-25.
- [Google Scholar]
- Kröner, A., Greiling, R., Reischmann, T., Hussein, I. M., Stern, R. J., Kruger, J., Duur, S., and Zimmer, M., (1987): Pan-African Crustal Evolution in the Nubian segment of Northeast Africa. In: Kröner, A. (ed.). Proterozoic Lithosphere Evolution. Washington D.C., American Geophysical Union, 235-257.
- An improved ILTHG method for edge enhancement of geological structures: application to gravity data from the Oued Righ valley. J. Afr. Earth Sc.. 2021;177:104162.
- [CrossRef] [Google Scholar]
- Deep crustal architecture of the eastern limit of the West African Craton: Ougarta Range and Western Algerian Sahara. J. Afr. Earth Sc.. 2021;183:104321.
- [CrossRef] [Google Scholar]
- Crustal architecture, heat transfer modes and geothermal energy potentials of the Algerian Triassic provinces. Geothermics.. 2021;96:102211
- [CrossRef] [Google Scholar]
- Interpretation of magnetic anomalies using the horizontal gradient analytical signal. Ann. Geofis.. 2001;44:505-526.
- [Google Scholar]
- On the performance of phase-based filters for enhancing lateral boundaries of magnetic and gravity sources: a case study of the Seattle uplift. Arab. J. Geosci.. 2021;14(129)
- [CrossRef] [Google Scholar]
- Pham, L.T., Eldosouky, A.M., Melouah, O., Abdelrahman, K., Alzahrani, H., Oliveira, S.P., Andráš, P. (2021). Mapping subsurface structural lineaments using the edge filters of gravity data. Journal of King Saud University - Science, Volume 33, Issue 8, 101594, ISSN 1018-3647, https://doi.org/10.1016/j.jksus.2021.101594.
- Unpaired ophiolite belts in the Neoproterozoic Allaqi-Heiani Suture, the Arabian-Nubian Shield: Evidences from magnetic data. J. Afr. Earth Sc.. 2019;156(2019):26-34.
- [CrossRef] [Google Scholar]
- Neoproterozoic hybrid forearc – MOR ophiolite belts in the northern Arabian-Nubian Shield: no evidence for back-arc tectonic setting. Int. Geol. Rev. 2020
- [CrossRef] [Google Scholar]
- Automatic conversion of magnetic data to depth, dip, and susceptibility contrast using the SPI (TM) method. Geophysics. 1997;62(3):807-813.
- [Google Scholar]
- The tectono-metamorphic evolution of the central part of the Neoproterozoic Allaqi-Heiani suture, south Eastern Desert of Egypt. Gondwana Res.. 2007;12(3):289-304.
- [Google Scholar]
- Auriferous shear zones in the central Allaqi-Heiani belt: Orogenic gold in postaccretionary structures, SE Egypt. J. Afr. Earth Sci.. 2018;146:118-131.
- [CrossRef] [Google Scholar]
Appendix A
Supplementary data
Supplementary data to this article can be found online at https://doi.org/10.1016/j.jksus.2021.101764.
Appendix A
Supplementary data
The following are the Supplementary data to this article:


