

Translate this page into:
Stock structure delineation of Kawakawa Euthynnus affinis (Cantor, 1849) from Malaysian Borneo using multivariate morphometric analysis
⁎Corresponding author. darlinamdn@usm.my (Darlina Md. Naim)
-
Received: ,
Accepted: ,
This article was originally published by Elsevier and was migrated to Scientific Scholar after the change of Publisher.
Peer review under responsibility of King Saud University
Abstract
Euthynnus affinis, also known as Kawakawa, is a species of fish that is very significant to the fishing industry, particularly in the Indo-Pacific area. Regrettably, its stock structure and regional species’ management are poorly understood. This research aimed to employ a morphometric approach and determine if different stocks exist among 188 specimens of E. affinis obtained from three different areas: the Celebes Sea, the South China Sea, and the Sulu Sea, all surrounding Malaysian Borneo. Multivariate studies, including PCA (Principal Component Analysis) and DFA (Discriminant Function Analysis), were utilized to differentiate eight E. affinis populations based on 12 morphometric parameters. The findings divulged that E. affinis populations of Malaysian Borneo (Sabah and Sarawak) were relatively homogenous, as indicated by the DFA and the principal component’s scatterplot. Moreover, hierarchical cluster analysis focused on the Mahalanobis distances demonstrated that eight populations of E. affinis were grouped into three separate groups. The first group comprises Kota Kinabalu (Sabah), Mukah, Bintawa, and Pulau Bruit (Sarawak) populations. Euthynnus affinis from Lahad Datu and Kudat (Sabah) were clustered in the second group, while the third group consisted of Tawau and Sandakan (Sabah) populations. This study’s findings will give important preliminary data on E. affinis for effectively managing and protecting Malaysian Borneo’s regional waterways.
Keywords
DFA
Euthynnus affinis
Kawakawa
Morphometric
PCA

1 Introduction
The marine fisheries sector in Malaysia is expected to enter a new phase of growth in the country, which will further make Malaysia a leading fishing hub in Southeast Asia (Imtiaz et al., 2016). This has also been supported by Malaysia's geographical position, surrounded by several important oceans, making it a country rich in marine resources. The marine fisheries sector has contributed approximately 1.7 million metric tons of seafood worth about RM 15 billion to the Malaysian economy (Annual Fisheries Statistics, 2021). This industry also provides several job possibilities and provides worldwide exports as well as protein supplies to Malaysians and other regional countries (Bakar et al., 2018). Malaysia, a maritime nation, is encompassed by four seas: the Malacca Strait, the South China Sea, the Andaman Sea, and the Sulu Sea. The fishing regions within Malaysian waters can be categorized into the West Coast (Malacca Strait) and the East Coast (South China Sea) of Peninsular Malaysia, as well as the waters of Sarawak and Sabah, which extend to include the Sulu and Celebes Seas on the east coast of Sabah (Faizal et al., 2019).
Species of tuna such as Thunnus tonggol (longtail tuna), Euthynnus affinis (Kawakawa), and Auxis thazard (frigate tuna) are among the key pelagic fish taken by commercial and traditional fishing gear and account for approximately 5 % of Malaysia's total marine landings (Department of Fisheries Malaysia, 2020). From 2003 to 2018, Malaysia's number of neritic tuna landings increased steadily from 50,000 to 75,000 metric tonnes, and the annual landings of E. affinis and T. tonggol from 2010 to 2020 were 275,797 metric tonnes and 368,647 metric tonnes, respectively (Faizal et al., 2019; Department of Fisheries Malaysia, 2020). The Thunnini tribe includes the economically important genera: Euthynnus, Auxis, Thunnus, and Katsuwonus (Sato et al., 2020). Euthynnus affinis, E. alletteratus, and E. lineatus belong to the genus Euthynnus. Euthynnus affinis (Cantor, 1849) is considered one of Scombridae's most significant family members. This species can often be found in tropical and subtropical seas across the Indo-Pacific area (Yazawa et al., 2019; Khoa et al., 2021). This epipelagic tuna species has emerged as a significant trade in Malaysia (Yazawa et al., 2015). In contrast, Euthynnus alletteratus and E. lineatus are distributed inside the Atlantic and Pacific Oceans (Kumar and Kunal, 2013).
For successful fisheries and stocks, evaluating the exploited species' population structure is crucial. Relevant stakeholders may utilize data obtained from such evaluations for various purposes, including determining a suitable conservation unit and analyzing population structure in mixed-stock fisheries (El Mghazli et al., 2021). Stock structure may be determined using a variety of methodologies, including genetic, environmental, or a combination of both genetic and environmental studies. Genetic methods, including mitochondrial and nuclear DNA, are widely used for identifying stock for various tuna species. (Pecoraro et al., 2018; Syahida Kasim et al., 2020; Binashikhbubkr et al., 2023). However, due to the high cost of this approach, many researchers are increasingly turning to morphometric techniques. The morphometric study of fishes is an essential technique in fisheries management because it allows for the quantification of an evolutionary significant trait, the detection of shape changes, and the supposition of an individual organism's developmental history (ontogeny), evolutionary relations or function (Meshram et al., 2021). This technique is the most widely used approach for identifying and distinguishing populations (Benali et al., 2021). This study is frequently based on measurements of various body parts obtained from numerous individuals. Researchers often use multivariate techniques like Canonical Variance Analysis (CVA), Discriminant Function Analysis (DFA), and Principal Component Analysis (PCA) for reliable results.
Fish have the most phenotypic plasticity of any vertebrate species, with a broader range of morphological traits between and within populations (Benali et al., 2021). Numerous studies have utilized a morphometric method to determine the stock composition of E. affinis and other Scombridae species (see Karakulak et al., 2016; Allaya et al., 2016; Binashikhbubkr et al., 2022). However, the study reveals a lack of published research on the morphometric analysis of E. affinis in Malaysian Borneo (Sabah and Sarawak). The current study aims to examine and differentiate morphological differences among eight populations of E. affinis in Malaysian Borneo (Sabah and Sarawak). Hence, the results of this study will be beneficial for the preservation and management of the appropriate stock structure in the waters around Malaysian Borneo.
2 Materials and methods
2.1 Specimen accumulation
Overall, 188 individuals of Kawakawa, E. affinis from eight localities of Malaysian Borneo were collected (Table 1, Fig. 1). The specimens were collected from the landing sites specified in the annual report by the Department of Fisheries Malaysia (DoF), which provided information on the availability of fish at these locations. Samples were collected from three main geographic areas: Celebes Sea (CS), Sulu Sea (SS), and South China Sea (SCS) (Fig. 1). Based on references discovered by Collette and Nauen (1983), all samples were morphologically recognized and validated. All specimens were transferred to the Molecular Ecology Laboratory at Universiti Sains Malaysia's School of Biological Sciences. The specimens were rinsed with running water and gently tapped before being placed on a flat surface with a black background for improved visibility. The samples were tagged meticulously and captured using a Nikon D90 digital camera, and morphometric variables were measured using a digital caliper with a 0.1 cm precision (Fig. 2). Note: South China Sea (SCS), Sulu Sea (SS), and Celebes Sea (CS).
No
Sampling locations
Coordinates
Marine region
N
1.
Sandakan, Sabah
5° 50′ 24.72″ N; 118° 07′ 4.44″ E
SS
20
2.
Lahad Datu, Sabah
5° 01′ 36.48″ N; 118° 19′ 37.20″ E
CS
24
3.
Tawau, Sabah
4° 14′ 41.35″ N; 117° 53′ 28.14″ E
CS
24
4.
Kudat, Sabah
6° 53′ 14.35″ N; 116° 49′ 25.10″ E
SS
24
5.
Kota Kinabalu, Sabah
5° 58′ 29.64″ N; 116° 04′ 20.64″ E
SCS
24
6.
Bintawa, Sarawak
1°33′50.96″N; 110°23′15.6″E
SCS
24
7.
Pulau Bruit, Sarawak
2° 30′ 59.99″ N; 111° 25′ 59.99″ E
SCS
24
8.
Mukah, Sarawak
2° 53′ 45.5784′' N; 112° 6′ 13.4820′' E
SCS
24
Total
188
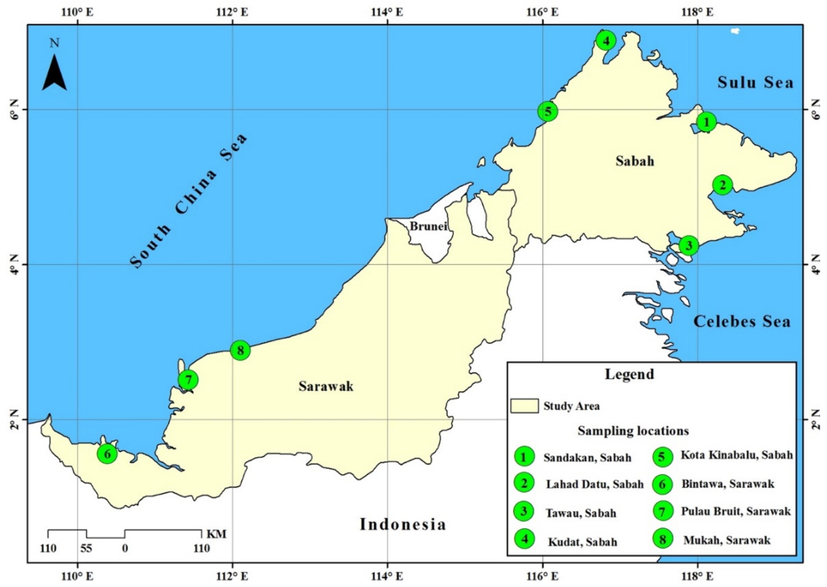
Sampling locations of Euthynnus affinis specimens collected from the South China Sea, Sulu Sea, and Celebes Sea regions.
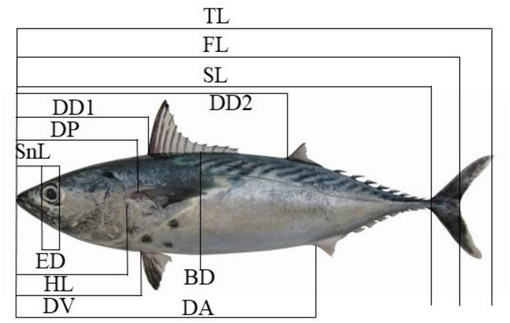
Morphometric measurements of Euthynnus affinis (Kawakawa). TL: total length, FL: fork length, SL: standard length, HL: head length, BD: body depth, ED: eye diameter, SnL: snout length, DP: distance of pectoral fin, DD1: distance of the first dorsal fin, DD2: distance of the second dorsal fin, DV: distance of ventral fin, DA: distance of anal fin.
2.2 Morphometric analyses
Using a digital calliper, twelve morphometric variables were measured, including head length (HL), snout length (SnL), fork length (FL), standard length (SL), total length (TL), body depth (BD), eye diameter (ED), distance of pectoral fin (DP), distance of the first dorsal fin (DD1), distance of anal fin (DA), distance of the second dorsal fin (DD2), and distance of ventral fin (DV) (Fig. 2). The study used multivariate discriminant function analysis to identify attribute combinations that optimize E. affinis population differentiation, aiming to estimate the proportion of accurately classified recycled characters, indicating discriminatory behavior in the classification process. SPSS version 25, a widely used statistical software in social sciences research, was used for discriminant function analysis. (Nie et al., 1975). The Principal Component Analysis (PCA) was performed using PAST software (version 4.03) (Hammer et al., 2001) to determine the maximum potential diversity of body shapes for population classification purposes. To analyze the relationships between the eight E. affinis populations, the (UPGMA) Unweighted Pair Group Method with Arithmetic Mean was utilized to perform a grouping assessment/cluster analysis (CA) with a hierarchical structure. This method relied on Mahalanobis distances (Hammer et al., 2001). Elliott et al. (1995) propose an equation for normalizing morphometric variables that accounts for size variation across populations: Madj = M(Ls/L0)b, where M is the raw measurement, Madj is the size-adjusted measurement, Ls is the mean standard length across all samples, L0 is the standard length for each sample, and b is determined for each character from the observed data as the slope of the log M on log L0 regression using all fish across populations.
3 Results
3.1 Sampling data
One hundred and eighty-eight specimens of Kawakawa, E. affinis were collected from eight landing sites in Malaysian Borneo, covering three main geographic areas: Sulu Sea, South China Sea, and Celebes Sea. Samples were collected from four major landing sites: Kota Kinabalu (Sabah), Bintawa, Pulau Bruit, and Mukah (Sarawak) representing the South China Sea, Sandakan and Kudat (Sabah) representing the Sulu Sea, and two more landing sites, Lahad Datu and Tawau (Sabah) representing the Celebs water regions (Table 1, Fig. 1).
3.2 Discriminant function analysis (DFA)
The discriminant function analysis identified five functions, 1, 2, 3, 4, and 5, with variances of 81.0 %, 9.5 %, 6.5 %, 2.8 %, and 0.2 %, indicating a significant link between population segregation and the value of 0.80 for the first function (see Table 2). The Wilk's lambda test assigns a probability of p = 0.000 to the analyses of functions 1 through function 5 (Wilk's Lambda = 0.244) and a probability of p = 0.000 to functions 2 through function 5 (Wilk's Lambda = 0.679) (Table 2). When the morphometric measures examined in this research were placed through DFA assessment based on character grading in function 1, the morphometric measurement with the highest score was the total length (TL, 0.916), followed by the standard length (SL, 0.898), body depth (BD, 0.890), fork length (FL, 0.885), head length (HL, 0.736), pectoral fin distance (DP, 0.711), eye diameter (ED, 0.706), and snout length (SnL, 0.696) (Table 3).
Function
Eigenvalue
% Of variance
Cumulative %
Canonical correlation
Wilks' Lambda
Sig.
1
1.780a
81.0
81.0
0.800
0.244
0.000
2
0.209a
9.5
90.5
0.416
0.679
0.000
3
0.143a
6.5
97.1
0.354
0.821
0.002
4
0.061a
2.8
99.8
0.240
0.939
0.182
5
0.004a
0.2
100.0
0.061
0.996
0.878
Structure matrix
Variables
Function
1
2
3
4
5
TL
0.916*
0.007
0.200
0.256
0.194
SL
0.898*
−0.003
0.201
0.232
0.314
BD
0.890*
0.202
0.309
0.131
−0.233
FL
0.885*
−0.013
0.225
0.237
0.304
HL
0.736*
−0.171
0.429
0.494
−0.029
DP
0.711*
−0.289
0.546
−0.284
0.180
ED
0.706*
0.043
0.236
0.289
0.246
SnL
0.696*
0.054
0.135
0.223
−0.233
DD2
0.491
0.132
0.718*
0.080
0.468
DD1
0.520
−0.151
0.649*
−0.258
0.361
DA
0.593
0.014
0.607*
−0.028
0.415
DV
0.432
−0.380
0.497*
−0.324
0.231
As determined by the DFA analysis, the percentage of eight E. affinis populations correctly identified is Sandakan, Sabah (50 %), Lahad Datu, Sabah (66.7 %), Tawau, Sabah (20.8 %), Kudat, Sabah (33.3 %), Kota Kinabalu, Sabah (33.3 %), Bintawa, Sarawak (20.8 %), Pulau Bruit, Sarawak (54.2 %), and Mukah, Sarawak (29.2 %) (Table 4). The DFA test used in this investigation revealed that the population from Lahad Datu, Sabah, had the greatest percentage of correctly classified individuals (66.7 %). In contrast, the populations of Tawau in Sabah and Bintawa in Sarawak both showed the highest percentage of misclassification at 79.2 % (Table 4). Following the findings of a canonical discriminant function assessment, the typical size of all Bornean groups was almost the same (Fig. 3). Population overlap may be the cause of this resemblance in size.
Locality
Sandakan
Lahad Datu
Tawau
Kudat
Kota Kinabalu
Bintawa
Pulau Bruit
Mukah
Sandakan
50.0
0.0
25.0
0.0
0.0
0.0
25.0
0.0
Lahad Datu
0.0
66.7
0.0
20.8
0.0
0.0
0.0
12.5
Tawau
41.7
0.0
20.8
0.0
16.7
0.0
20.8
0.0
Kudat
0.0
54.2
0.0
33.3
0.0
0.0
0.0
12.5
Kota Kinabalu
0.0
12.5
4.2
16.7
33.3
16.7
12.5
4.2
Bintawa
20.8
4.2
4.2
4.2
0.0
20.8
33.3
12.5
Pulau Bruit
16.7
8.3
0.0
4.2
0.0
16.7
54.2
0.0
Mukah
0.0
4.2
4.2
12.5
12.5
8.3
29.2
29.2
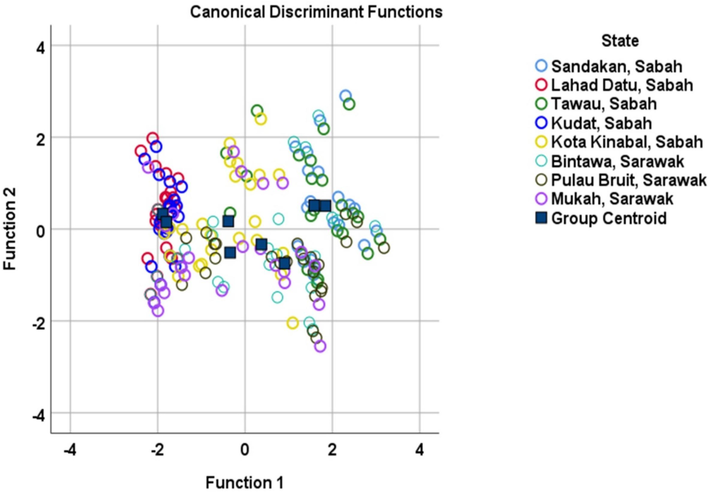
Canonical discriminant analysis based on morphometric measurements of eight populations of Euthynnus affinis.
3.3 Principal component analysis (PCA)
With an estimated body shape variation of 82.562 % and a highly significant eigenvalue of 9.907, the first component of the principal component analysis exhibits the highest variance among the 12 components used to estimate variations in body shape [(it is considered significant if the eigenvalue is greater than 0.3 (Nimalathasan, 2009)]. The first four principal components (PC) explained 96.417 % of the common variance (82.562 %, 8.792 %, 3.179 %, and 1.884 % for PC1, PC2, PC3, and PC4, respectively) (Table 5). PCA analysis revealed that the overlapped patterning between PC1 and PC2 in the scatter plot shown in Fig. 4 strongly supports the restricted variation in the shape of E. affinis body, for which there are very high and significant eigenvalues that can be used to distinguish E. affinis according to typical body pattern. Fig. 4 demonstrates that the population is mixed with no visible distinction, indicating that physical homogeneity exists amongst Malaysian Borneo groups. In general, outcomes from the PCA assessment corroborate those from the DFA research. According to a Mahalanobis distance-based hierarchical cluster assessment, the eight E. affinis populations were separated into three distinct groups (Fig. 5). The first category includes Kota Kinabalu (Sabah), Mukah, Bintawa, and Pulau Bruit (Sarawak) populations. The second group comprises E. affinis populations from Lahad Datu and Kudat (Sabah), while the third group includes populations from Tawau and Sandakan (Sabah).
PC
Eigenvalue
% Variance
Cumulative %
1
9.907
82.562
82.562
2
1.055
8.792
91.354
3
0.381
3.179
94.532
4
0.226
1.884
96.417
5
0.109
0.908
97.324
6
0.104
0.865
98.190
7
0.091
0.756
98.946
8
0.056
0.469
99.415
9
0.036
0.297
99.712
10
0.027
0.223
99.935
11
0.005
0.042
99.977
12
0.003
0.023
100.000
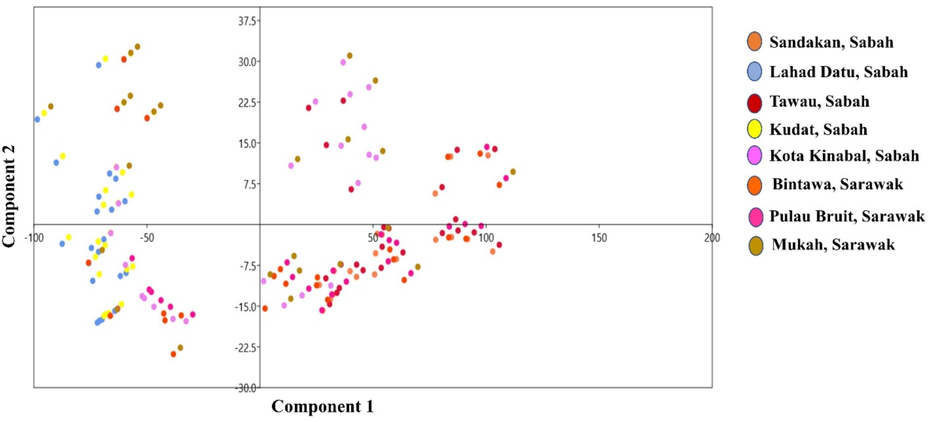
Scatterplot of first two principal components of Euthynnus affinis (n = 188) based on morphometric measurements.
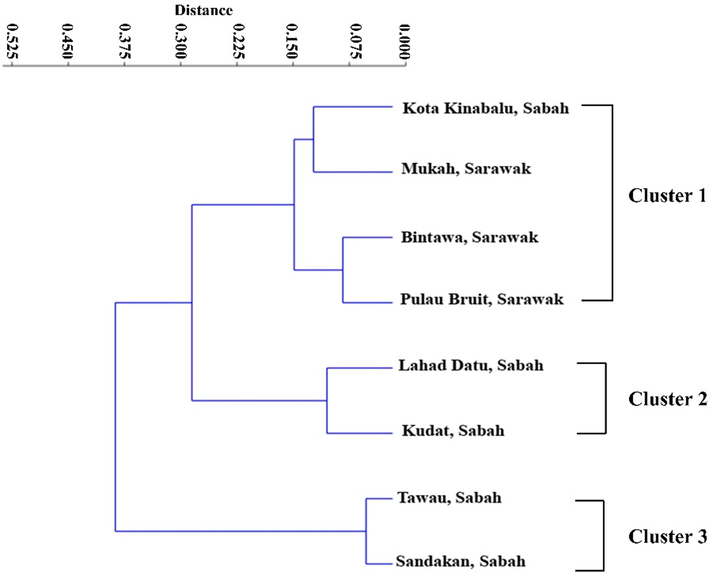
Dendrogram generated from cluster analyses of morphometric measurements using Mahalanobis distances among eight populations of Euthynnus affinis collected from Malaysian Borneo's waters.
4 Discussion
4.1 Discriminant function analysis (DFA)
The discriminant analysis helped identify data segregation functions, revealing the organization of species stock by identifying discrete clusters (Aminan et al., 2020). The experiment revealed that Function 1 in DFA demonstrated the highest efficacy in differentiating E. affinis, with a remarkable variability of 81.0 % and a Wilk's lambda score of 0.000 (Table 2). Total length (TL) was found to be the most important factor in determining E. affinis population membership, with the highest contribution score, followed by standard length (SL), body depth (BD), fork length (FL), head length (HL), pectoral fin distance (DP), eye diameter (ED), and snout length (SnL) in function 1 (Table 3). Interestingly, canonical discriminant analysis, on the other hand, reveals that the Malaysian Borneo's population is morphologically homogenous (Fig. 3).
The observation supports previous research by Aminan et al. (2020) and Gain et al. (2017), which demonstrated that the key feature (function 1) in DFA evaluation can differentiate between Rasbora spp. and Cirrhinus cirrhosus populations, respectively. Other research carried out in the Mediterranean region of Tunisia indicated that the standard length, the length of the pectoral fin, and the length of the fork are all parameters that have a role in classifying the population of bullet tuna, Auxis rochei (Allaya et al., 2016). Similarly, Karakulak et al. (2016) found a strong correlation between the pectoral fin length of Euthynnus alletteratus and Thunnus thynnus, as well as the length of the head, the first predorsal fin, and the height of the second dorsal fin. Anzeer et al. (2021) further substantiated this observation by employing discriminant function analysis to identify variations in body shape and size among larvae of Dascyllus carneus. The results demonstrate significant heterogeneity, particularly in the head, trunk, and tail. Different environmental niche utilization, food availability, and prey species may also contribute to differences in head morphology (Cronin-Fine et al., 2013). This investigation's findings align with those of El Mghazli et al. (2021), who achieved a 96 % accuracy rate in identifying Horse Mackerel Trachurus trachurus specimens from the Atlantic waters off Morocco's coast.
Even among closely related fish species, it is important to note that differences in body shape and size are essential for recording morphological differences, differences in sizes and shapes, and constructing phylogenetic correlations based on body shape changes. It is also vital to emphasize that body shape and size are the most significant instruments (Imtiaz and Md Naim, 2018). Aquatic organisms, like fish, must adapt to their habitat's conditions to maintain their biological systems' normal functioning. The interesting thing about the morphological analysis done in this study is that there is variation across populations of the same species, which may signal changes in the environment and behavior of the species (Jalili et al., 2015). The observed variations in morphometric characteristics can be attributed to both intrinsic and extrinsic factors, including independent and dependent elements, as well as exogenous variables like food availability and water quality (Kumar et al., 2019). To predict group membership data, the greater standard of resemblance of the investigated components is utilized (Kočišová and Misanková, 2014; Aminan et al., 2020). Fisheries management, biodiversity conservation, and natural resource management depend on population discrimination and species recognition. Based on our investigation, it is evident that DFA, PCA, and CA are instrumental in differentiating the E. affinis population across Malaysian Borneo. These analytical tools not only play a crucial role but also provide a substantial foundation for comprehending essential information about E. affinis. This understanding is pivotal for the efficient management and safeguarding of regional resources in Malaysian Borneo.
4.2 Principal component analysis (PCA)
The first four Principal Components (PCs) addressed 96.417 % of the diversity in body shape in total variables (Table 5). The discovery is consistent with the findings of Addis et al. (2014), who revealed that the first two PCs captured 56.97 % of the shape variance in Thunnus thynnus. Imtiaz and Md Naim (2018) found 80 % variations in body shape of Nemipterus genus and reported comparable findings. Based on these observations, we conclude that changes in E. affinis body shape exist in total body shape. Consequently, this result is analogous to that of Jalili et al. (2015), who found that morphological differences between Alburnus filippii were determined by snout tip and body depth variation. One noteworthy illustration of the prevalence of the results of this study on marine fish populations is the study done by Mounir et al. (2019). They discovered that the most relevant characteristics describing variations in Sardina pilchardus populations from Morocco's Atlantic coast were head length, dorsal fin, and body depth. Moreover, Nasri et al. (2019) showed that body depth, the length of the head, dorsal fin, and peduncle tail are significant in detecting variance among Cyprinion species in Persian waters using morphometric approaches. The PCA results generally complement the DFA findings, indicating that morphological homogeneity exists among E. affinis populations from Malaysian Borneo. Periodic movement in these regions might explain the multiple dispersion of these samples, implying that this population has a temporal and geographical residency in this location.
Intriguingly, the results of this study have confirmed previous research on the E. affinis genetic composition across many coastal environments, including Taiwan (Chiou and Lee, 2004), the Philippines and Peninsular Malaysia (Santos et al., 2010), the Indian Ocean North (Kumar et al., 2012), Malacca Strait (Masazurah et al., 2012), and Tanzanian coastal waters (Johnson et al., 2016), where the research shows that there is just one genetic pool of E. affinis. Based on the hierarchical cluster analysis results, the E. affinis population was classified into three categories (Fig. 5). The first cluster consists of individuals from Kota Kinabalu (Sabah), Mukah, Bintawa, and Pulau Bruit (Sarawak), the second comprises population from Lahad Datu and Kudat (Sabah), and the third group includes population from Tawau and Sandakan. The unique geographical conditions and environmental limits experienced by each population may account for the observed differences across these populations (Siddik et al., 2016). The ecology of the ocean, which includes many different biological zones and factors, including the quantity of light that reaches the ocean floor, the amount of food that is available, and the speed at which the water moves, has also been connected to such variations (Imtiaz and Md Naim, 2018). Populations of fish living in different locations may look different from one another because of environmental, genetic, and selective interactions that cause differences in morphology across species (Sajina et al., 2011). Based on cluster analysis, our findings are comparable to those of Siddik et al. (2016) and El Mghazli et al. (2021), who unearthed that populations of gangetic whiting (Sillaginopsis panijuswere) from Bangladesh and Atlantic horse mackerel (Trachurus trachurus) from Morocco were divided into two groups.
It is vital for the sound and efficient management of fisheries resources to better understand the population organization of the species being evaluated. This is because each stock has to be managed individually to maximize productivity (Tzeng, 2004). Therefore, ignoring the stock analysis approach can result in an array of issues, such as the setback of genetic variability, modifications in biological characteristics such as making fish smaller, overexploitation of populations that produce less, and erroneous projections of how mitigation strategies might indeed influence stocks. These problems can all contribute to a decline in overall stock abundance (Cronin-Fine et al., 2013). Morphometric differences across regional groupings can be related to different genetic structures or various environmental influences in each location (Tzeng, 2004). Fish exhibit greater diversity in phenotypic traits inter and intra-population compared to any other vertebrate, making them more susceptible to such changes, eventually modifying their morphological characteristics. Fish also have more physical variety amongst populations than other animals (Verma et al., 2014; Benali et al., 2021). Morphometric discrepancies amongst groups are anticipated to be related to geographic separation and differing evolutionary origins (Aminan et al., 2020).
5 Conclusion
This study employed morphometric techniques to analyze E. affinis from Malaysian Borneo seas (Sabah and Sarawak), marking the first study on this particular species. The study of eight E. affinis populations revealed significant variations in body structure, as confirmed by discriminant function evaluation, principal component analysis, and cluster study. The study's findings will give a considerable baseline of E.affinis information for effectively managing and protecting Malaysian Borneo regional resources. Integrating morphometric and molecular methodologies will help future research provide a more accurate understanding of E. affinis populations.
Acknowledgement
The authors express their profound gratitude to Universiti Sains Malaysia (USM) and the School of Biological Sciences (SBS) for providing the opportunity and research resources for this project. The research was funded by the Fundamental Research Grant Scheme (FRGS Fasa 1/2020), which the Malaysian Ministry of Education administers. In addition, the first author wishes to thank Hadhramout University and the Hadhramout Foundation in Yemen for their funding assistance with the author's studies.
Declaration of competing interest
The authors declare that they have no known competing financial interests or personal relationships that could have appeared to influence the work reported in this paper.
References
- Geographic variation of body morphology of the Atlantic bluefin tuna, (Thunnus thynnus, Linnaeus, 1758) J. Appl. Ichthyol.. 2014;30(5):930-936.
- [CrossRef] [Google Scholar]
- Morphological variation of bullet tuna Auxis rochei (Risso, 1810) from Tunisian waters. Acta Zoologica Bulgarica. 2016;68(3):433-442.
- [Google Scholar]
- Morphometric analysis and genetic relationship of Rasbora spp. in Sarawak, Malaysia. Trop. Life Sci. Res.. 2020;31(2):33-49.
- [CrossRef] [Google Scholar]
- Annual Fisheries Statistics (2021). Annual Fisheries Statistics, Vol. 1. Kuala Lumpur: Ministry of Agriculture and Agro-industry, Malaysia Fisheries Department.
- Geometric morphometric analysis of body shape and size variations in hatchery-reared larvae of a tropical damsel sh, Dascyllus carneus Fischer, 1885. Reserch Square 2021:1-29.
- [Google Scholar]
- Bakar, A. A., Adamson, E. A. S., Juliana, L. H., Nor Mohd, S. A., Wei-Jen, C., Man, A., Naim Md, D., 2018. DNA barcoding of Malaysian commercial snapper reveals an unrecognized species of the yellow-lined Lutjanus (Pisces: Lutjanidae). PLoS ONE, Vol. 13. DOI: 10.1371/journal.pone.0202945.
- Morphometric Characteristics of Luciobarbusmascarensis and L. lanigarensis (teleostei: cyprinidae) in western Algeria. Genet. Biodivers. J.. 2021;5(2):20-32.
- [Google Scholar]
- Binashikhbubkr, K., Malik, A. A., Mahboob, S., Naim, D., 2022. Geometric morphometric discrimination between seven populations of Kawakawa Euthynnus affinis (Cantor, 1849) from Peninsular Malaysia. Journal of King Saud University - Science, 101863. DOI: 10.1016/j.jksus.2022.101863.
- Population genetic structure of Kawakawa (Euthynnus affinis Cantor, 1849) in Malaysian waters based on COI gene. Nusantara Biosci.. 2023;15(2):258-268.
- [CrossRef] [Google Scholar]
- Migration of kawakawa Euthynnus affinis in the waters near Taiwan. Fish. Sci.. 2004;70(5):746-757.
- [Google Scholar]
- Collette, B. B., Nauen, C. E., 1983. FAO Species Catalogue Vol . 2 Scombrids of the world an annotated and illustrated catalogue of Tunas, Mackerels, Bonitos and related species know to date. In FAO Fisheries Synopsis (Vol. 2). DOI: FAO Fish. Synop. 125(2).
- Application of morphometric analysis to identify alewife stock structure in the Gulf of Maine. Mar. Coast. Fish.. 2013;5(1):11-20.
- [CrossRef] [Google Scholar]
- Department of fishers Malaysia, Ministry of agriculture and food industry. https://www.dof.gov.my/en/.
- El Mghazli, H., Znari, M., Mounir, A., 2021. Stock Discrimination in the Horse Mackerel Trachurus trachurus (Teleostei: Carangidae) off the Moroccan Atlantic Coastal Waters using a Morphometric-Meristic Analysis. Thalassas: An International Journal of Marine Sciences, 1-11.
- Morphometric analysis of orange roughy (Hoplostethus atlanticus) off the continental slope of southern Australia. J. Fish Biol.. 1995;46:202-220.
- [CrossRef] [Google Scholar]
- Faizal, E.M., Jamon, S., Jamaludin, N.A., Halim, N.H.A., 2019. Status of neritic tuna fishery and some biological aspects of Kawakawa (Euthynnus affinis) in the northern part of Peninsular Malaysia. IOTC–2019–WPNT09–13, 1–5.
- Landmark-based morphometric and meristic variations of endangered mrigal carp, Cirrhinus cirrhosus (Bloch 1795), from wild and hatchery stocks. Sains Malaysiana. 2017;46(5):695-702.
- [CrossRef] [Google Scholar]
- PAST: Paleontological statistics software package for education and data analysis. Paleontol Electron. 2001;4:3-9.
- [Google Scholar]
- Geometric morphometrics species discrimination within the genus nemipterus from Malaysia and its surrounding seas. Biodiversitas. 2018;19(6):2316-2322.
- [CrossRef] [Google Scholar]
- Molecular identification of commercially important species of Nemipterus (Perciformes : Nemipteridae) in surrounding seas of Malaysia. Biodiversitas. 2016;17(2):571-577.
- [CrossRef] [Google Scholar]
- Body shape comparison of Kura Bleak (Alburnus filippii) in Aras and Ahar-Chai Rivers using geometric morphometric approach. Res. Zool.. 2015;5(1):20-24.
- [CrossRef] [Google Scholar]
- Johnson, M. G., Mgaya, Y. D., Shaghude, Y. W., 2016. Genetic Stock Structure and Phylogenetic Relationship of Kawakawa Euthynnus affinis–Cantor (1849) in the Northern Coastal Waters of Tanzania Using Mitochondrial DNA Control Region. IOTC-2016-WPNT06-22.
- Morphometric differentiation between two juvenile tuna species [Thunnus thynnus (Linnaeus, 1758) and Euthynnus alletteratus (Rafinesque, 1810)] from the Eastern Mediterranean Sea. J. Appl. Ichthyol.. 2016;32(3):516-522.
- [CrossRef] [Google Scholar]
- Changes in early digestive tract morphology, enzyme expression and activity of Kawakawa tuna (Euthynnus affinis) Aquaculture. 2021;530:735935
- [CrossRef] [Google Scholar]
- Discriminant analysis as a tool for forecasting company's financial health. Procedia Soc. Behav. Sci.. 2014;110:1148-1157.
- [CrossRef] [Google Scholar]
- Single genetic stock of kawakawa Euthynnus affinis (Cantor, 1849) along the Indian coast inferred from sequence analyses of mitochondrial DNA D-loop region. Conserv. Genet.. 2012;13(4):1119-1131.
- [Google Scholar]
- Historic demography and phylogenetic relationship of Euthynnus species based on COI sequence analyses. Int. J. Bioinf. Res. Appl.. 2013;9(5):547-555.
- [CrossRef] [Google Scholar]
- Fishery and length based population parameters of little tuna, Euthynnus affinis (Cantor, 1849) from Gulf of Mannar, Southwestern Bay of Bengal. Indian J. Geo Mar. Sci.. 2019;48:1708-1714.
- [Google Scholar]
- Masazurah, A. R., Azizah, S., Samsudin, B., 2012. A preliminary study of population structure of kawakawa, Euthynnus affinis (Cantor 1849) in the straits of Malacca. IOTC-2012-WPNT02-23.
- Morphological measurements, length weight relationship and relative condition factor (Kn) of Obtuse barracuda Sphyraena obtusata (Cuvier, 1829) from South-eastern Arabian Sea. Indian J. Geo Mar. Sci.. 2021;50:480-488.
- [Google Scholar]
- Discrimination of the phenotypic sardine Sardina pilchardus stocks off the Moroccan Atlantic coast using a morphometric analysis. Afr. J. Mar. Sci.. 2019;41(2):137-144.
- [CrossRef] [Google Scholar]
- Interspecific morphological variation among members of the genus Cyprinion heckel, 1843 (Teleostei: Cyprinidae) in Iran, using landmark-based geometric morphometric technique. Iran. J. Ichthyol.. 2019;6(1):54-64.
- [CrossRef] [Google Scholar]
- Nie, N.H., Bent, D.H., Hull, C.H., 1975. SPSS: Statistical package for the social sciences (Vol. 227). New York: McGraw-Hill.
- Determinants of key performance Ind Icators (Kpis) of private sector banks in Srilanka: An application of exploratory factor analysis. USV Ann. Econ. Public Admin.. 2009;9(2):9-17.
- [Google Scholar]
- The population genomics of yellowfin tuna (Thunnus albacares) at global geographic scale challenges current stock delineation. Sci. Rep.. 2018;8(1):1-10.
- [CrossRef] [Google Scholar]
- Stock structure analysis of Megalaspis cordyla (Linnaeus, 1758) along the Indian coast based on truss network analysis. Fish. Res.. 2011;108(1):100-105.
- [CrossRef] [Google Scholar]
- A pilot study on the genetic variation of eastern little tuna (Euthynnus affinis) in Southeast Asia. Philippine J. Sci.. 2010;139(1):43-50.
- [Google Scholar]
- Larval identification based on melanophore patterns in two Auxis species, bullet tuna Auxis rochei and frigate tuna Auxis thazard, from the northwest Pacific Ocean. Fish. Sci.. 2020;86(4):625-631.
- [CrossRef] [Google Scholar]
- A multivariate morphometric investigation to delineate stock structure of gangetic whiting, Sillaginopsis panijus (Teleostei: Sillaginidae) Springerplus. 2016;5(1):1-13.
- [CrossRef] [Google Scholar]
- Recent population expansion of longtail tuna Thunnus tonggol (Bleeker, 1851) inferred from the mitochondrial DNA markers. PeerJ. 2020;8:e9679.
- [Google Scholar]
- Morphological variation between populations of spotted mackerel (Scomber australasicus) of Taiwan. Fish. Res.. 2004;68(1–3):45-55.
- [CrossRef] [Google Scholar]
- Verma, J., Kashyap, A., Serajuddin, M., 2014. Phylogeny Based on Truss Analysis in Five Populations of Freshwater Catfish: Clupisoma Garua. International Journal of Science and Research (IJSR), 3(8), 1414–1418. Retrieved from https://www.ijsr.net/archive/v3i8/MTUwODE0MDQ.
- GnRHa-induced spawning of the Eastern little tuna (Euthynnus affinis) in a 70–m3 land-based tank. Aquaculture. 2015;442:58-68.
- [CrossRef] [Google Scholar]
- Production of triploid eastern little tuna, Euthynnus affinis (Cantor, 1849) Aquac. Res.. 2019;50(5):1422-1430.
- [CrossRef] [Google Scholar]


