

Translate this page into:
Statistical approaches in modeling of the interaction between bacteria and diatom under a dual-species co-cultivation system
⁎Corresponding author at: Division of Science and Technology, Beijing Normal University-Hong Kong Baptist University United International College, Zhuhai 519085, China. amelsawah@uic.edu.cn (A.M. Elsawah) a_elsawah85@yahoo.com (A.M. Elsawah)
-
Received: ,
Accepted: ,
This article was originally published by Elsevier and was migrated to Scientific Scholar after the change of Publisher.
Abstract
This study investigates the co-cultivation system of Nitzschia palea (FACHB-2263) and Pseudomonas chlororaphis (ACCC-19853) in the artificial consortium at different concentrations. The algicidal mode is evaluated using three different full factorial experiments (FFEs) under the following three scenarios: different bacteria culture cell densities against different diatoms; algicidal activities of bacterial culture supernatant against the N. palea in different growth phases, such as lag, exponential and stationary phase; different bacteria and diatom against artificial consortium at different concentrations. For minimizing the effect of random error, three replications of each experimental run of these three FFEs are used. The influence of bacteria on growth in total chlorophyll is analyzed for all of these three replicates FFEs. The results demonstrate that: the P. chlororaphis showed high algicidal activity against N. Palea within 5 days; selected bacteria culture supernatant exhibited strong algicidal activity in the lag phase while the artificial consortium achieved the algal cell lysis at different concentrations of the bacteria to the diatom cells and the diatom to the bacteria cell; and the indoor mesocosms confirmed that P. chlororaphis effectively reduced N. palea cells by over 90% within 5 days. The findings suggest that the artificial consortia algal-bacterial symbiotic system is thus proven to be an effective and promising system for microalgae bloom control treatment algal-bacterial symbiotic system that was extrapolated for novel algae bloom control treatment.
Keywords
Microalgae-bacteria co-culturing
Algicidal bacteria
Pseudomonas chlororaphis
Nitzschia palea
Experimental design

1 Introduction
Diatoms are unicellular microalgae with unique, highly structured silicified cell walls. These unicellular organisms play a crucial role in the ecosystems of the oceans, waterways, and soils as central primary producers. Several environmental factors influence the frequency of diatom blooms worldwide, such as climate change, the rapid development of industry and agriculture, and the constant acceleration of urbanization. The effects of human activities on the ecosystem are increasingly immediate (Carolina, 2002; Heisler et al., 2008; Wells et al., 2015). According to Buchan et al. (2014), the phytoplankton bloom is reported as the dominant free-living bacterial group, but it is currently unknown if bacteria also plays a vital role in this phenomenon. Nevertheless, the symbiotic interaction between bacteria and diatoms has gained much attention in the aquatic ecosystem (Worden et al., 2015; Seymour et al., 2017). Interactions between diatom and bacteria are complex and take many forms, including mutually beneficial symbiosis of mutual utilization of metabolites and competition and inhibition of nutrients.
Many research analyses on the symbiosis between microalgae and bacteria or fungi and these multiple symbiotic relationships applied to many industries. For example, filamentous fungi Aspergillus niger (Ted S-OSU) was used to co-culture with microalgae to form cell pellets for an easier harvest, which can apply to the microalgae biofuels industry (Zhang and Hu, 2012). Chlorella vulgaris were co-cultured with bacteria to form starvation terms for the wastewater treatment industry, promoting biomass harvesting and lipid accumulation (Xu et al., 2016). However, in some incidence potentially inhibiting growth phytoplankton population dynamics or by active lysis of algal cells by using bacteria as an algicidal agent (Kang et al., 2011; Jung et al., 2012; Yu et al., 2018). Several studies pointed out the algicidal bacteria attacks algae by employing a direct or indirect approach (Skerratt et al., 2002). The existing studies demonstrated a bacterium prohibited the algicidal activity against the phytoplankton and identified to date, such as Pseudomonas sp., Vibrio sp. Alteromonas sp. and Bacillus sp. (Kim et al., 2018). In the past decade, management and mitigation strategies have attracted considerable attention, and different methods are regularly tested in practice and applied to control toxic algae/blooms in freshwater and marine aquatic ecosystems. Management strategies, such as physical methods, chemical methods, and biological methods, have advantages and disadvantages, e.g., physical technology has no secondary pollution, but the cost is high. Chemical technology has quick results and low cost, but because of the secondary pollution of benthic organisms, it may change the food web in the aquatic ecosystem, and thus continuous improvements are needed (Jeong et al., 2008). Biological agents provide a new and promising method for controlling blooms, including bacteria, actinomycetes, viruses, protozoa, and macrophytes, and microalgae (Balaji Prasath et al., 2021a; Zhang et al., 2013) that are potent inhibitors for the control of bloom outbreaks because they use many readily available raw materials, lower economic costs. They will not produce secondary pollution (Yang et al., 2014).
N. palea is a microalgae species that belongs to the diatom group. In addition, it is an environmental indicator; it has a wide geographical distribution in the environmental monitoring industry used to be a biochemical marker to evaluate stress in the aquatic ecosystem (Trobajo et al., 2009; Branco et al., 2010). P. chlororaphis are gram-negative bacteria, the optimum growth temperature is widely distributed in nature and can be detected in some wastewater. This study investigates the co-cultivation system of FACHB-2263 and ACCC-19853 in the artificial consortium at different concentrations. This paper determines the algicidal mode of ACCC-19853 and investigates the algicidal activity that is evaluated by applying the following three different experimental conditions. What is the effective dose bacteria culture concentration that affects the cell density with selected diatom species? How the selected bacteria and diatom with artificial consortium at different concentrations composition changes during the co-culture. Finally, a look is given at the bacterial culture supernatant against N. palea in different growth phases such as lag, exponential and stationary phases to determine if these extracts also play a role in potentially inhibiting the growth of the phytoplankton population. The influence of bacteria on growth in terms of the total chlorophyll is analyzed using three replicate experiments that are determined every 12 hrs. The results indicated that N. pale composition and structure are firmly algicidal activities by the ACCC 19,853 species in mesocosm experiments. For clarity, we relegate all the tables and figures to an appendix.
2 Materials and methods
Microalgae often grow bacteria in long-term laboratory cultures. Bacteria are beneficial to the oxygen, and extracellular substances produced by microalgae and compensate microalgae with carbon dioxide and nutrients. This synergistic relationship helps to establish an effective microalgae-bacteria co-cultivation model.
2.1 Microalgae culture
N. palea FACHB-2263 strains were obtained from the Freshwater Algae Culture Collection at the Institute of Hydrobiology in China. The diatom was maintained as a unialgal axenic culture at 28 °C and pH 7 under 100 μmol photons m-2s−1 with a 12light:12dark cycle. The algae were cultured in a 250 ml Erlenmeyer flask with a CSI medium. The stock culture was kept in the illumination incubator at 28 °C. The N. palea culture was maintained in our lab by transferring 1% of the culture volume to a fresh medium every two weeks. The lack of contaminating bacteria was checked by streaking aliquots on nutrient agar plates.
2.2 Bacteria culture
P. chlororaphis ACCC-19853 bacteria co-culture with the microalgae were purchased from the China Center of Industrial Culture Collection. The bacterium was axenic maintained on nutrient agar plates containing 1%–5% agar at 30 °C and pH 7. Initially, the ACCC-19853 bacteria were cultured in the nutrient broth at 30 °C. The stock solution (1 ml) was inoculated in 10 ml of the nutrient medium incubated for about five days to the exponential phase at 30 °C with shaking at 120 rpm, and growth was monitored by determining the optical density of the culture broth at 600 nm using a UV–visible spectrophotometer (Liu et al., 2018). The bacterial culture was inoculated in 500 ml of the nutrient medium incubated for ten days under the same conditions and used for extract preparation.
3 Designing the experiments
Experimental design is arguably the most commonly used and effective tool for understanding the behavior of complex phenomena in industrial and scientific applications by investigating the effect of input variables (factors) on the response variables (outputs) (Elsawah, 2021a). Experimental design is becoming the cornerstone of many real-world complex phenomena (Elsawah, 2019) for investigating which factors have significant effects and the conditions (i.e., levels or selected values) under which these factors should work to optimize the outputs by establishing the connections between the factors and their responses (Elsawah, 2021b). This technique involves two basic aspects, designing the experiment (data collection) and analyzing the experiment (data analysis) (Elsawah, 2018). Designing the experiment is arguably the most essential part of this approach (Elsawah, 2020). A full factorial design is the best choice for experimenters to design their experiment for the following two simple reasons: (i) its capability of estimating all the possible factor effects, i.e., main effects of the factors and the interaction effects among them; and (ii) its construction is very simple and easy for non-mathematician experimenters that are given by conducting the experiment at all the possible combinations (experimental runs) of levels (all the possible different values) for all the input factors (Elsawah, 2021c). It is worth mentioning that if the full factorial designs cannot be used due to the required large number of experimental runs, optimal fractional of full factorial designs can be selected based on some optimality perspectives (Elsawah et al., 2021). Due to the mentioned advantages of full factorial designs, three full factorial designs for three different experiments are used in this study to test the interaction between the P. chlororaphis and N. palea under a dual-species co-cultivation system. For minimizing the effect of random error, the experiment at each condition (experimental run) will be performed three times, i.e., we have three replicates for each situation.
3.1 First-stage experiment: bacteria concentration and time interactions
The first-stage experiment has two input factors, the time with five levels (i.e., different values) (0, 12, 24, 48, 96 h) and the bacteria concentration with four levels (control, 104, 106, 108 CFU/ml−1), and three output factors, the cell density (CD x106 cells/ml), dry cell weight (DCW g/l) and the total chlorophyll (TC mg/l). The full factorial design for this experiment with three replicates for each experimental run is used. The experiment is performed 60 times, three times for each experimental run (i.e., condition or level-combination) of all the possible 20 level-combinations among the five levels of the time and the four levels of the bacteria concentration. In this experiment, we cultured different bacterial cell densities with selected diatoms. The pre-culture of ACCC-19853 is used for co-cultivation experiments. The stationary phase bacteria culture was washed twice by centrifugation at 5000 rpm for 5 min and re-suspended in the medium. The co-culture was obtained by adding bacterial cells up to a final density of 1 × 10⁸ CFU/ml−1, 1 × 10⁶ CFU/ml−1, and 1 × 10⁴ CFU/ml−1 to the culture of FACHB-2263 strains immediately after sub-culturing it in a fresh medium with an initial density of approximately 1 × 10⁶ cells/ml.
Meanwhile, the control group set up an algal culture with blank sterile NB or CSI medium. The co-culture systems were kept in a 30 °C constant temperature incubator shaker controller. The flask was incubated in algae culturing conditions for 96 h. Every day, we measured the chlorophyll and cell concentration of treated and control groups using a UV–visible spectrophotometer to represent the symbiotic relationship between algae and bacteria. The optical density (OD) ratio between the experimental and control groups is used to evaluate the OD ratio between the experimental and control groups is used to evaluate the relationship between the algae and bacteria. The treated samples were kept in an ice bath, and vital algae cells were measured immediately by counting the active cells under an inverted microscope (Olympus).
3.2 Second-stage experiment: bacteria concentration and growth phase interactions
The second-stage experiment has two inputs, the growth phase with four levels (control, stationary, exponential, lag) and bacteria concentration with five levels (0, 12.5, 25, 50, 100 ml), and three outputs, CD (x106 cells/ml), DCW (g/l) and TC (mg/l). The full factorial design for this experiment with three replicates for each condition (experimental run) is used. The experiment is performed 60 times, three times for each level-combination of all the possible 20 level-combinations among the five levels of the bacteria concentration and the four levels of the growth phase. In this experiment, ACCC-19853, the crude extract is collected from the bacterial culture described by Jin et al. (2014). After we added these extracts to exudates at three different growth phases (lag, exponential and stationary) of algae cultures, studied in 500 l conical flasks. Each flask contained 250 ml of freshly inoculated N. palea, with a CD of 1.85 × 10⁶ cells/ml, 13 × 106 cells/ml and 14.57 × 10⁶ cells/ml, respectively in the sterilized CSI medium. Bacterial supernatant crude extract dissolved in DMSO is added to a final concentration of 75 μg/ml−1 at a DMSO content of 0.5% (v/v) and the final crude extract is divided into five values (0, 12.5, 25, 50 and 100 ml) that are used for the treatment. The control included 0.5% (v/v) DMSO only. The triplicated flasks for both treatment and control were incubated for 48 h at 28 °C with 100 μmol photons m-2s−1 and a 12 h light: 12 h dark cycle. Sampling for cell counting by a spectrophotometer is performed every day until the end of the experiment.
3.3 Third-stage experiment: bacteria-alga ratio concentration and time interactions
The third-stage experiment has two inputs, the bacteria-alga ratio concentration with nine levels (10–90, 20–80, 30–70, 40–60, 50–50, 60–40, 70–30, 20–80, 10–90 ml) and the time with five levels (0, 24, 48, 72, 96 h), and three outputs, CD (×106 cells/ml), DCW (g/l) and TC (mg/l). The full factorial design for this experiment with three replicates for each experimental run is used. That is, the experiment is performed 135 times, three times for each level-combination of all the possible 45 level-combinations among the five levels of the time and the nine levels of the bacteria-alga ratio concentration. In this experiment, a cell suspension of ACCC-19853 in the growth phase is diluted in nutrient broth medium of the bacterial culture, at final concentrations of 1 × 10⁸ CFU/ml –1are prepared. Meanwhile, we cultured and inoculated exponentially growing cultures of FACHB-2263 into these bacterial cultures at a final concentration of 1 × 10⁶ cells ml. In different ratio of co-culture species were cultured 90:10, 80:20, 70:30, 60:40, 50:50, 40:60, 30:70, 20:80 and 10:90, respectively. The total volume is 100 ml for each experiment. The mixed cultures are incubated under the same conditions described above.
3.4 Further preparation for the experiments
The biomass concentration of microalgal strain was determined by measuring the optical density at a wavelength of 680 nm with a UV–visible spectrophotometer. The calibration curve demonstrated that: (i) there is a strong linear relationship between the concentration of the DCW of the algae and its corresponding OD-680 that can be expressed as follows DCW = 0.3292 (OD-680) + 0.0192 with accuracy measured by R2 = 0.9827. (ii) there is a strong linear relationship between the concentration of the CD of the algae and its corresponding OD-680 that can be expressed as follows CD = 19.527(OD-680) −1.1981 with accuracy measured by R2 = 0.9912.
In order to determine the algicidal activity of strain ACCC-19853 against FACHB-2263 in all experimental groups, the following formula was used (Sankar et al., 2014). where FI-experimental is the fluorescence intensity of the treated algal culture and FI-control is the fluorescence intensity of the control algal culture. The CD and TC of all experimental conditions are measured as indicators for algal growth.
The TC is calculated according to Porra (2005). Briefly, 2 ml of the N. palea algae sample is centrifuged at 4000×g for five minutes in a pellet, after that supernatant is discarded, 3 ml of methanol is added to the pellet, and the tube is boiled for 5 min under dark conditions. Then, the sample is transferred into a new centrifuge tube, which covers with aluminum foil and kept on an ice bath, and the lysate is removed by centrifuging the sample at over 5000×g for six minutes. Chlorophyll absorbance’s at 665.2 nm and 652 nm are measured by a UV–Visible spectrophotometer for chlorophyll quantification. Methanol is used as a blank solution. Chlorophyll concentrations are calculated by the following equations (Porra, 2005)
Chlorophyll-a = 16.29 (E-665.2) – 8.54 (E-652).
Chlorophyll-b = 30.66 (E-652) – 13.58 (E-665.2).
TC = 22.12(E-652) + 2.71(E-652).
4 Statistical strategies and the corresponding discussions
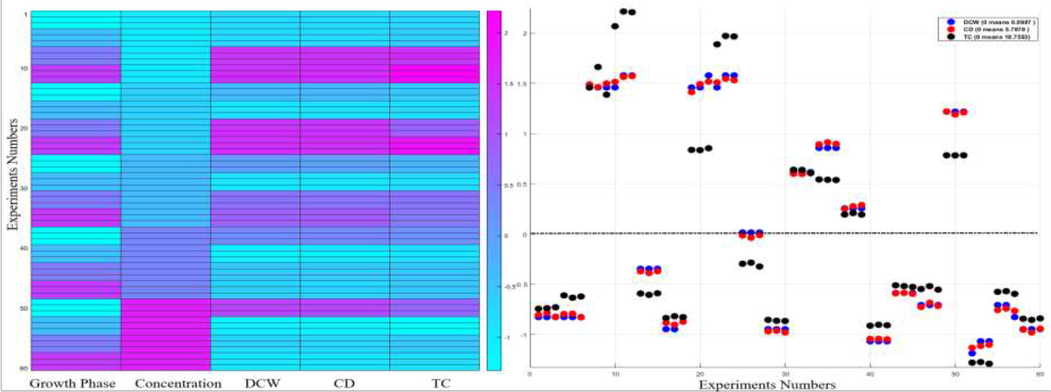
In this section, some statistical strategies are used and the corresponding discussions are given for each stage of the above-mentioned three stages experiments in this work. The bar graphs to investigate the behaviors of the means with error bars (standard deviations) for the three output factors CD, DCW, and TC under three replicates of each level-combination for all the possible level-combinations of the levels of the two input factors are given for the first-stage, second-stage and third-stage experiments in Figs. 1A, 2A and 3B, respectively. Error bars measure how far the triplicate values are spread out from their mean values. The behavior of the two input factors and the three output factors, the corresponding linear relationships among these five factors and the accuracy (via the Pearson correlation coefficient that is denoted as r) of these linear relationships among the factors are investigated for the first-stage, second-stage and third-stage experiments in Figs. 1A, 2A and 3A, respectively.
Since the factors have different scales, standardization (subtraction of the mean, division by the standard deviation of all the values) puts the factors on the same scale to give a clear comparison study among them. A heat map is a graphical representation of the data that uses a system of color-coding to represent different values, which provides an immediate visual summary of information. The “hot” sections represent high values, and the “cold” sections represent low values of a given factor. The heat maps of the first-stage, second-stage and third-stage experiments are given in Figs. 1B, 2B and 3C, respectively. The distribution plot investigates the distribution of the actual (normalized) values of a given factor about its mean. The dots (normalized values) below zero represent the actual values that are less than the mean. The dots (normalized values) above zero represent the actual values that are greater than the mean. The distribution plots of the first-stage, second-stage and third-stage experiments are given in Figs. 1B, 2B and 3C, respectively. Moreover, the relationships between the growth inhibition rates (%) of the CD as a function of the input factors are given for the first-stage, second-stage and third-stage experiments in Figs. 1C, 2C, and 3D, respectively. Table 1 gives the analysis of variance (ANOVA) summary results for the three output factors CD, DCW and TC productions in FACHB-2263 exposed to different treatment, concentration and time of ACCC-19853. The factor has a significant effect on the productivity at p < 0.05. It is worth mentioning that statistically significant results of ANOVA (p < 0.05) indicate that not all of the group means are equal. However, ANOVA results do not identify which particular differences between pairs of means are significant. Post hoc tests are used to explore differences between multiple groups’ means while controlling the experiment-wise error rate.
4.1 Results and discussions for the first-stage experiment
The interactions between co-cultures are used to examine the formation of the growth activities of the diatom under different bacterial cell concentrations at different time intervals that were grew well in laboratory culture. The results in Figs. 1A-1C and Table 1 for this stage demonstrate that:
-
The FACHB-2263 grows when increasing the concentration of the ACCC-19853 (104, 106 and 108 CFU/ml−1). The agreements to significant (p < 0.05) decreased on the CD, DCW and TC concerning time (12, 24, 48 and 96 h). The lowest means of the CD and DCW are 0.6889 × 10⁶ cells/ml and 0.0126 g/l, respectively at time 96 h and concentration 108 CFU/ml−1. The TC production generally decreases with increasing the concentrations of the ACCC-19853 strains from 48 h after exposure to the highest concentrations of bacterial strain, resulted in complete growth inhibition.
-
The CD, DCW and TC are correlated with the bacterial concentration (treatment) and the time during the co-cultivation condition. The CD and the DCW have the same behavior with the time and the concentration of the bacteria. There is a positive weak linear relationship ) between the CD (DCW) and the time. There is a negative linear relationship ( ) between the CD (DCW) and the concentrations of the bacteria. There is a negative linear relationship ( ) between the TC and the concentrations of the bacteria. There is a positive linear relationship ( ) between the TC and the CD that can be given as follows TC = 3.93 + 3.21CD. The accuracy of this equation is measured by R2 = 0.6. There is a positive linear relationship ( ) between the TC and the DCW that can be given as follows TC = 3.77 + 192.27 DCW. The accuracy of this equation is measured by R2 = 0.6.
-
There is a very low algicidal activity in the concentrations of 104 CFU/ml−1 at 96 h. When the amount-exceeded concentration of 106 CFU/ml−1, the CD intensity in the treatment groups significantly decreases compared to the control group, and the algicidal rates in 12, 24, 48, and 96 h are 9.03, 25.4, 31.5 and 44.3%, respectively for 106 CFU/ml−1, while for 108 CFU/ml−1 are 18.6, 30, 50.3 and 62.8%, respectively. In this co-culture, the bacterial number increases over a period of 96 h, but the efficiency of the FACHB-2263 growth decreases based on the analysis of the concentration of the CD, DCW and TC. The inhabitation efficiency increases dramatically with increasing the concentrations of the ACCC-19853 strains, and it reaches the maximum value at 96 h. The ACCC-19853 strain has algicidal activity when the time increases, the percentage of the CD decreases dramatically. Therefore, we chose an experimental concentration of 108 CFU/ml−1 as the ACCC-19853 strain for the follow-up experiments. Follow-up experiments are needed in many cases to get more information about the behavior of the studied phenomenon and break the confounding among the input factors to effectively estimate their effects (Elsawah, 2016; Elsawah and Qin, 2017).
4.2 Results and discussions for the second-stage experiment
The CD, DCW, and TC content in the FACHB-2263 concerning the ACCC-19853 extract treatment are investigated. In addition, all the phases of the FACHB-2263 cell cycle (lag, exponential and stationary) are treated with the ACCC-19853 strain crude extracted with different concentrations observed in the control cultures. The results in Figs. 2A-2C and Table 1 for this stage demonstrate that:
-
When compared with the control, the dose-dependent treated group showed a significant decrease at 24 h after adding the crude extract under which the CD, DCW, and TC continually declined for the duration of the experiment. A prompt CD reduction is observed with the ACCC-19853 extract when higher concentration (100 ml), at lag, exponential and stationary phase the CD contents recorded 0.27, 2.06, and 1.05 × 10⁶ cells/ml, respectively, when compared with the control. For the DCW and TC, the same effect when higher concentrations (100 m1) at 24 h exposure of crude extract are recorded 0.01, 0.04, and 0.02 g/l and 7.08, 13.48 and 11.06 mg/l, respectively when compared with the control.
-
There is a strong positive linear relationship ( ) between the TC and the CD that can be given as follows TC = 8.53 + 1.77CD. The accuracy of this equation is measured by R2 = 0.92. There is a strong positive linear relationship ( ) between the TC and the DCW that can be given as follows TC = 8.4 + 105.02 DCW. The accuracy of this equation is measured by R2 = 0.92. The TC has a positive weak linear relation ( ) with the growth phase and a negative, weak linear relation ( ) with the time.
-
The crude extract at higher concentration (100 ml) inhibited the growth rate of the FACHB-2263 efficiency by 91.2% at stationary phase showed highly active followed by lag phase (88.5%) and exponential phase (82.5%). Whereas the lower concentrations (12.5 ml) exhibited decreased inhibition at the lag phase (25.5%) showed a high growth inhibition rate compared with the stationary and exponential phases, respectively. Bacterial inhibition is too short, or the algae density is still too low to occur because some algae bacteria have been shown to kill senescent algae cells only in the lag phase (Lian et al., 2021).
4.3 Results and discussions for the third-stage experiment
We next examined to understand the ability of the strains ACCC-19853 and FACHB-2263 to grow successfully under controlled co-cultivation under laboratory conditions. The results of this stage in Figs. 3A-3D and Table 1 demonstrate that:
-
The algicidal activity of the different ratio concentrations of the cultures is reflected in the intensity of the algal CD even lower concentration of the ACCC-19853 with a higher concentration of the FACHB-2263 showed the algicidal activity compared with the intensity in the control group.
-
The CD and DCW have the same linear behavior ( ). The CD and DCW have a negative weak linear relationship ( ) with the time. There is a strong positive linear relationship ( ) between the CD and the algae that can be given as follows CD = 0.18–0.55Aalgae. The accuracy of this equation is measured by R2 = 0.85 and mean square error (MSE) = 3.63. There is a strong negative linear relationship ( ) between the CD and the bacteria that can be given as follows CD = 17.1–0.18Bacteria. The accuracy of this equation is measured by R2 = 0.85 and MSE = 3.63. There is a strong positive linear relationship ( ) between the DCW and the algae that can be given as follows DCW = 0.003Algae-0.008. The accuracy of this equation is measured by R2 = 0.85 and MSE = 0.001. There is a strong negative linear relationship ( ) between the DCW and the bacteria that can be given as follows DCW = 0.29–0.003Bacteria. The accuracy of this equation is measured by R2 = 0.85 and MSE = 0.001.
-
The means of the CD and DCW are decrease when the concentration of the bacteria increases, the concentration of the algae increases, and the time increases. The experimental condition (bacteria 10, algae 90 and time 0 h) has the maximum means of the CD and DCW. However, the experimental condition (bacteria 90, algae 10 and time 96 h) has the smallest means of the CD and DCW. The experimental condition (bacteria 40, algae 60 and time 0 h) has the maximum standard deviations of the triplicate of the CD and DCW, i.e., the triplicate of the CD and DCW have significant differences.
-
The CD and DCW have the same normalized values. When the concentration of the bacteria is more than (less than) 50 ml, the CD will be less than (more than) 8.27. When the concentration of the algae is more than (less than) 50 ml, the CD will be more than (less than) 8.27. When the concentration of the bacteria is more than (less than) 50 ml, the DCW will be less than (more than) 0.14. When the concentration of the algae is more than (less than) 50 ml, the DCW will be more than (less than) 0.14.
-
The percentage of the CD has positive relations with the concentration of the bacteria and time and negative relations with a concentration of the algae. That is, when the concentration of the bacteria increases, the percentage of the CD increases; when the concentration of the algae increases, the percentage of the CD decreases; and when the time increases, the percentage of the CD increases. Growth inhibition efficiency results revealed that when the concentration of the ACCC-19853 and time increase, the percentage of the CD decreases. The algicidal rate of the treatment groups with the concentrations of the bacteria: algae (90:10, 80:20, 70:30, 60:40, 50:50 40:60, 30:70, 20:80 and 10:90) reached 96.4, 88.7, 79.4, 76.2, 70.5, 24.6, 23.7, 21.2 and 17.3%, respectively,
-
The concentration, time and the interaction between them have a significant effect (significant difference in means) on the CD and DCW. Post hoc tests show significant differences between the means of any two hours and any two concentrations.
-
Moreover, the TC in the algal cells was significantly decreased under the effect at different ratio concentrations of algicidal culture (p < 0.05) from 48 h of treatment, and the maximum inhibitory effect of the bacterial culture is achieved within 96 h exposure. Most of the diatom cells lysed after adding the ACCC-19853 strain culture for 48 h and the microalgae culture faded to white color.
5 Discussions
In recent years, many studies have reported an antagonism or competitive relationship between bacteria and phytoplankton. The existence of bacteria will inhibit the growth of microalgae. It was concluded that the bacteria is a kind of algicide, which can be used against algae bloom, suggesting they may implement algae bloom bio-control (Yang et al., 2012) because they have similar growing conditions, and some natural waters are the best places for bacterial breeding. However, species specificity of the algicidal effect will also exist when the bacteria and algae co-cultivation system applies to the real algae bloom cases. We should decide the bacteria species according to the actual situation and choose the P. chlororaphis harmless bacteria that have the highest inhibition efficiency and do not influence humans, the environment, and wildlife (Anderson et al., 2012; Chen et al. 2014; Lee et al. 2013).
In our investigation, ACCC –19853 strain was added into FACHB –2263 cultures at different concentrations, phases, and ratios. The results exhibited high algicidal activity against FACHB –2263 in all our controlled associate co-cultures experiments through the observed value of the co-culture were measured to reflect the algal biomass; cell density and chlorophyll decreased obviously in high concentrations of the bacterial culture, and extract concentration were even more efficient (Zhang et al. 2014). Similar to different algae growth cell cycle experiments with bacterial extract, the mean of CD, DCW, and TC was significantly lower than that of the control at the end of the incubation period. The present study indicated that application of low bacterial extract concentrations (12.5 ml) to FACHB-2263 cultures was almost identical, and only a small variation was noted in the exponential and stationary phase but, progressive increases in bacterial crude extract concentration (25, 50, and 100 ml) resulted in the algal growth inhibition rate being significantly higher (P < 0.05). Negative effects on algal growth were detected. To further investigate the artificial microalgal-bacterial consortium, we explored the bacterial effect on diatom enhanced with the different combinations of ACCC-19853 and FACHB-2263 at the different ratios described above. CD and DCW are commonly used to monitor the growth and inhibition rate. The results revealed that all the combinations and the diatom cells destructed after 96 h and caused the death of the cells. These co-cultures also exhibited a more rapid marked difference in diatom cell density than cultures grown in controls in all our experiments.
From the above discussions, we conclude that the algicidal bacterium ACCC-19853 strain induces continuous stressing, making the significant decrease of chlorophyll in algal cells, leading to the dysfunction and disruption of the photosynthesis rate can reduce. Consequently, this will affect the physiological function of the algal cell because there is no substrate for energy to maintain the life of the cell growth. These results demonstrated that implied that dysfunction of the photosynthesis system was the most fundamental reason for algal cell death. (Shunmugam et al., 2014; Vardi et al., 2009). Therefore, this line of research is of particular interest as it can challenge conventional views. Additionally, laboratory microcosms revealed a significant decrease in all the experiments, especially the algae bacterial ratio. In total, there was a decrease in diatom density with a concomitant increase in bacteria cell growth and diatom abundances and eventually, cause algal cell death. Nevertheless, in this study, the mechanism by which bacteria inhibit algae growth has not been explored. Maybe some other metabolites from selected bacteria reasons were able to cause the algal cell death. Kim et al., 2018 reported that the allelochemicals urocanic acid, cytidine 2′,3′-cyclic phosphate, uridine 2′,3′-cyclic phosphate could cause growth inhibition in Phaeodactylum tricornutum. However, there were some limitations in the process of the experiment. Initially, we predict that the interaction between P. chlororaphis ACCC-19853 and N. Palea FACHB-2263 can be mutualistic, antagonistic, or shift between both. Using this measurement in the algal growth curve, there was no mutualistic phase, but we cannot surmise that there was no mutualistic phase in the first days. Besides, the products of bacteria may have affected the determination of chlorophyll and cell density concentration.
Thus, this work enhances our understanding of the relationship between algal cell structures and algicidal substances during degradation of the diatom N. Palea FACHB-2263 and may provide a new strategy for controlling harmful blooms of this common freshwater diatom bloom. Because this bacterial strain inhibits the photosynthesis rate efficiency while increasing concentration cause algal cell lysis were identified in our experiment and to destruct the structures of algal cells. So, put these bacteria directly or extract them in the affected water ecosystem and control the algae bloom phenomenon. However, the potential applications of these algicide bacteria to control harmful algae blooms in nature will require extensive research and ensure collateral damage to another aquatic organism.
6 Conclusions and future work
P. chlororaphis ACCC-19853 and its extract showed a potent inhibition effect on N. Palea FACHB-2263. This antagonistic symbiosis in the algae and bacterial co-culture systems provides a new idea for water bloom treatment. As a new kind of algicide, bacteria have the advantages of strong specificity and no pollution to water. It can also be used in laboratories to kill specific algae. Because some bacteria have more strict growth conditions, they are easier to remove in subsequent treatments. The results indicate that in the practice of artificial consortia algal-bacterial symbiotic system, the bacterial activity in the algal community should be considered. If harmful algae are present, the inoculum where these bacteria are present decreases the growth of algae cultivation. Even more interesting, algicide bacterial strains may be supplemented as a new means to improve active compound and culture stability, thus proven to be an effective and promising system for microalgae bloom control treatment algal-bacterial symbiotic system extrapolated for novel algae bloom control treatment. Studying the symbiosis of bacteria and algae in nature is a hot topic in environmental science, it can help people use certain symbiotic relationships to grow beneficial algae or eliminate harmful algae.
The above-mentioned results show that, the input factors and responses are often not linearly related and thus, conventional statistical tools might not be enough to derive functional knowledge. Recently, Balaji Prasath et al. (2021b) used linear, polynomial, spline and Kriging models for modeling and optimization of the effect of abiotic stressors on the productivity of the biomass, chlorophyll and lutein in microalgae Chlorella pyrenoidosa. Finally, Vishwakarma et al. (2020) and Vishwakarma et al. (2021) used neural network techniques to detect the outliers (i.e., observations that deviates significantly from other data) from the collected data that is an important step before modeling and analyzing the data. Therefore, in this future work, some efficient methods from various perspectives, such as, random forest regression, AdaBoost regression, spline model, Guassian Kriging model and various neural network techniques, will be employed to detect outliers from the collected data and develop predictive models for remaining free-outliers data of this study.
Acknowledgements
The authors thank the Editor-in-Chief Professor Omar Al-Dossary and the three referees for the constructive comments that lead to significant improvement of this paper. Elsawah’s work was partially supported by the Beijing Normal University-Hong Kong Baptist University United International College Research Grants (Nos. R201810, R201912 and R202010) and the Zhuhai Premier Discipline Grant.
Declaration of Competing Interest
The authors declare that they have no known competing financial interests or personal relationships that could have appeared to influence the work reported in this paper.
References
- Progress in understanding harmful algal blooms: paradigm shifts and new technologies for research, monitoring, and management. Annu. Rev. Mar. Sci.. 2012;4(1):143-176.
- [CrossRef] [Google Scholar]
- Coagulant Plus Bacillus nitratireducens fermentation broth technique provides a rapid algicidal effect of toxic red tide dinoflagellate. J. Mar. Sci. Eng.. 2021;9:395.
- [CrossRef] [Google Scholar]
- Modeling and optimization of the effect of abiotic stressors on the productivity of the biomass, chlorophyll and lutein in microalgae Chlorella pyrenoidosa. J. Agric. Food Res.. 2021;5:100163.
- [CrossRef] [Google Scholar]
- Sensitivity of biochemical markers to evaluate cadmium stress in the freshwater diatom Nitzschia palea (Kützing) W. Smith. 2010;99(2):109-117.
- [CrossRef] [Google Scholar]
- Master recyclers: features and functions of bacteria associated with phytoplankton blooms. Nat. Rev. Microbiol.. 2014;12(10):686-698.
- [CrossRef] [Google Scholar]
- Harmful algal blooms and eutrophication nutrient sources, composition, and consequences. Estuaries. 2002;25(4):704-726.
- [Google Scholar]
- First report of Pseudobodo sp, a new pathogen for a potential energy producing algae: Chlorella vulgaris Cultures. PLoS ONE. 2014;9(3):e89571.
- [CrossRef] [Google Scholar]
- Constructing optimal asymmetric combined designs via Lee discrepancy. Statistics Probability Lett.. 2016;1181:24-31.
- [Google Scholar]
- Choice of optimal second stage designs in two-stage experiments. Comput. Stat.. 2018;33(2):933-965.
- [Google Scholar]
- Constructing optimal router bit life sequential experimental designs: new results with a case study. Commun. Stat. Simul. Comput.. 2019;48(3):723-752.
- [Google Scholar]
- Building some bridges among various experimental designs. J. Korean Stat. Soc.. 2020;49(1):55-81.
- [Google Scholar]
- An appealing technique for designing optimal large experiments with three-level factors. J. Comput. Appl. Math.. 2021;384:113164.
- [CrossRef] [Google Scholar]
- Multiple doubling: a simple effective construction technique for optimal two-level experimental designs. Statistical Papers. 2021;62(6):2923-2967.
- [CrossRef] [Google Scholar]
- Designing optimal large four-level experiments: a new technique without recourse to optimization softwares. Commun. Math. Statistics 2021
- [CrossRef] [Google Scholar]
- Optimum mechanism for breaking the confounding effects of mixed-level designs. Comput. Statistics. 2017;32(2):781-802.
- [Google Scholar]
- New recommended designs for screening either qualitative or quantitative factors. Statistical Papers. 2021;62:267-307.
- [Google Scholar]
- Eutrophication and harmful algal blooms: a scientific consensus. Harmful Algae. 2008;8(1):3-13.
- [Google Scholar]
- Jeong, H.J., Kim, J.S., Yoo, Y.D., et al., 2008. Control of the harmful alga Cochlodinium polykrikoides by the naked ciliate Strombidinopsis jeokjo in mesocosm enclosures. Harmful Algae, 7(3):368–77.
- Antidiatom activity of marine bacteria associated with sponges from SanJuan Island, Washington. World J. Microbiol. Biotechnol.. 2014;30(4):1325-1334.
- [Google Scholar]
- Biological control of Stephanodiscus hantzschii (Bacillariophyceae) blooms in a feld mesocosm by the immobilized algicidal bacterium Pseudomonas fuorescens HYK0210-SK09. J. Appl. Phycol.. 2012;25(1):41-50.
- [CrossRef] [Google Scholar]
- Field assessment of the potential of algicidal bacteria against diatom blooms. Biocontrol. Sci. Tech.. 2011;21(8):969-984.
- [CrossRef] [Google Scholar]
- Metabolomics analysis of Pseudomonas chlororaphis JK12 algicidal activity under aerobic and micro-aerobic culture condition. AMB Express. 2018;8(1):131.
- [CrossRef] [Google Scholar]
- Utilizing the algicidal activity of aminoclay as a practical treatment for toxic red tides. Sci. Rep.. 2013;3(1)
- [CrossRef] [Google Scholar]
- Different co-occurring bacteria enhance or decrease the growth of the microalga Nannochloropsis sp. CCAP211/78. Microb. Biotechnol.. 2021;14(3):1159-1170.
- [CrossRef] [Google Scholar]
- Enhanced fluorescent siderophore biosynthesis and loss of phenazine-1-carboxamide in phenotypic variant of Pseudomonas chlororaphis HT66. Front Microbiol. 2018;9:759.
- [Google Scholar]
- Porra, R.J., 2005. The chequered history of the development and use of simultaneous equations for the accurate determination of chlorophylls a and b, in Discoveries in Photosynthesis. 2005, Springer. p. 633-640.
- Growth inhibition of bloom forming cyanobacterium Microcystis aeruginosa by green route fabricated copper oxide nanoparticles. Environ. Sci. Pollut. Res.. 2014;21(24):14232-14240.
- [CrossRef] [Google Scholar]
- Zooming in on the phycosphere: the ecological interface for phytoplankton-bacteria relationships. Nat. Microbiol.. 2017;2:17065.
- [CrossRef] [Google Scholar]
- Secondary metabolite from Nostoc XPORK14A inhibits photosynthesis and growth of Synechocystis PCC 6803. Plant Cell Environ.. 2014;37:1371-1381.
- [CrossRef] [Google Scholar]
- Skerratt, J., Bowman, J., Hallegraef, G., James, S. and Nichols, P., 2002. Algicidal bacteria associated with blooms of a toxic dinofagellate in a temperate Australian estuary. Mar Ecol Prog Ser 244:1–1.
- Rosa Trobajo, Ester Clavero, Victor A. Chepurnov, Koen Sabbe, David G. Mann, Satoru Ishihara, and E. J. C., 2009. Morphological, genetic and mating diversity within the widespread bioindicator Nitzschia palea (Bacillariophyceae). Phycologia, 48(October), 443–459. doi:10.2216/08-69.1.Nitzschia.
- Viral glycosphingolipids induce lytic infection and cell death in marine phytoplankton. Science. 2009;326(5954):861-865.
- [Google Scholar]
- An algorithm for outlier detection in a time series model using backpropagation neural network. J. King Saud Univ.-Sci.. 2020;32(8):3328-3336.
- [Google Scholar]
- A hybrid feedforward neural network algorithm for detecting outliers in non-stationary multivariate time series. Expert Syst. Appl.. 2021;184:115545
- [Google Scholar]
- Harmful algal blooms and climate change: learning from the past and present to forecast the future. Harmful Algae. 2015;49:68-93.
- [Google Scholar]
- Environmental science. Rethinking the marine carbon cycle: factoring in the multifarious lifestyles of microbes. Science. 2015;347(1257594)
- [CrossRef] [Google Scholar]
- The role of starvation in biomass harvesting and lipid accumulation: co-culture of microalgae-bacteria in synthetic wastewater. Thrombosis Haemostasis. 2016;35(1):103-109.
- [CrossRef] [Google Scholar]
- Bacterial community dynamics during a bloom caused by Akashiwo sanguinea in the Xiamen sea area, China. Harmful Algae. 2012;20:132-141.
- [CrossRef] [Google Scholar]
- Novel insights into the algicidal bacterium DH77-1 killing the toxic dinoflagellate Alexandrium tamarense. Sci. Total Environ.. 2014;482–483:116-124.
- [CrossRef] [Google Scholar]
- Fast-growing algicidal Streptomyces sp. U3 and its potential in harmful algal bloom controls. J. Hazard. Mater.. 2018;341:138-149.
- [Google Scholar]
- Streptomyces alboflavus RPS and its novel and high algicidal activity against harmful algal bloom species Phaeocystis globosa. PLoS ONE. 2014;9(3):e92907.
- [CrossRef] [Google Scholar]
- Zhang, H.J., An, X.L., Zhou, Y.Y., et al., 2013. Effect of oxidative stress induced by Brevibacterium sp. BS01 on a HAB causing species-Alexandrium tamarense. PLoS ONE 1, 5(8):e63018.
- A novel method to harvest microalgae via co-culture of filamentous fungi to form cell pellets. Bioresour. Technol.. 2012;114:529-535.
- [CrossRef] [Google Scholar]
Appendix
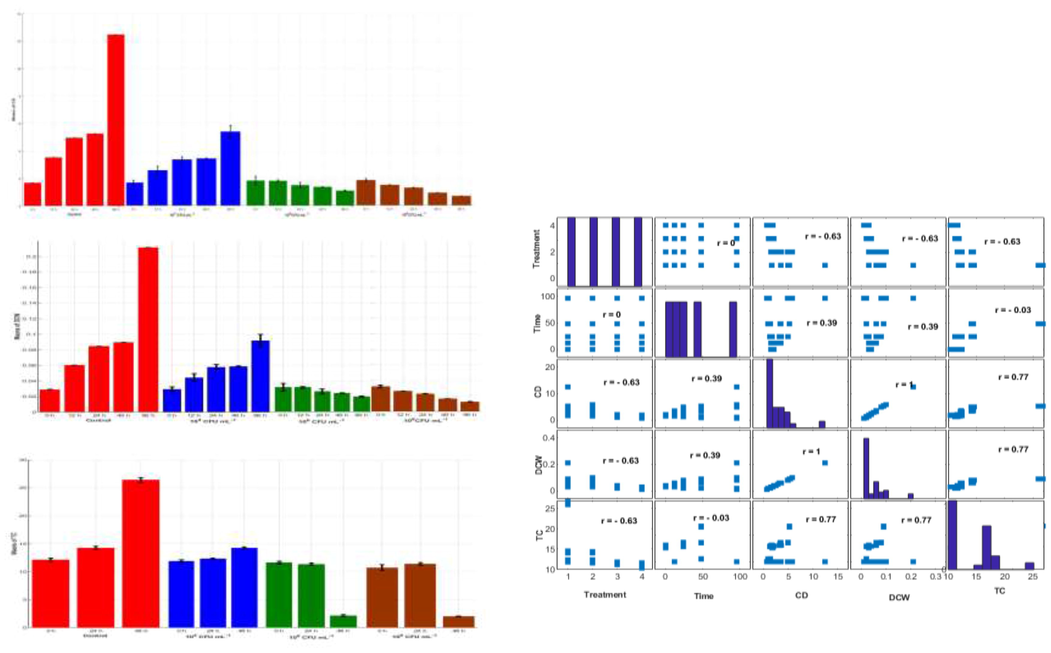
Bar graphs on the left side depict the behaviors of the means with error bars (standard deviations) of the triplicate experiments of each condition from all the 20 combinations of the time (0, 12, 24, 48, 96 h) with each bacteria concentration (control, 104, 106, 108 CFU/ml−1) for the outputs CD (x106 cells/ml), DCW (g/l) and TC (mg/l). Bars are colored to match with treatment groups. Error bars measure how far the triplicate values are spread out from their mean value. Right hand side graph provides the linear relationships among the variables, which are measured by Pearson correlation coefficient (r). The sign and value of r describe the direction and the power of the relation between the variables, respectively.
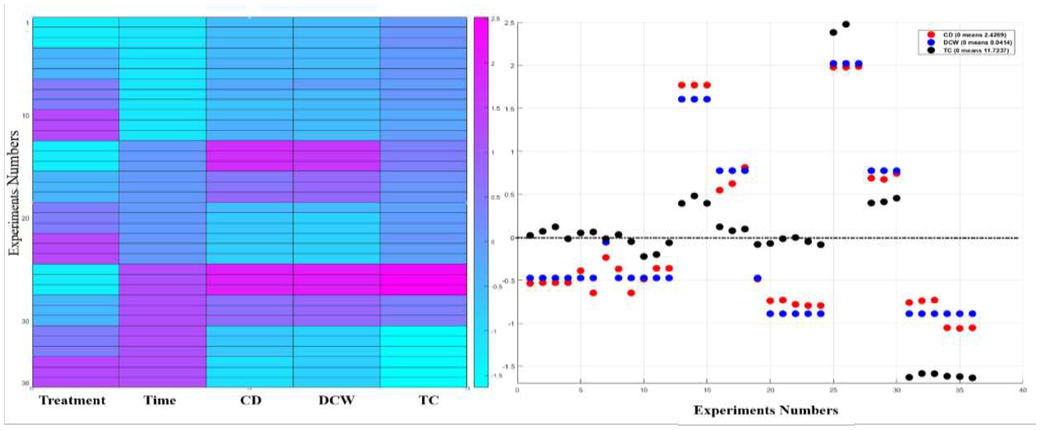
Left: Heat map analysis of the normalized (standardized) values (subtraction of the mean, division by the standard deviation of all the 36 values) of the variables bacteria concentration (treatment), time, CD, DCW and TC. Standardization is the process of putting different variables on the same scale to give a clear comparison study between them. A heat map is a graphical representation of data that uses a system of color-coding to represent different values, which provides an immediate visual summary of information. The “hot” sections represent high values, and the “cold” sections represent low values of the given variable. Right: The dots distribute the 36 actual (normalized) values of the variable about its mean (zero, dashed line). The dots (normalized values) below zero represent the actual values that are less than the mean. The dots (normalized values) above zero represent the actual values that are greater than the mean.
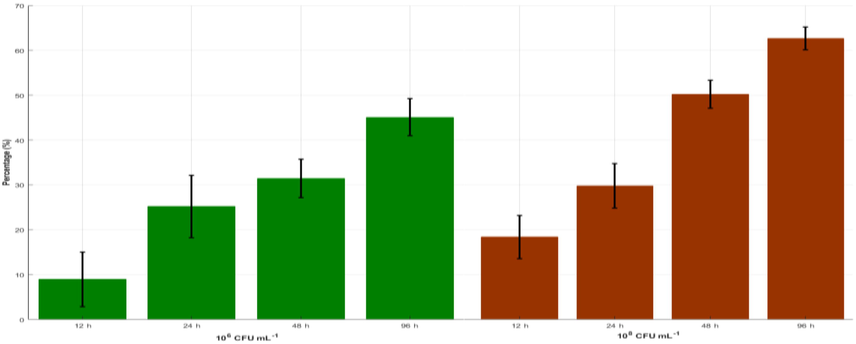
As a function of different bacterial concentration on the growth of FACHB 2263 culture growth inhibition efficiency (%). Percentages are averages with the standard deviation (error bars) of the triplicates of each experimental condition.
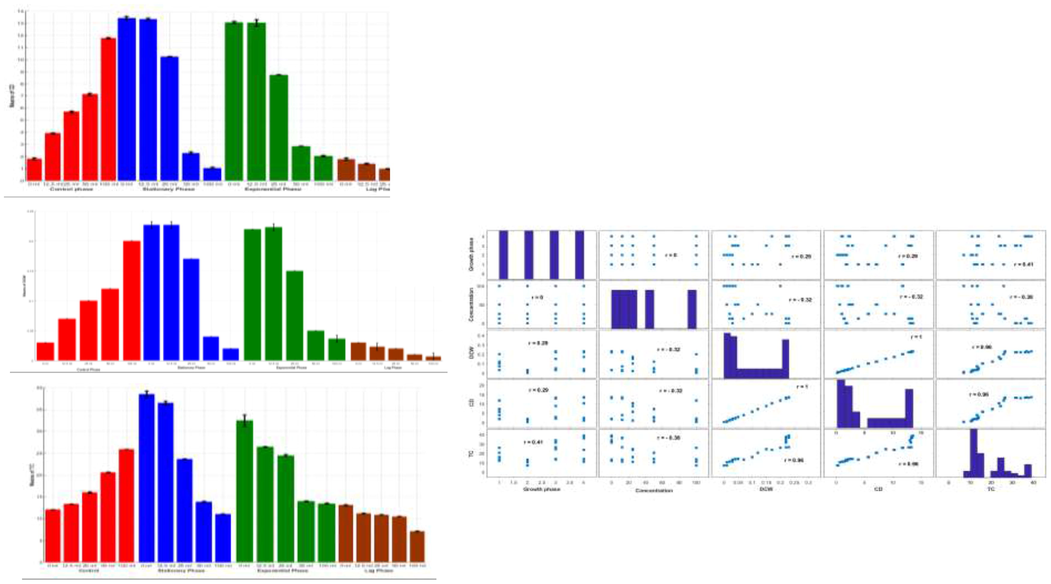
Bar graphs on the left side depict the behaviors of the means with error bars (standard deviations) of the triplicate experiments of each condition from all the 20 combinations of the bacteria concentration (0, 12.5, 25, 50, 100 ml) with each growth phase (control, stationary, exponential, lag) for the outputs CD (x106 cells/ml), DCW (g/l) and TC (mg/l). Bars are colored to match with treatment groups. Error bars measure how far the triplicate values are spread out from their mean value. Right hand side graph provides the linear relationships among the variables, which are measured by Pearson correlation coefficient (r). The sign and value of r describe the direction and the power of the relation between the variables, respectively.
Left: Heat map analysis of the normalized (standardized) values (subtraction of the mean, division by the standard deviation of all the 60 values) of the variables bacteria concentration (treatment), growth phase, CD, DCW and TC. Standardization is the process of putting different variables on the same scale to give a clear comparison study between them. A heat map is a graphical representation of data that uses a system of color-coding to represent different values, which provides an immediate visual summary of information. The “hot” sections represent high values, and the “cold” sections represent low values of the given variable. Right: The dots distribute the 60 actual (normalized) values of the variable about its mean (zero, dashed line). The dots (normalized values) below zero represent the actual values that are less than the mean. The dots (normalized values) above zero represent the actual values that are greater than the mean.
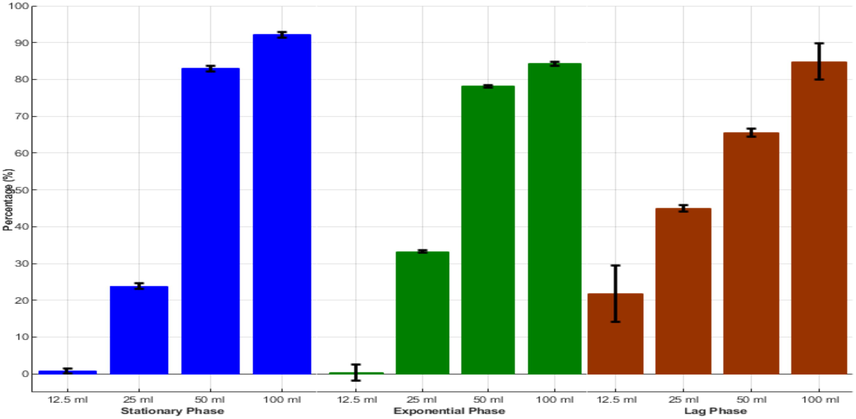
Growth inhibition rate (%) of FACHB 2263 as a function of different ACCC 19,853 bacterial extract concentrations (ml). Percentages are averages with the standard deviation (error bars) of the triplicates of each experimental condition.
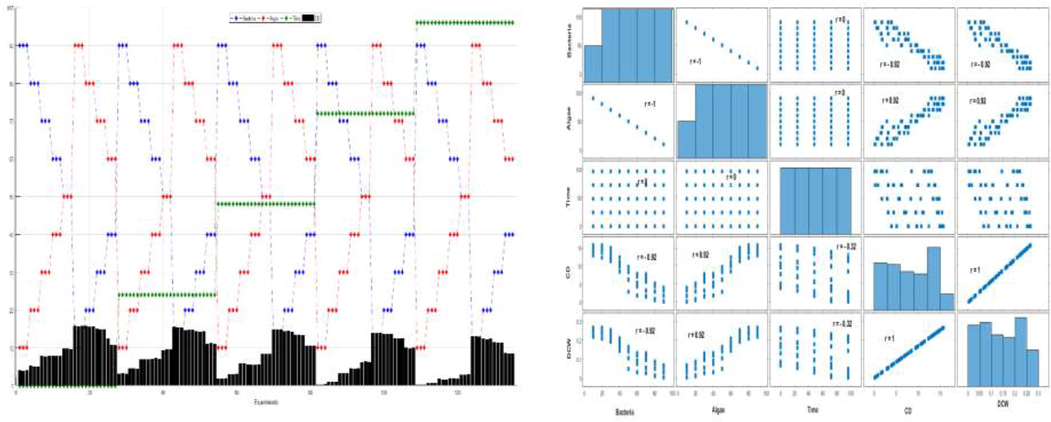
Left: The behaviors of the actual variables of CD (×106 cells/ml) abundance as a function of time in bacteria and algae ratio co-cultures of ACCC 19,853 (blue lines), FACHB 2263 (red line), time (green line) and bar plot (black) depicts increases in CD growth rate due to the presence of each strain ratio. Right hand side graph provides the linear relationships among the variables, which are measured by Pearson correlation coefficient (r). The sign and value of r describe the direction and the power of the relation between the variables, respectively. (For interpretation of the references to colour in this figure legend, the reader is referred to the web version of this article.)
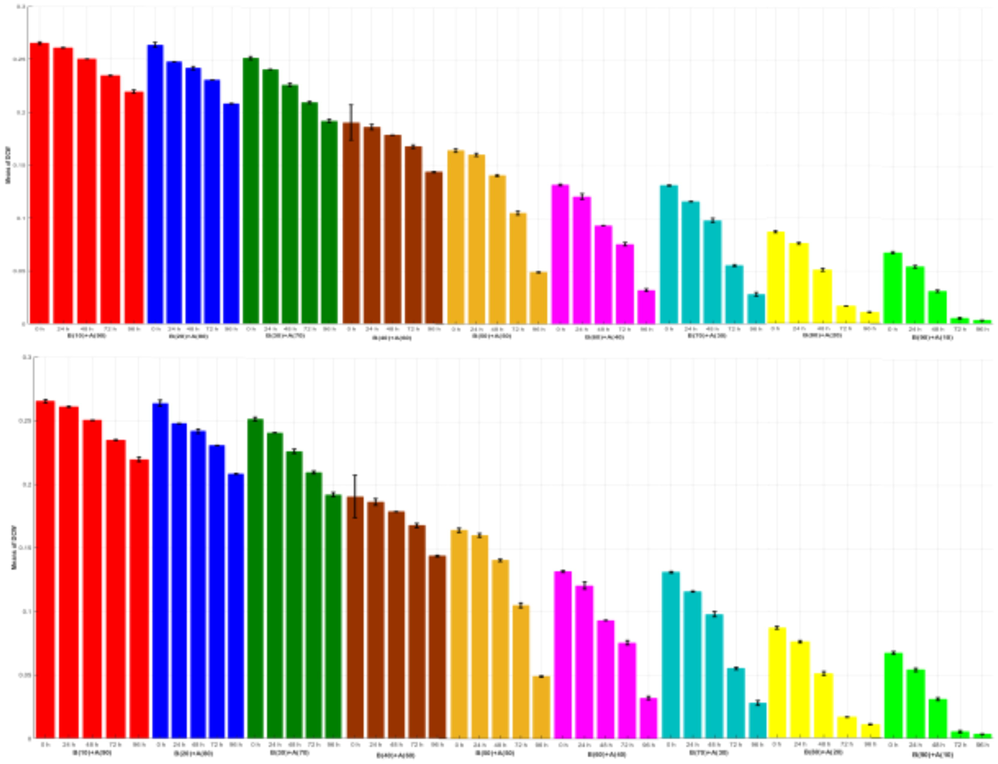
Bar graphs depict the behaviors of the means with error bars (standard deviations) of the triplicate experiments of each condition from all the 45 combinations of the time (0, 24, 48, 72, 96 h) with each growth algae and bacterial ratio concentration (10:90) for the outputs CD (x106 cells/ml) and DCW (g/l) and TC (mg/l). Bars are colored to match with treatment groups. Error bars measure how far the triplicate values are spread out from their mean value.
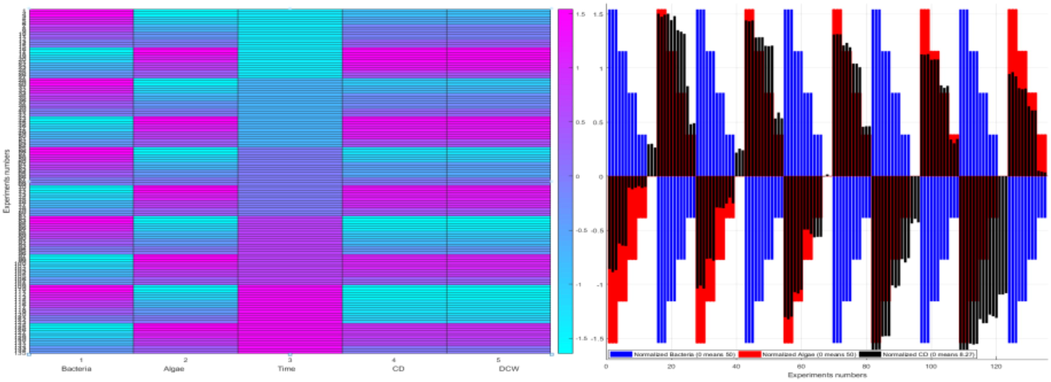
Heat map analysis of the normalized (standardized) values (subtraction of the mean, division by the standard deviation of all the 135 values) of the variables bacteria concentration, algae concentration, time, CD and DCW. Standardization is the process of putting different variables on the same scale to give a clear comparison study between them. A heat map is a graphical representation of data that uses a system of color-coding to represent different values, which provides an immediate visual summary of information. The “hot” sections represent high values, and the “cold” sections represent low values of the given variable. Right: The bars distribute the 135 actual (normalized) values of the variable about its mean (zero, dashed line). The bars (normalized values) below zero represent the actual values that are less than the mean. The bars (normalized values) above zero represent the actual values that are greater than the mean.
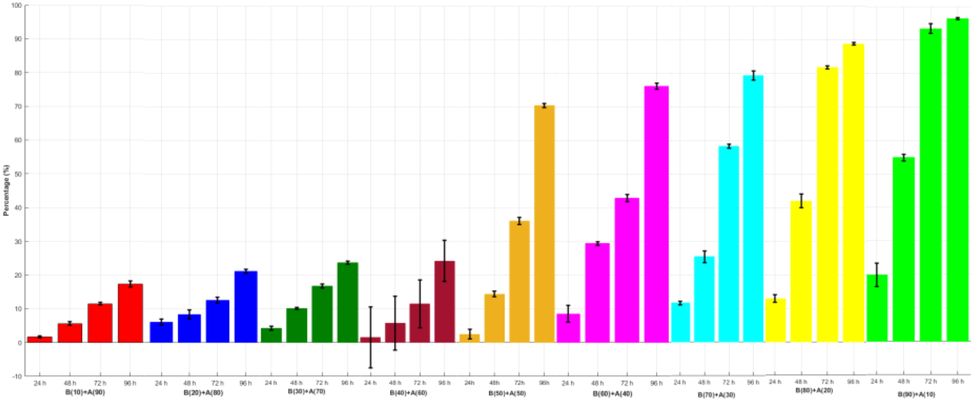
The relationships between growth inhibition rate (%) of CD as a function of different concentration Algae: Bacteria and Time. Percentages are averages with the standard deviation (error bars) of the triplicates of each experimental condition.
*EXP-k denotes k-stage experiment
Source
CD
CDW
TC
F
P-value
F
P-value
F
P-value
EXP-1
Treatment
2214.3
1.79E-44
2214.3
1.78E-44
2348.9
9.41E-30
Time
632.3
1.45E-35
632.3
1.45E-35
51.8
1.97E-9
Treatment * Time
496.3
1.57E-39
496.3
1.57E-39
1514.2
1.01E-29
EXP-2
Treatment
16832.7
4.78E-62
4686.7
5.85E-51
4419.5
1.89E-50
Concentration
5747.9
1.307E-54
1583.6
1.87E-43
1666.8
6.77E-44
Treatment * concentration
6187.2
2.2E-61
1694.6
3.801E-50
1456.2
7.84E-49
EXP-3
Treatment
13057.46
2.03E-134
13057.46
2.03E-134
–
–
Time
3122.36
1.31E-95
3122.36
1.31E-95
–
–
Treatment * Time
58.97
1.12E-47
58.97
1.12E-47
–
–


