

Translate this page into:
Statistical analysis of push and pull factors of migration: A case study of India
⁎Corresponding author. imran738@gmail.com (Md Imran Khan),
-
Received: ,
Accepted: ,
This article was originally published by Elsevier and was migrated to Scientific Scholar after the change of Publisher.
Peer review under responsibility of King Saud University.
Abstract
The migration from India with special reference to Bihar has a long history. Slaves from this area were sent to British colonies like Fiji, Mauritius, Guyana, and Suriname as Girmitiya during the British colonial period. During the early years of independent India, many people from this area moved to Calcutta and Assam, Later, in the aftermath of the green revolution, people relocated to the Punjab, Haryana, and the northern states in search of financial prosperity. In the new globalized world, people are either moving to cities like Maharashtra, Gujarat, Kolkata, and Chennai, or to countries in the Gulf. Therefore, it becomes necessary to examine the major cause of migration from the research area towards the Gulf countries. The examination was quantitative and based on samples survey approach. To examine the objective and test the hypothesis, descriptive statistics, Principal component analysis, reliability analysis, and regression analysis were utilized. The study confirms that the push factor plays a significant role in people migrating. The major cause of migration was ‘lack of jobs’, ‘low wages’, ‘poor financial condition’, ‘debt. on the family’, ‘social insecurity’, & ‘social discrimination. Apart from the push factor, a few pull factors such as ‘better employment opportunities’, ‘improved living standard’, ‘personal development’, ‘presence of relatives’ & ‘attractive environment’ also plays a significant role in Gulf migration. The further result reveals that 41% of the migrants moved mainly by push factors, 6% by only push factors, 23% mainly by pull factors, 3% by only pull factors and 27% have chosen both factors as the cause of migration. The study also found that the marital status, age, family type, and religion of migrant workers are significant positive determinants of the length of their stay. On the other hand, the level of education and pre-migration income of migrant workers are significant negative determinants of the length of their stay.
Keywords
Gulf migration
Push factor
Pull factor
Bihar
Emigrants
Migrant workers

1 Introduction
Currently, India is the world's second most populous country, has the highest number of its citizens living outside the country (about 18 million), and is the leading recipient of remittances (USD 83 billion) in the year 2020. India and the United Arab Emirates are the third largest corridor in the world with over 3 million Indian migrant workers whereas India and Saudi Arabia are the 9th largest corridor globally (McAuliffe & Triandafyllidou, 2022). The migration from India with special reference to Bihar has a long history. In the 19th century, many people from this area moved to British colonies in the Caribbean like Fiji, Mauritius, Guyana, and Suriname to work on farms (sugarcane and rubber (Lal, 2016). An eastward migration pattern solidified in the second half of the nineteenth century. Assam's tea gardens attracted one group, while Calcutta attracted another. Many people left their rural homes and moved to the city of Calcutta, where they would work in urban factories (Datta, 2016). Despite the promise of a new beginning with independence (1947), Bihar has failed miserably to usher in the transformative changes that would speed up economic development and create a fair and equitable social structure (Rasul & Sharma, 2014). Because of this, a lot of people from this area moved to the agricultural lands of Punjab, Haryana, and northern India after the Green Revolution of the 1960 s. (Singh & Singh, 2006). As a result of modern farming techniques and shifts in cropping patterns, the local labour market has been saturated, therefore the region starts to supply labour for industrial purposes to Maharashtra, Gujrat, Kolkata, and Chennai (Tripathy & Raha, 2022). The trend of migration saw a significant change after the oil boom of 1970 s. Arab oil-producing nations began an enormous investment programme in their infrastructure, which led to an increase in the demand for labour. People began making their way to the Gulf countries from the southern part of India initially, and later, from the northern parts of India like Bihar and Uttar Pradesh (Oommen, 2016). There are several reasons for the migration of labour from Bihar to Gulf countries. One of the main reasons is the search for better economic opportunities and higher wages. Many people from Bihar are living in poverty and see employment opportunities in the Gulf to improve their economic situation (Haan, 1997). Another reason is the high demand for labour in the Gulf region, particularly in the construction and oil industries. The region has experienced significant economic growth in recent years, leading to a corresponding increase in demand for labour. This has created many employment opportunities for workers from India, including those from Bihar (Tripathi, 2020). However, the recent spread of the coronavirus has decreased the demand for labour and negatively affect the migrant workers there (Khan et al., 2021; Khan et al., 2023). Overall, the reasons for labour migration from India to Gulf countries are complex and multifaceted and are driven by a combination of economic, social, and cultural factors (Azhar, 2016).
2 Material & method
2.1 Review of literature
The decision to migrate is influenced by a variety of factors and is complex, making it difficult to generalize a single reason. Many studies were conducted in the context of different places and on different people to describe the major cause of migration. In most of the study economic factor is one of the strongest causes of migration. A study reported that better economic prospects and hope for finding better jobs, welfare plans, and a better living standard are the major cause of migration to Poland and Romania (Urbański, 2022). International migration towards developed countries in most cases is caused by the pull factors (Thet, 2014). Internal migration of labour to Punjab from Uttar Pradesh, Rajasthan, and Chhattisgarh to work in brick-kiln businesses had chosen better employment opportunities as the main cause of migration (Kainth, 2010). International migration of nurses especially from less developed countries and rural areas migrated because of professional advancement, higher earnings and better working circumstances in the host country that was not possible in their existing position or nation. The nurses from Jordan to Gulf countries were motivated by the almost same reasons (Al Nawafleh, 2015; Kingma, 2001). The migration of Sri Lankan professionals to Qatar is also motivated by the pull factor such as better perks and packages (Varkey, 2004). A study shows that the primary factors that make people move from Latin America to Spain are the country's economic growth and its favourable immigration policy. (Prieto & López, 2015). The host country's demand for an individual is also influenced by the individual with greater talents who manages their socioeconomic situation quite effectively (Kazlauskienė & Rinkevičius, 2006). The reasons behind the migration of women are difficult to comprehend due to their complexity. Marriage and other forms of institutionalization are two of the primary reasons women move away from their homes. Nevertheless, as time went on, an increase in the number of women who had an education led to a consequence in terms of their migration to escape from poverty, whilst women from societies that were financially stable migrated to become self-sufficient or rise in their social status (Iqbal & Gusman, 2015; Mitra, 2015). The study reported that the migration of Mongolians to the Republic of South Korea is a result of unemployment, an impermanent source of income, low wages, and social factors such as poor healthcare systems, and poor quality of life (Zanabazar et al., 2021). Another study of Bangladeshi immigration in West Bengal was also influenced by poverty, joblessness, and financial instability in their home country (Datta, 2004). Migration towards the cities from rural areas in India is also caused by natural disasters such as lack of work possibilities due to drought or flood (Sundari, 2005). The people's decision to migrate is sometimes also influenced by criminal activity, violence, lawlessness, and a general lack of social order in their home countries (Parkins, 2010). However, to make a decision to move, it is necessary to consider both push and pull elements simultaneously. Both the challenges faced in the place of origin and the opportunities presented in the destination country influence migration (Rasool et al., 2012).
2.2 Research gap
Many studies have been conducted concerning different areas and different people to explore the major cause of migration. However, very limited studies were found to deal with the problems and prospects of migrants from one of the poorest Indian states of Bihar towards the Gulf countries. Few studies were found that examined the psychological and socio-economic impact on Gulf migrant workers, ignoring the importance to understand the major cause of migration and their length of stay (Khan et al., 2021; Haan, 2002). This study will be an attempt to fill the gap in the literature by exploring the push and pull factors of migration.
2.3 Hypothesis
The study will investigate the following null hypothesis.
-
“Push factor is not a significant determinant of migration from Bihar to Gulf countries”.
-
“Pull factor is not a significant determinant of migration from Bihar to Gulf countries”.
-
“Pre-migration income, marital status, age, education, family type, religion and land ownership are not a significant determinant of length of stay in the Gulf countries”.
2.4 Research methodology
The current study investigates the pull and push factors influencing migration from Bihar to the Gulf countries and the determinants of the length of their stay. It is useful to note that 7.6 million Indians are living in the Gulf countries and Bihar contributes to around 18% of the total workforce (Emigration Clearance Data 2018–19), However, their share in the total remittance to India is below 2%. Therefore, it becomes necessary to examine the demographic characteristics of migrant workers and the major causes of their migration. The main reason to choose the sample study on migrants from Bihar was lacking in literature and most of the migrant workers are either unskilled or semi-skilled. The investigation was quantitative, and the findings are based on a representative sample. Based on the hypothesis and research objectives, the researcher has developed a questionnaire. The structured questionnaire was divided into two parts. Section 1 of the questionnaire asked about general migrant information such as their current age, level of education, religion, monthly income, number of dependents, remittance, and so on. The questionnaire's section 2 includes questions about the “pull” and “push” forces that cause people to move. The researcher used a five-point Likert scale ranging from “strongly disagree” to “strongly agree” to record responses to a survey that included 18 key causes of migration. The researcher used the standard formula to estimate the sample size. . (Cochran, 1977) where, Z = z score (1.96), e = margin of error (0.05), N = Population size (1,71,000), p = population proportion (0.5). The result of the sample size calculator was, a sample size = 385 with a 95% confidence level and 5% margin of error, therefore researcher has decided to collect a total sample of 400. A three-stage cluster sampling technique has been used for the selection of the sample households. In the first stage, the district with the highest number of migrants has been selected. In the second stage, the two blocks from each region and two villages from each block have been selected randomly. Furthermore, in the third stage, 25 migrant households have been selected randomly from each village. The researcher has conducted either a telephonic interview or a personal interview to collect the sample data.
The sample design is shown in Table 1. The “Statistical Package for Social Science” (SPSS) is used for many statistical analyses. These include descriptive statistics, principal component analysis, reliability analysis, and multivariate linear regression. Principal component analysis, a data reduction technique is used separately for push and pull factors to reduce the dimensionality of a data set by extracting the most important components. The model developed by (Sridhar et al., 2013) has been used to estimate the elements that most influence a person's decision to migrate to a Gulf country.
Districts
Region
Block
Village/Panchayat
Sample
Siwan
Maharaj GanjGoryakothi
Bahadurpur
25
Bahopur
25
Maharaj Ganj
Bagauchha
25
Aphrad
25
Siwan SadarBarharia
Rasulpur
25
Madhopur
25
Siwan Sadar
Khalispur
25
Maula Nagar
25
Gopalganj
Gopal GanjBarauli
Kalyanpur
25
Bishesarpur
25
Baikunthpur
Katalpur
25
Dharambari
25
HathuaPhulwaria
Bathua
25
Gidha
25
Hathua
Bagahi
25
Pipra
25
Yi = Number of pull options chosen/ Total number of reasons chosen
If Yi = 0; “Only Push”
0 < Yi < 0.5; “Mainly Push.”
< Yi < 1; “Mainly Pull.”
Yi = 0.5 “Both Push & Pull”
Yi = 1; “Only Pull”
A regression model is used to analyze the determinants of the length of stay of migrant workers from Bihar to the Gulf countries. Length of stay is the dependent variable which is defined in terms of year and pre-migration income, marital status, level of education, Family type, religion and land ownership are the independent variables in this analysis.
Yi = B0 + B1 pre-migration income + B2 marital status + B3 age + B4 education + B5 family type + B6 religion + B7 land ownership + ei.
3 Result & discussion
3.1 Demographic Profile of the Respondents
The demographic profile of the migrant workers plays a significant role to understand their socio-economic background. Table 2 shows that about 90% of the migrants in the sample are Muslims and that nearly two-thirds of them are under the age of 40. The state of Bihar, where the emigrants are from, has one of the lowest literacy rates in India. That's reflected in the levels of education held by the migratory labour force (Kumari, 2016; Rasul & Sharma, 2014). Roughly 22% of the migrants in the sample did not have any formal education, 29% were high school level of education, 15% of them had completed intermediate school, and 23% were graduates. However, only 9.5% of the migrants in the sample had any sort of post-graduation degree. The distribution of migrant workers by country of destination is also shown. Over half of the sample migrant workforce currently working in the Kingdom of Saudi Arabia. They find the United Arab Emirates and Qatar to be the second and third most appealing destination. Other desirable destinations for migrant workers include Kuwait (7%) and Bahrain (5%) and Oman (4%). Source: Calculated by Authors.
Variable
Demographics
Total
Percentage
Cumulative %
Below 40
266
66.50%
66.50%
Age
Above 40
134
33.50%
100.0%
Muslim
361
90.25%
90.25%
Religion
Hindu
39
9.75%
100.0%
Illiterate
20
5.00%
5.00%
Able to read & write
70
17.50%
22.50%
10th
118
29.50%
52.00%
Education
12th
60
15.00%
67.00%
Graduation
94
23.50%
90.50%
Post-Graduation
38
9.50%
100.0%
DestinationSaudi Arabia
216
54.00%
54.00%
UAE
62
15.50%
69.50%
Qatar
60
15.00%
84.50%
Kuwait
28
7.00%
91.50%
Bahrain
19
5.75%
97.25%
Oman
15
3.75%
100.0%
3.2 Push Factors of Migration: Factor Analysis and Reliability Analysis
The circumstances in one's own country that push someone to leave are known as push factors (Siyal et al., 2018). Migration from Bihar to the Gulf countries could be caused by several push factors, including but not limited to - poverty, unemployment, population explosion, inflation, poor infrastructure, low-paid jobs etc. Migration can also be caused by agriculture backwardness due to low productivity, drought, flooding, and other natural disasters. Community discrimination, low levels of education, poor medical infrastructure, and less industrialization can also play an important role in a person to migration (Khan, 2021). The economic factor of migration and the socio-cultural factor of migration are two broad categories that can be used to describe these causes. Recent studies have focused mostly on the economic factors of migration. To name just a few examples of economic push factors are low wages or salary, low agricultural production, lack of job prospects, limited industrialization, bad infrastructure, unemployment or underemployment, the struggle for one's livelihood, economic insecurity, etc. (Mihi-Ramirez & Kumpikaite, 2014). Socio-cultural factors are usually more difficult to study and take more time. The social and cultural parts of a society are much more complicated, and people on the edge of society often must take extreme steps to protect themselves. Push factors could include things like the caste system, feudalism, no access to education, poor quality of life, poverty, etc. People decide to leave the area and move to a better place because of these things. The cultural variables include not only those activities that are seen in the public sphere but also those that are observed in the home. In the joint family systems of Bihar, for instance, few male relatives migrate to earn a living, while others serve as caretakers and guardians. The cultural practice of marrying girls outside of the state is also prevalent in Bihari society (Bierwiaczonek & Waldzus, 2016). Respondents were asked to indicate on a scale from one to five how much they agreed or disagreed with the given causes of migration. The study's researcher polled respondents with 10 questions about the push factors that contribute to migration, five of which pertained to economics and the other five to social and cultural considerations. Principal component analysis, a data reduction statistical technique is used to reduce the dimensionality of a data set by extracting the most important components that explain the most variance in the data. A statistically significant was found after conducting both the Bartlette test of sphericity and the K.M.O test of sample adequacy (Roweis, 1997). In Table 3, we can see the outcomes of the principal component analysis. Four economic and three socio-cultural questions were maintained at the standard parameter cutoff. 53.813% of the variance is explained by the three retained socio-cultural questions and 44.246% by the four retained push economic questions. After the Principal Component Analysis on the push factor of migration, a reliability test was conducted to assess the questionnaire's internal consistency (Kuder & Richardson, 1937). The value of Cronbach's alpha is more than 0.5, as indicated in Table 3 internal consistency is moderate to high, and migrant’s observations can be employed in further analysis. Cronbach's Alpha was 0.566 for the economic push factor and 0.564 for the socio-cultural. To measure the internal consistency of scale items, composite reliability is the method of choice (Raykov, 1997). Both the estimated value of the composite reliability for the push economic factor and the estimated value for the socio-cultural factor was higher than the standard measure of 0.6, which allowed further investigation of the scale item. The estimated value of the composite reliability for the push economic factor was 0.933, and the estimated value for the socio-cultural factor was 0.753. The amount of variation extracted for a construct can be measured using the construct's average variance extracted. It illustrates, on average, how much of the variation in the items can be accounted for by the latent variable that has been hidden. The push economic aspect of migration accounts for an average of 46.2% of the changes in migrant perception, whereas the pull socio-cultural factor of migration accounts for 50.7% of those variations. Source: Calculated by Authors.
Factor
Statements
Factor Loading
Cronbach’s Alpha
CR
AVE
Economic FactorLow wages or salaries
0.672
0.566
0.933
0.462
Lack of job opportunities
0.725
To repay the debt on the family
0.566
Poor economic condition
0.759
Socio- Cultural Factor
Social insecurity
0.755
0.564
0.753
0.507
Discrimination
0.764
Marriage
0.606
3.3 Pull Factors of Migration: Factor Analysis and Reliability Analysis
Pull factors refer to the factors present in the host country that attract individuals to relocate to that location. People may move from Bihar to the Gulf countries because of pull factors like good salary, better standard of living, better education & health facilities, good communication, improved working conditions, more wealth, attractive environment, a good climate, less crime, a historical or religious connection between the two countries (Mandal et al., 2018). Many studies have focused on the economic pull factor as a cause of migration, especially in emerging countries like India. The individual's economic situation is affected and influenced by these factors. There is a lot of work and research that needs to be done to understand the causes of international migration, but socio-cultural factors are typically more challenging to analyse (Haan, 2002). The respondent was questioned by the researcher about their experiences and beliefs that may have influenced their decision to leave their home country for work in the Gulf. The study's researcher polled respondents with 8 questions about the pull factors that contribute to migration, four of which pertained to economics and the other four to social and cultural considerations. Principal component analysis was also performed for the pull factor. The K.M.O test of sample adequacy and the Bartlette test of sphericity were both performed, and the results of both showed that there was a statistically significant difference. The three economic factors questions that were kept in the survey explain 57.536% of the variation, while the two questions that were kept explain 70.484% of the variation. The PCA analysis results are shown in Table 4. After the Principal Component Analysis on the pull factors of migration, a reliability test was also performed to test the questionnaire's internal consistency. Cronbach's Alpha was calculated to be greater than 0.5, the threshold at which reliability can be considered adequate. The results of a reliability analysis of pull variables are shown in Table 4. Cronbach's Alpha was estimated to be 0.581 for cultural factors and 0.630 for economic ones. Composite reliability, which measures the consistency between measurements of the same scale, was calculated to be 0.801 for the economic factor and 0.829 for the socio-cultural factors. This value will be used to determine the overall reliability of the scale. The average extracted variance was calculated to be 57.5% for economic factors and 70.8% for social and cultural factors. Source: Calculated by Author’s.
Factor
Statements
Factor Loading
Cronbach’s Alpha
CR
AVE
Economic FactorBetter employment opportunities in the Gulf
0.786
0.630
0.801
0.575
Improvement in living standard
0.672
Personal development
0.810
Socio- Cultural Factor
Presence of friends and relatives
0.842
0.641
0.829
0.708
Attractive environment
0.842
3.4 The Role of the Push and Pull Factors of Migration
Fig. 1 shows the main reasons why people move from Bihar to countries in the Gulf. There are two types of factors that cause people to move: push factors and pull factors. Examples of push reasons include “low wages or salary”, “lack of job opportunities”, “to repay the debt on the family”, “poor economic condition”, “discrimination”, and “marriage & institution”. The pull factors are primarily the attractions in the destination, such as “better employment opportunities in the gulf”, “an improvement in living standard”, “personal development”, “presence of friends and relatives” and “desire to go abroad due to attractive environment”. Based on the statistics shown in Fig. 1, just 6% of migrants identified only pull reasons as the reason for their migration, whereas 41% acknowledged being mainly influenced by push factors. It's worth noting that 27% of migrants reported having experienced both push and pull forces in making their migration decision. Only 3% of migrants said a pull factor was the only reason they decided to move, but 23% said they moved mainly because of a pull factor. Therefore, it is reasonable to conclude that the push factor is a more significant influence on the migration decision of the people of Bihar than the pull factor.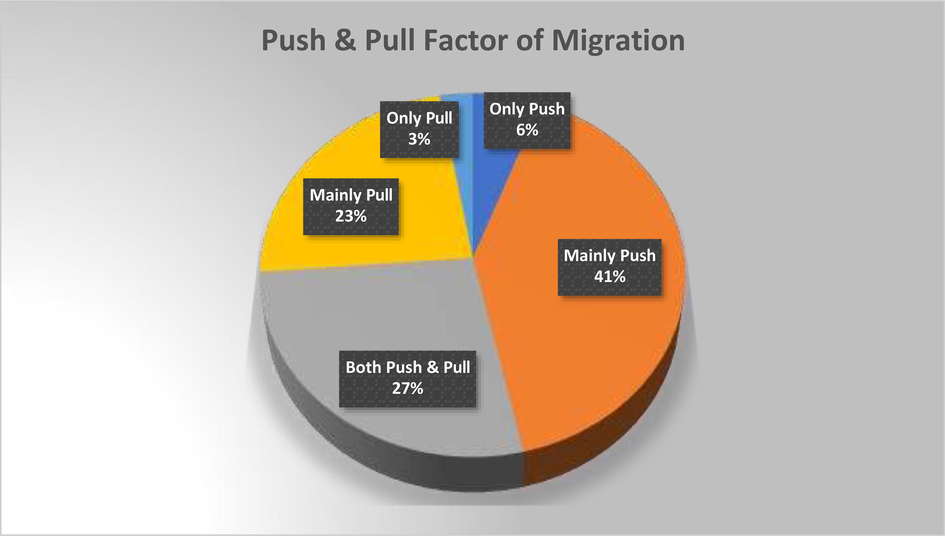
The role of the Push and Pull Factors of Migration Source: Calculated by Author’s.
3.5 Determinants of Length of Stay: A Regression Analysis
A regression model is used to analyze the determinants of the length of stay of migrant workers from Bihar to the Gulf countries. The regression analysis's findings are shown in Table 5; the R-squared value is 0.6438, and the adjusted R-square value is anticipated to be 0.6374, meaning that 63.74% change in dependent variable accounted by the predictors in the model. Factors outside the model accounted for the remaining 36.2% of the explanation. The fact that the ANOVA (analysis of variance) result showed F = 101.19, df = 399, and a P-value is<0.01 indicates these predictors had a significant impact on the length of stay. The regression analysis's findings showed that the pre-migration income has a statistically significant and negative impact on length of stay (B = -0.153, P = 0.000). As a result, we accept the alternative hypothesis that “pre-migration income is a significant determinant of length of stay of migrant workers of Bihar to Gulf countries”. It means that migrants with lower levels of income in their home country push them to stay in the Gulf country. The marital status of migrant labourers was also statistically significant at the 1% significance level as a predictor of length of stay (B = 0.584, P = 0.000). It indicates that married emigrants are more likely to remain in Gulf states due to social and financial responsibilities (Mara and Landesmann, 2013). Another interesting predictor of length of stay was the age of the migrant workers. The regression result shows that age is a significant determinant of length of stay (B = 1.130, P = 0.000) in the Gulf countries, therefore the study accepts the alternative hypothesis. It means that the higher age of migrant workers can contribute to their tendency to stay longer in destination countries compared to younger workers, this is because of the strong social networks and enough maturity to settle in a new environment (Carling & Erdal, 2014). It is interesting to predict that, how the level of education of the migrant workers is the determinant of length of stay. The regression result shows B = -0.271, and P = 0.000, It means that the level of education of migrant workers is a negative and significant determinant of length of stay. Migrant labourers who have attained higher levels of education frequently have specialized competencies and credentials that enhance their employability within their respective nations of origin. This can reduce their incentive to stay in the destination country for an extended period and encourage them to return home. Another null hypothesis that this study has tested was “family type of the migrant workers is not a significant determinant of length of stay”. The regression result rejects the null hypothesis (B = 0.495, and P = 0.000). The length of stay is positively related to the nuclear family of the migrant workers. When migrant workers have a nuclear family, they often put the education and future chances of their children first. They may think that the destination country has better educational resources, better schools, and more job opportunities for their children. Also, compared to the joint family system of migrant workers, they are more likely to be able to settle in the destination country. Length of stay is positively and significantly influenced by the religious background of the migrant workers (B = 0.449, P = 0.010). It means that “religion is a significant determinant of length of stay.” Gulf countries have a predominantly Muslim population, and their social and cultural practices align closely with Islamic traditions. Muslim migrant workers are familiar with and comfortable practicing their faith in a Muslim-majority environment. It can be a significant factor in their decision to stay longer in these countries. Land ownership by the Gulf migrant workers was negatively associated with the length of stay but statistically insignificant. The findings of the study revealed some interesting observations. It was found that the marital status, age, family type, and religion of migrant workers are significant positive determinants of the length of their stay. On the other hand, the level of education and pre-migration income of migrant workers are significant negative determinants of the length of their stay. It was discovered that one predictor, landownership, did not have a significant role in determining the length of stay of migrant workers from Bihar who went to Gulf countries. Source: Calculated by Author from sample survey.
Observed Variable
Unstandardized coefficients
B
Std. Error
t
sig.
(Constant)
0.143
0.259
0.55
0.581
Pre-migration income
−0.153
0.040
−3.80
0.000
Marital status
0.584
0.165
3.53
0.000
Age
1.130
0.071
15.79
0.000
Level of Education
−0.271
0.075
−3.62
0.000
Family type
0.495
0.119
4.14
0.000
Religion
0.449
0.173
2.59
0.010
Land ownership
−0.027
0.033
0.425
0.425
4 Policy Implications
The study's results and conclusions highlight the need for policymakers, bureaucrats, and the government in Bihar to reevaluate the state's social welfare and development programmes. According to the findings, Migration is caused mainly because of push factors; therefore, the authorities should focus on resolving these issues such as lack of job opportunities, low wages and salary, poor economic conditions, debt burden on the family, social discrimination, and marital status. The focus should be placed on enhancing agricultural practices and boosting agricultural output. This can be accomplished through the provision of improved irrigation systems, access to credit for small-scale producers, and training programmes on modern agricultural practices. By increasing agricultural productivity, employment and income-generating opportunities can be generated within the state, thereby reducing the need for citizens to pursue employment abroad. Second, infrastructure development, including transportation, energy, and telecommunications, should receive funding. This will attract industries and businesses to Bihar, creating jobs and stimulating economic development.
5 Conclusion
The migration from Bihar has a long history. Slaves from this area were sent to British colonies like Fiji, Mauritius, Guyana, and Suriname as Girmitiya during the colonial period. During the early years of independent India, many people from this area moved to Calcutta and Assam, Later, in the aftermath of the green revolution, people relocated to the Punjab, Haryana, and the northern states in search of financial prosperity. In the new globalized world, people are either moving to cities like Maharashtra, Gujarat, Kolkata, and Chennai or to countries in the Gulf. The current study explores the different factors that led to Gulf migration. The results are based on a sample of 400, collected through a structured questionnaire using cluster sampling techniques. Most of the sample migrants were Muslim men. Because the Gulf countries generally recruit young labourers, most of the sample migrants were under the age of 40 and had a low level of education. The researcher used principal components analysis (PCA) to reduce the number of variables into a small number of factors, and a reliability test was carried out to assess the questionnaire for its internal consistency. Further, factors were classified as the push factor and pull factor of migration. The study confirms that the push factor plays a significant role in people migrating. The major cause of migration was ‘lack of jobs, ‘low wages’, ‘poor financial condition’, and ‘debt. on the family’, ‘social insecurity’, & ‘social discrimination. Apart from the push factor, a few pull factors such as ‘better employment opportunities’, ‘improved living standard’, ‘personal development’, ‘presence of relatives’ & ‘attractive environment’ also play a significant role in Gulf migration. The study also points out that both push and pull factors play a role at the same time. 41% of the people who answered said that the push factor was the main reason they moved. However, only 6% moved because of the push factor alone. In the same way, 23% of people moved because of mainly pull factors, but only 3% moved because of only pull factors. 27% said that both push and pull factors were the main reason they moved. The main implication of this study is lie in the policy implication of the study which suggested tackling to push factor, which forces people to migrate. The study also found that the marital status, age, family type, and religion of migrant workers are significant positive determinants of the length of their stay. On the other hand, the level of education and pre-migration income of migrant workers are significant negative determinants of the length of their stay.
Funding
This research received no external funding.
Declaration of Competing Interest
The authors declare that they have no known competing financial interests or personal relationships that could have appeared to influence the work reported in this paper.
References
- Managing Jordanian nurse migration to the Gulf Cooperation Council states. EMHJ-Eastern Mediterranean Health Journal. 2015;21(3):220-225.
- [Google Scholar]
- Socio-cultural factors as antecedents of cross-cultural adaptation in expatriates, international students, and migrants: A review. J. Cross Cult. Psychol.. 2016;47(6):767-817.
- [Google Scholar]
- Return migration and transnationalism: how are the two connected? Int. Migr.. 2014;52(6):2-12.
- [Google Scholar]
- Sampling Techniques (3rd ed.). New York: John Wiley & Sons; 1977.
- Push-pull factors of undocumented migration from Bangladesh to West Bengal: A perception study. Qual. Rep.. 2004;9(2):335-358.
- [Google Scholar]
- Migration from contemporary Bihar. Internal Migration in Contemporary India 2016:204-221.
- [Google Scholar]
- Migration and livelihoods in historical perspective: A case study of Bihar, India. J. Dev. Stud.. 2002;38(5):115-142.
- [Google Scholar]
- Pull and Push Factors of Indonesian women migrant workers from Indramayu (West Java) to work abroad. Mediterr. J. Soc. Sci.. 2015;6(5 S5):167.
- [Google Scholar]
- Kainth, G. S. 2010. Push and pull factors of migration: a case study of brick kiln migrant workers in Punjab.
- Lithuanian “brain drain” causes: Push and pull factors. Eng. Econ.. 2006;46(1):27-37.
- [Google Scholar]
- Khan, M. A., Khan, M. I., Illiyan, A., & Khojah, M. 2021. The Economic and Psychological Impacts of COVID-19 Pandemic on Indian Migrant Workers in the Kingdom of Saudi Arabia. Paper presented at the Healthcare.
- Khan, M. I., Khan, M. A., Sherfudeen, N., Illiyan, A., & Ali, M. A. 2023. Mental Health Status of Indian Migrant Workers in the United Arab Emirates during the COVID-19 Pandemic. In: Healthcare (Vol. 11, No. 11, p. 1554). MDPI.
- An Economic Analysis of Indian Emigrants in Saudi Arabia during COVID-19 Pandemic. Arabia. 2021;6:7.
- [Google Scholar]
- Nursing migration: global treasure hunt or disaster-in-the-making? Nurs. Inq.. 2001;8(4):205-212.
- [Google Scholar]
- The theory of the estimation of test reliability. Psychometrika. 1937;2(3):151-160.
- [Google Scholar]
- A Girmitiya ‘Sepoy’. South Asia: Journal of South Asian Studies. 2016;39(1):244-250.
- [Google Scholar]
- Mandal, T., Das, J., & Poddar, D. 2018. Nature and determinates of labour Migration: A case study of Koch Bihar district.
- The steadiness of migration plans and expected length of stay: based on a recent survey of Romanian migrants in Italy. College London: NORFACE Research Programme on Migration, Department of Economics, Univ; 2013.
- 4 Migration Research and Analysis: Recent United Nations Contributions. World Migration Report. 2022;2022(1):e00025
- [Google Scholar]
- Economics reason of migration from point of view of students. Procedia- Social and Behavioral Sciences. 2014;109:522-526.
- [Google Scholar]
- Addressing the missing link: women domestic workers migrating from South Asia to the Gulf. Routledge India; 2015. p. :86-96.
- South Asia-Gulf migratory corridor: Emerging patterns, prospects and challenges. Migration and Development. 2016;5(3):394-412.
- [Google Scholar]
- Push and pull factors of migration. American Review of Political Economy. 2010;8(2):6.
- [Google Scholar]
- Prieto Rosas, V., & López Gay, A. 2015. Push and pull factors of Latin American migration. Demographic Analysis of Latin American Immigrants in Spain: From Boom to Bust, 1-27.
- Push and pull factors in relation to skills shortages in South Africa. Journal of Social Sciences. 2012;30(1):11-20.
- [Google Scholar]
- Understanding the poor economic performance of Bihar and Uttar Pradesh, India: a macro-perspective. Reg. Stud. Reg. Sci.. 2014;1(1):221-239.
- [Google Scholar]
- Estimation of composite reliability for congeneric measures. Appl. Psychol. Meas.. 1997;21(2):173-184.
- [Google Scholar]
- Roweis, S. 1997. EM algorithms for PCA and SPCA. Advances in neural information processing systems, 10.
- Green revolution and economic plight of agricultural labour in Punjab. The Indian Journal of Labour Economics. 2006;49(4):855-862.
- [Google Scholar]
- Siyal, G. E. A., Khalid, I., & Qaisrani, A. 2018. A Case Study from Semi-arid Regions of Pakistan.
- Is it push or pull? Recent evidence from migration into Bangalore, India. J. Int. Migr. Integr.. 2013;14(2):287-306.
- [Google Scholar]
- Migration as a livelihood strategy: a gender perspective. Econ. Pol. Wkly 2005:2295-2303.
- [Google Scholar]
- Pull and push factors of migration: A case study in the urban Area of Monywa Township, Myanmar. News from the World of Statistics. 2014;1(24):1-14.
- [Google Scholar]
- Tripathi, T. 2020. Labour Mobility in Historical Perspective from East UP, South UP and North Bihar: Contours of Changes and Continuity. Development Challenges of India After Twenty Five Years of Economic Reforms: Inequality, Labour, Employment and Migration, 357-378.
- Tripathy, B., & Raha, S., 2022. Trend of internal migration in India during the period of 1991 TO 2011.
- Impact of Male Migration to Gulf Countries on the Emigrant Households of Kottayam Municipal Area. Thiruvananthapuram: Kerala Research Programme on Local Level Development (KRPLLD); 2004.
- The push and pull factors affecting the migration of Mongolians to the Republic of South Korea. SHS Web of Conf.. 2021;90:01023.
- [Google Scholar]


