Translate this page into:
Spatial distribution of active galactic nuclei based on the 1995 CFA catalogue
*Corresponding author. Tel.: +966 1 4814302; fax: +966 1 4813521 amaghrabi@kacst.edu.sa (A.H. Maghrabi)
-
Received: ,
Accepted: ,
This article was originally published by Elsevier and was migrated to Scientific Scholar after the change of Publisher.
Abstract
The spatial distribution for 37 Active Galactic Nuclei (AGN) included in the Harvard catalogue of red-shifts has been studied in terms of their distances and red-shifts. We investigated the completeness of the catalogue by using an intrinsic property of the AGN, their absolute luminosity. The absolute luminosity for the 37 AGNs was calculated and they were partitioned into classified into two categories, above and below 1011L⊙. This study finds no observable differences between the two luminosity groups, so that the AGNs are distributed randomly and uniformly, implying the completeness of the catalogue.
Keywords
Spatial distribution
Active galactic nuclei
zcat
CFA
1 Introduction
The term Active Galactic Nucleus (AGN) refers to the existence of energetic phenomena in the nuclei of galaxies, or in their central regions, which cannot be clearly attributed to stars (Shields, 1999). Many of these galaxies have the same morphology as normal galaxies, but they have much greater power output. They are very distant bodies, probably distributed randomly throughout the universe and less common than normal galaxies (Blandford, 1990). AGNs involve the most powerful, long-lived steady sources of luminosity in the Universe. They range from the nuclei of some nearby galaxies emitting about 1040 erg s−1 (1 erg = 0.1 μJ) to distant quasars emitting more than 1047 erg s−1 (Andrew, 1999). The emission is spread widely across the electromagnetic spectrum, often peaking in the UV, but with significant luminosity in the X-ray and infrared bands (Osterbrock and Mathews, 1987; Bregman, 1990; Netzer, 1990). The power output of AGN is often variable on time scales of years and sometimes on time scales of days, hours, or even minutes (Wallinder et al., 1992; Wagner and Witzel, 1995; Ulrich et al., 1997). This variability provides evidence of the very compact of the central engine. The best explanation of the energy generation in this size-constrained luminosity and high variability leads the scientists to believe that gravitational energy released by materials accreting onto a super massive black hole with masses about 106 to 1010 solar masses, is the source of powering the AGN (Begelman, 1985; Abramowicz et al., 1987; Kormendy and Richstone, 1995; and Richstone et al., 1998). Recent observational data from Hubble space telescope and ground-based radio interferometers have confirm this idea.
Because AGNs are so luminous and have distinctive properties, they can be discovered fairly easily. There are different classes according to their physical properties, morphological types, spectral lines and radio emissions. These classes include different objects such as Quasars, radio galaxies, BL-Lac objects and Seyfert galaxies. For instance, Quasars are AGNs but they differ from Seyfert galaxies in having greater luminosity. In the same way we can distinguish radio galaxies, blazars and so on as different categories of AGN, (Antonucci, 1993; Urry and Padovani, 1995; and Osterbrock and Shaw, 1988).
The present work aims to determine the spatial distribution of active galactic nuclei and thereby test the completeness of the 1995 CFA Harvard catalogue (which contains them). This is done by running through the catalogue and selects AGNs and analyse the data.
2 The catalogue
We use a zcat file (CFA red shift catalogue) produced by the Harvard Smithsonian Center for Astrophysics in 1995. The first CfA Redshift survey was completed in 1982. It includes measurement of radial velocities for all galaxies brighter than 14.5 and at high galactic latitude in the merged catalogues of Zwicky et al. (1968). The second CfA survey (CfA2), which we used in the present study, was started in 1984 and completed in 1995.
This catalogue incorporates much of the latest velocity data from the Whipple observatory and other sources, as well as velocities from earlier compilations such as the second reference catalogue of de Vaucouleurs and de Vaucouleurs (1964), de Vaucouleurs et al. (1976, 1991) and Gisler and Friel (1979) and the catalogue of radial velocities of galaxies by Palumbo et al. (1983). Some of the red shift observations were obtained from the literature, and others have been measured. The observations were made at the F.L. Whipple observatory with the photo-counting Reticon system on the Tillinghast reflector (1.5 m) or in the Multiple Mirror telescope. Reductions to the recession speeds were done using the RVSAO package developed for this project (Huchra and Geller, 1995).
This catalogue contains about 57536 celestial objects, together with their astronomical properties. The catalogue has been arranged so as to identify the objects selected by their morphological type, name, and position (e.g. Right Ascension and declination), recession speed (Vh = zc) and other properties. All related descriptions and an updated cfa catalogues have been described in Huchra et al. (1983), Huchra and Burg (1992), Huchra and Geller (1995), and homepage of the catalogue1.
3 Data analysis
3.1 The first AGN distribution
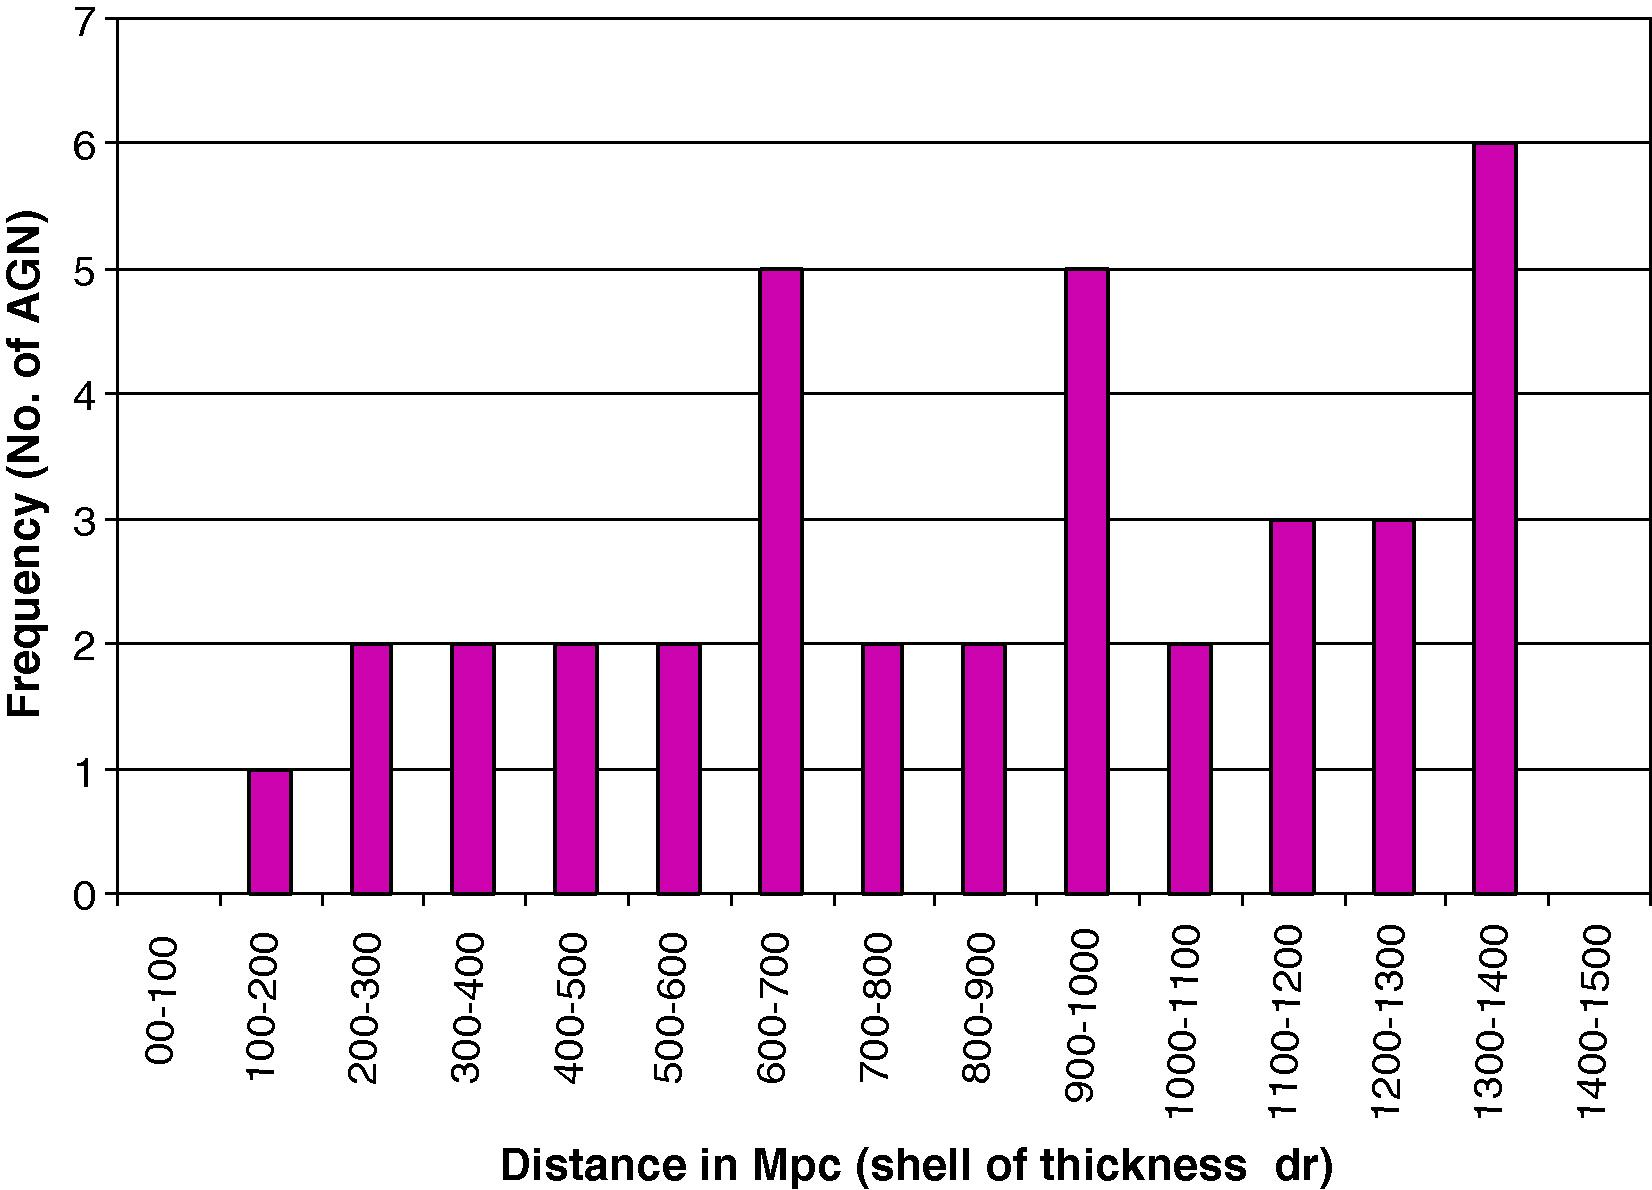
The AGNs were first selected according to their morphological type, which was −9 in the catalogue categories, by using our code. By taking the Hubble constant equal to 72 kms−1 Mpc−1, and the speed of light equal to (c = 299792.5 km/s), the distance and the red-shifts for these objects have been identified in term of their recessions speed Vh. Table 1 summarizes the general properties of the selected 32 AGNs. Since we do not know how AGNs are distributed throughout the volume, we were interested to find the distribution over shells of thickness (δr), which has been chosen to be 100 Mega-Parsec Mpc.
Name
RA (h)
Dec (h)
Recession speed (km/s)
Distance (Mpc)
Red Shift (z) (Vh/c)
Bolometric magnitude (Bmag)
Apparent magnitude (Bmag∗Vh2)
8.08E+08
0
0
7.28E+04
1.01E+03
2.43E−01
4.37
2.32E+10
8.42E+08
0
12
4.26E+04
5.91E+02
1.42E−01
120.23
2.18E+11
8.42E+08
0
−2
7.17E+04
9.95E+02
2.39E−01
10.00
5.13E+10
8.25E+08
0
−1
9.74E+04
1.35E+03
3.25E−01
6.92
6.57E+10
8.08E+08
0
0
9.68E+04
1.34E+03
3.23E−01
3.63
3.40E+10
8.42E+08
2
2
4.65E+04
6.45E+02
1.55E−01
69.18
1.49E+11
9.26E+08
3
−77
6.69E+04
9.28E+02
2.23E−01
43.65
1.95E+11
9.43E+08
4
−8
1.15E+04
1.60E+02
3.84E−02
54.45
7.21E+09
8.09E+08
5
0
8.75E+04
1.22E+03
2.92E−01
31.33
2.40E+11
8.43E+08
7
39
2.87E+04
3.99E+02
9.58E−02
131.83
1.09E+11
8.09E+08
7
65
4.45E+04
6.18E+02
1.48E−01
158.49
3.14E+11
9.60E+08
10
29
9.87E+04
1.37E+03
3.29E−01
63.10
6.14E+11
9.09E+08
10
6
4.44E+04
6.16E+02
1.48E−01
20.32
4.00E+10
9.43E+08
10
−28
5.70E+04
7.92E+02
1.90E−01
39.81
1.29E+11
8.76E+08
10
4
6.90E+04
9.58E+02
2.30E−01
2.09
9.95E+09
8.09E+08
11
61
1.93E+04
2.69E+02
6.45E−02
3.98
1.49E+09
8.76E+08
11
−34
7.74E+04
1.07E+03
2.58E−01
10.00
5.98E+10
8.26E+08
12
2
4.75E+04
6.59E+02
1.58E−01
591.56
1.33E+12
9.26E+08
12
−7
8.00E+04
1.11E+03
2.67E−01
6.31
4.04E+10
9.26E+08
12
57
9.59E+04
1.33E+03
3.20E−01
6.92
6.37E+10
8.59E+08
12
−33
5.70E+04
7.91E+02
1.90E−01
3.63
1.18E+10
8.93E+08
13
5
6.15E+04
8.54E+02
2.05E−01
2.29
8.66E+09
8.59E+08
13
24
3.26E+04
4.53E+02
1.09E−01
91.20
9.68E+10
8.09E+08
13
0
9.77E+04
1.36E+03
3.26E−01
39.81
3.80E+11
8.76E+08
13
64
2.64E+04
3.66E+02
8.80E−02
120.23
8.37E+10
8.42E+08
13
18
4.56E+04
6.33E+02
1.52E−01
58.61
1.22E+11
8.59E+08
14
43
9.72E+04
1.35E+03
3.24E−01
25.12
2.37E+11
8.08E+08
14
20
3.93E+04
5.45E+02
1.31E−01
63.10
9.73E+10
8.26E+08
17
51
8.63E+04
1.20E+03
2.88E−01
67.30
5.01E+11
9.60E+08
18
69
1.50E+04
2.08E+02
5.00E−02
251.19
5.64E+10
8.76E+08
18
64
9.00E+04
1.25E+03
3.00E−01
229.09
1.86E+12
8.42E+08
19
72
9.09E+04
1.26E+03
3.03E−01
3.31
2.73E+10
8.42E+08
20
−42
6.63E+04
9.20E+02
2.21E−01
9.12
4.00E+10
9.26E+08
21
−17
3.33E+04
4.62E+02
1.11E−01
120.23
1.33E+11
8.76E+08
22
14
7.11E+04
9.87E+02
2.37E−01
15.85
8.00E+10
9.09E+08
23
16
8.39E+04
1.17E+03
2.80E−01
3.98
2.81E+10
9.43E+08
23
−8
6.33E+04
8.78E+02
2.11E−01
10.00
4.00E+10
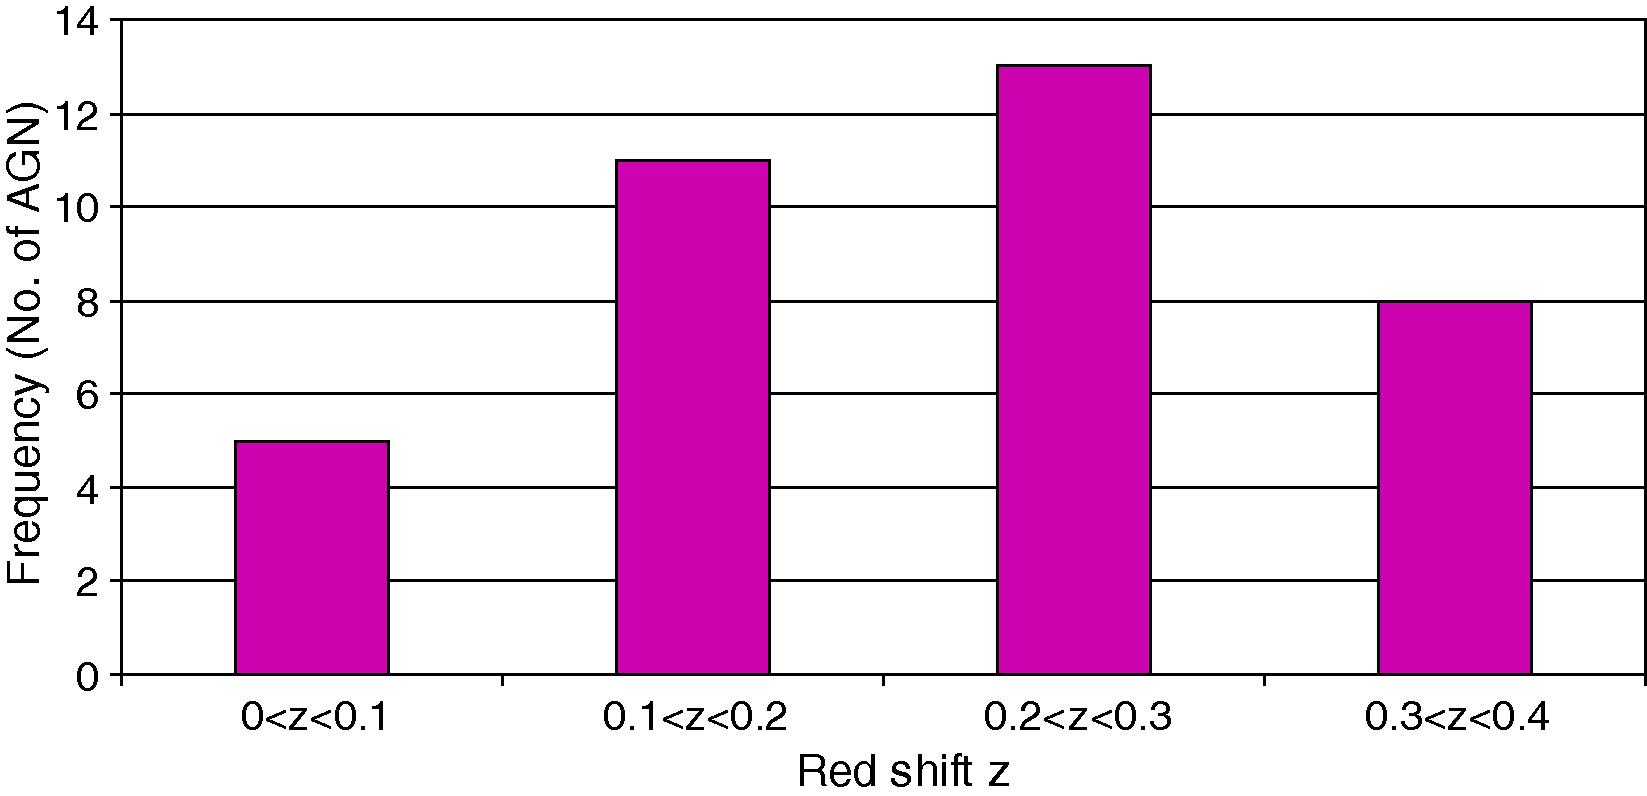
The spatial distribution for the selected AGNs in the shell in terms of distances is shown in Fig. 1, and in terms of the red-shifts in Fig. 2.
Spatial distribution of the selected AGN in terms of distance in a shell of thickness dr = 100 Mpc.

Spatial distribution of selected AGN in terms of red-shifts.
To find the spatial distribution in a unit of volume we divided the number of AGNs by 4πr2δr, where r is the radius of the sphere. This has been taken as an average distance to the number of the AGN located in the same distance shell. The number of AGNs per cubic Mega-parsec is summarized in Table 2. We see from Table 2 that the density of recorded AGNs decreases with distance.
No. of AGNs at given distance
Distance in Mpc
No. of AGN/Mpc3
1
1.60E+02
3.11E−08
2
2.38E+02
1.41E−08
2
3.83E+02
5.43E−09
2
4.57E+02
3.81E−09
2
5.68E+02
2.47E−09
5
6.34E+02
1.98E−09
2
7.92E+02
1.27E−09
2
8.66E+02
1.06E−09
5
9.58E+02
8.68E−10
2
1.04E+03
7.32E−10
3
1.16E+03
5.94E−10
3
1.24E+03
5.15E−10
6
1.35E+03
4.36E−10
3.2 Luminosity distribution
Since AGNs are highly luminous, this property will now be used to find their spatial distribution. Although the catalogue does not give absolute luminosity, we inferred it from the information given in the catalogue. We multiplied the stated bolometric magnitude by the square of the recession speed, to compensate for the inverse square reduction of intensity with distance. Accordingly, the absolute luminosity was calculated and is given in the last column of Table 1. This parameter is crucial in finding the distribution of AGNs and in testing the completeness of the catalogue.
Two proposals have been made: either
-
We are failing to pick up some AGNs at large distances, or
-
There are fewer AGNs than expected at large distances.
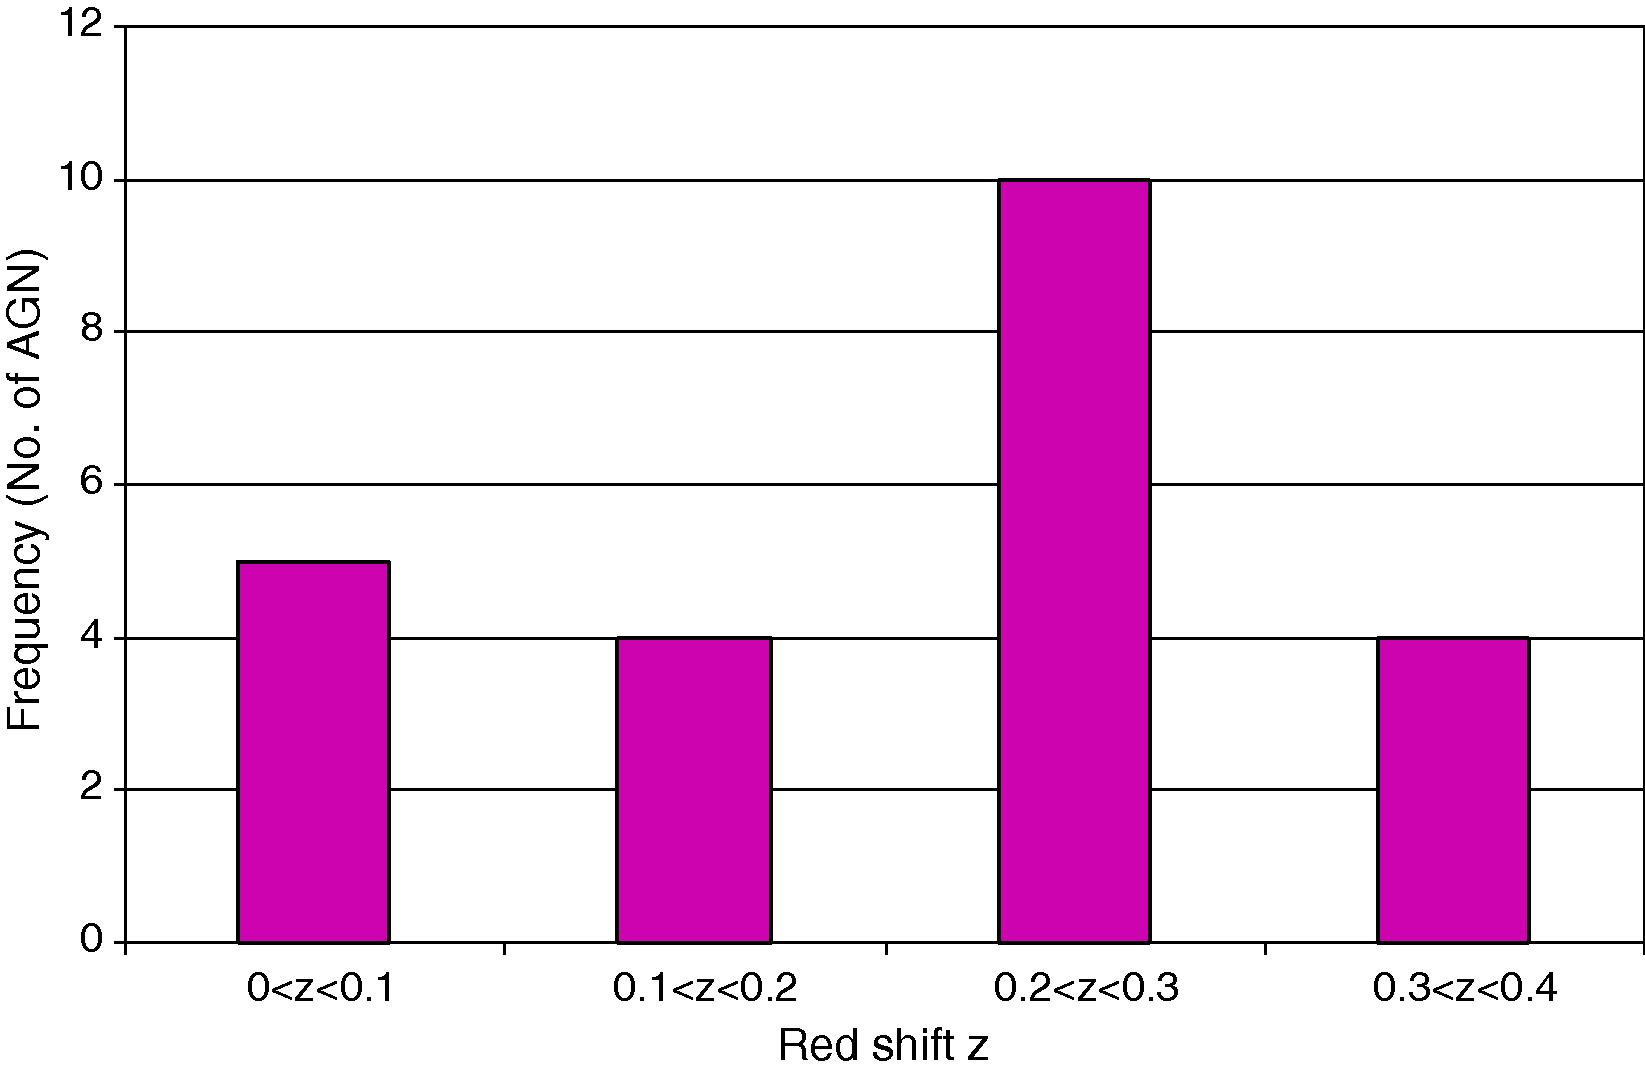
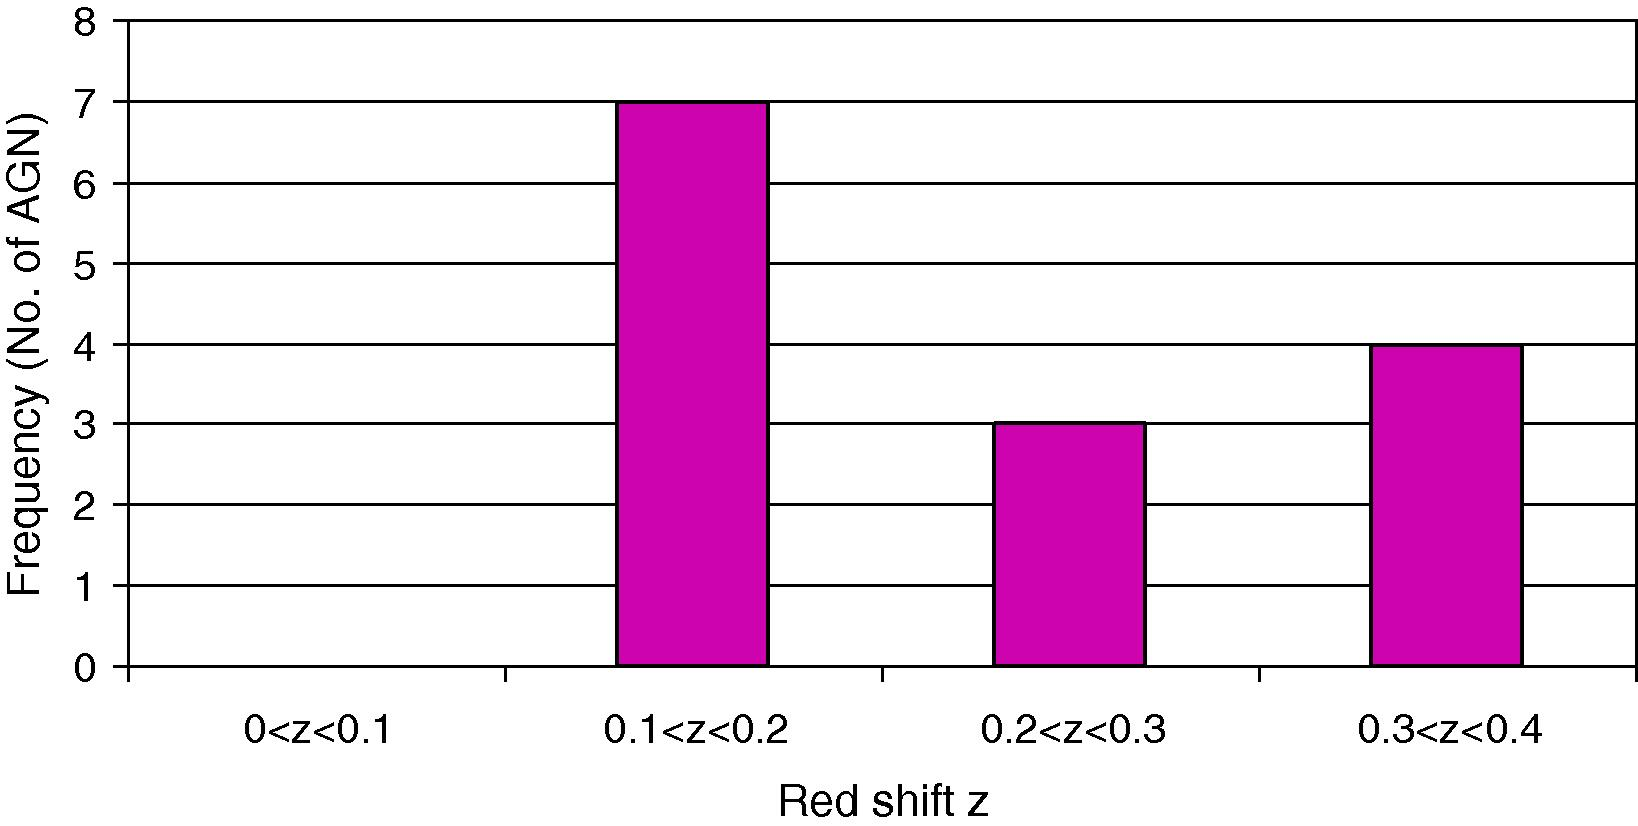
To distinguish between these hypotheses we may partition the AGNs into two categories, fainter and brighter, according to their absolute luminosity. A threshold was chosen at an absolute luminosity of 1011L⊙, with 23 galaxies showed values less than 1011L⊙ and 14 galaxies showed values greater than 1011L⊙. Separate histograms were then made of the number of AGNs at each redshift for these two categories of AGNs and the results are presented in Figs. 3 and 4, respectively.
Spatial distribution of AGNs with absolute Luminosity < 1011.

Spatial distribution of AGNs with absolute luminosity > 1011.
If the first suggestion is true then the fainter AGNs should more affected and fewer should be observed; see Fig. 3.
There is no observable difference, so that the catalogue is probably complete, including low luminous AGNs and, in view of Fig. 4, high-luminosity AGNs. The spatial distribution of low and high-luminosity AGNs has therefore been found to be random and uniform.
4 Conclusions
The spatial distribution for 37 AGNs in the Harvard red shift catalogue (zcat of cfa) has been found and plotted in terms of their distances and red-shifts. The catalogue was then tested for completeness by finding the distribution for those AGNs with “absolute luminosity” less than 1011 and, separately, for those with luminosity greater than 1011. The spatial distribution of AGNs was found to be random and uniform.
There are nevertheless small defects in the catalogue. One defect is that the catalogue does not specify the exact class of object, quasar or Seyfert or any other class of AGN. Also, some quasars, which are a category of AGNs, have large red-shift. However, the catalogue contains only relatively small red-shift objects.
Acknowledgments
We thank King Abdulaziz City for Science and Technology for its supports for this study.
References
- Thick accretion disks – theory vs. observations. Comments on Modern Physics, Part C – Comments on Astrophysics. 1987;12(2):67-85.
- [Google Scholar]
- Active galactic nuclei. Proceedings of the National academy of Sciences of the United States of America. 1999;96:4749-4751.
- [Google Scholar]
- Unified models for active galactic nuclei and quasars. Annual Review of Astronomy and Astrophysics. 1993;31:473-521.
- [Google Scholar]
- Begelman, M., 1985. In: Miller, J.S. (Ed.), Astrophysics of Active Galaxies and Quasi-stellar Objects. Oxford University Press, p. 411.
- Blandford, R.D., 1990. In: Courvoisier, T.J.-L., Mayor, M. (Eds.), Active Galactic Nuclei, Saas-Fee Advanced Course 20, p. 161.
- Continuum radiation from active galactic nuclei. Astronomy and Astrophysics Review. 1990;2(2):125-166.
- [Google Scholar]
- Reference Catalogue of Bright Galaxies. Austin: University of Texas Press; 1964.
- Second Reference Catalogue of Bright Galaxies. Austin: University of Texas Press; 1976.
- Third Reference Catalogue of Bright Galaxies. Vol vol. vols. I–III. Berlin: Springer-Verlag; 1991.
- Gisler, G.R., Friel, E.D., 1979. Index of Galaxy Spectra. Pachart Publishing House, Tucson, AZ.
- The spatial distribution of active galactic nuclei. I the density of Seyfert galaxies and liners. Astrophysical Journal. 1992;393:90.
- [Google Scholar]
- The CFA red shift survey: data the NGP +36 zone. Astrophysical Journal Supplement. 1995;99:391.
- [Google Scholar]
- A survey of galaxy red shifts. IV. The data. Astrophysical Journal Supplements. 1983;52:19-89.
- [Google Scholar]
- The search for supermassive black holes in galactic nuclei. Annual Review of Astronomy and Astrophysics. 1995;33:581.
- [Google Scholar]
- Netzer, H., 1990. In: Courvoisier, T.J.-L., Mayor, M. (Eds.), Active Galactic Nuclei, Saas-fee Advanced Course 20.
- Emission-line regions of active galaxies and QSOs. Annual Review of Astronomy and Astrophysics. 1987;24:71-203.
- [Google Scholar]
- The relative number of Seyfert 2 galaxies. I – spectra of emission-line galaxies in the Wasilewski field. Astrophysical Journal. 1988;327:89-98.
- [Google Scholar]
- Palumbo, G., Tanzella-Nitti, G., Vettolani, G. 1983. Catalogue of Radial Velocities of Galaxies. Gordon and Breach Science Publishers, New York.
- Supermassive black holes and the evolution of galaxies. Nature. 1998;385(6701, Suppl.):A14.
- [Google Scholar]
- A brief history of active galactic nuclei. The Publications of the Astronomical Society of the Pacific. 1999;11(760):661-678.
- [Google Scholar]
- Variability of active galactic nuclei. Annual Review of Astronomy and Astrophysics. 1997;35:445-502.
- [Google Scholar]
- Unified schemes for radio-loud active galactic nuclei. Publications of the Astronomical Society of the Pacific. 1995;107:803.
- [Google Scholar]
- Intraday variability in quasars and BL Lac objects. Annual Review of Astronomy and Astrophysics. 1995;33:163-198.
- [Google Scholar]
- Variability of the central region in active galactic nuclei. Astronomy and Astrophysics Review. 1992;4(2):79-122.
- [Google Scholar]
- Zwicky, F., Herzog, E., Wild, P., Karpowicz, M., Kowal, C., 1968. Catalogue of Galaxies and of Clusters of Galaxies. California Institute of Technology, Pasadena.


