Translate this page into:
Spatial analysis of Ardabil plain aquifer potable groundwater using fuzzy logic
*Corresponding author at: Department of Earth Sciences, Faculty of Natural Science, University of Tabriz, Iran. Tel.: +98 4113392731, +98 9188878406 kord_mehdi@yahoo.com (Mehdi Kord)
-
Received: ,
Accepted: ,
This article was originally published by Elsevier and was migrated to Scientific Scholar after the change of Publisher.
Peer review under responsibility of King Saud University.
Available online 19 September 2013

Abstract
The purpose of this study is to evaluate the quality of drinking water and qualitative classification of potable water in Ardabil plain aquifer. To determine the chemical properties 58 water samples were collected from wells and analyzed. Distribution of each quality parameter was estimated using data driven techniques of kriging and fuzzy logic modeling. According to the obtained results, the fuzzy model provides better results compared to kriging. Different water quality standards are used for assessment of drinking water. The quantitative limits specified in these standards and also water quality data are associated with uncertainty. To reduce the uncertainty a fuzzy based decision making approach was applied for interpretation of groundwater quality. Final output was presented in the form of a zoning map with three categories as ‘Desirable’, ‘Acceptable’ and ‘Not acceptable’. This map indicates that most parts of the aquifer have acceptable and desirable water quality for drinking; but the groundwater in the Southwest and North of the plain, being in conformity with Miocene formations, is undesirable (Not acceptable). This spatial distribution map can help a lot for groundwater supply and offers a good insight of groundwater qualitative trend in this study area.
Keywords
Potable groundwater
Qualitative classification
Kriging
Fuzzy logic
1 Introduction
Sustainable management of groundwater resources in underdeveloped regions is one of the essential objectives for future, especially when the rising demand for clean drinking water by these fast communities is considered (Mende et al., 2007). Understanding the hydrochemical properties of aquifer is very important for groundwater planning and management.
In Ardabil plain the main source for drinking water is ground water. Low quality water supply can cause health problems, therefore determining the quality of water in the study area is important. Map of water quality can be obtained from estimation of element concentration of the whole aquifer based on measurements of some localized samples.
Many researchers have tried to use different data driven interpolation methods for modeling separate samples of element concentrations (Molenat and Gascuel-Odoux, 2002; Flipo et al., 2007; Tutmez and Hatipoglu, 2010; Wang and Huang, 2012; Wei et al., 2012).
Making use of geostatistics, especially kriging, is one way to interpolate in geological media. Numerous literatures can be found about interpolation via kriging in water sciences (Wang et al., 2001; Desbarats et al., 2002; Sepaskhah et al., 2004; Jang and Liu, 2004; Shen and Wu, 2013).
Although kriging produces good results, it encounters problems when the number of measurements is insufficient for the calculation of acceptable variograms (Deutsch and Journel, 1998; Bardossy and Fodor, 2004; Tutmez and Hatipoglu, 2010).
Another method for interpolation is using fuzzy modeling. Two major uses of fuzzy logic are decision making and modeling. Fuzzy logic is an effective tool for handling the ambiguity and uncertainty of real world systems. Fuzzy logic can be particularly suited when relationships between variables in the environment are either ill defined or very complex (Kavitha Mayilvaganan and Naidu, 2011). This method was applied to estimate the values of variables at unsampled sites by many researchers (Burrough, 1989; Bogardi et al., 2003; Amini et al., 2005; Tutmez and Hatipoglu, 2010; Kholghi and Hosseini, 2008).
Numerous studies have been made in the field of water quality assessment. Some of them are mentioned in the following. Chang et al. (2001) in a comparative study, compared the performance of the fuzzy synthetic evaluation approach in identification of water quality with results obtained from traditional methods.
Muhammetoglu and Yardimci (2006) utilized the fuzzy logic approach to assess groundwater pollution levels in the area by developing Water Pollution Index values. They concluded that the fuzzy logic approach presents a more understandable and objective way of water quality classification.
Taheriyoun et al. (2010) developed an Entropy based Fuzzy Eutrophication Index model for classification of the trophic level of Satarkhan Reservoir in the North western part of Iran.
Samson et al. (2010) evaluated the application of fuzzy set theory for decision making in the assessment of groundwater quality for drinking and they used the kriging method to interpolate the physical and chemical water quality parameters.
Tayfur et al. (2003) used fuzzy logic algorithms for estimating sediment loads from bare soil surface. Dahiya et al. (2007) reported the application of fuzzy set theory for decision making in the assessment of physicochemical quality of groundwater for drinking purposes and expressed the view that a fuzzy synthetic evaluation model gives the certainty levels for the acceptability of water based on the prescribed limits of various regulatory bodies, quality class, and perception of the experts from the field of drinking water quality.
In recent years, several works have been performed in quality classification of surface water by fuzzy logic (Gharibi et al., 2012; Duque et al., 2013; Scannapieco et al., 2012). Gharibi et al. (2012) developed a novel water quality index based on fuzzy logic for routine assessment of surface water quality, particularly for human drinking purposes. They deduced that the fuzzy-based index proposed by them produced more stringent outputs compared to the traditional methods. Duque et al. (2013) also used a fuzzy logic hybrid model to assess river water quality. They concluded that the main advantage of their proposed method in comparison with traditional methods is that it considers flexible boundaries between the linguistic qualifiers used to define the water status, being the belongingness of water quality to the diverse output fuzzy sets or classes provided with percentiles and histograms, which allows to classify better the real water condition.
According to the census 2011, approximately 564,000 people live in Ardabil plain inhabiting 2 major cities and 88 villages (, 2011). The average use of drinking water in Ardabil plain is about 26 (million m3/y), which accounts for 89% of total water demand that is supplied by groundwater and the remaining 11% is obtained from surface water (Kord et al., 2013). Due to this significance, the quality mapping of potable groundwater for this plain is indispensable. In this regard, the use of appropriate methods has a direct influence on the accuracy of obtained results and consequently on proper management of the aquifer. In previous studies which are mentioned above, the fuzzy logic has been used just as a data driven or decision making method.
The purpose of this study is to evaluate the quality of drinking water and qualitative classification of potable water in Ardabil plain aquifer using special abilities of fuzzy logic in modeling and decision making. Therefore the unknown component concentration values of groundwater at a location with no wells have been estimated through kriging and fuzzy logic techniques from known element concentrations measured at sample points in the aquifer. Then, to assess the quality of drinking water, fuzzy logic has been used as an expert system suited for decision making.
2 Materials and methods
The Ardabil plain aquifer is located in Northwest Iran in the Province of Ardabil. This plain is found bounded between 38°00′–38°30′ N and 48°00′–48°40′ E, and has an aerial coverage of about 990 km2. The region experiences pleasant summer and relatively long winters with an average annual precipitation of about 300 mm.
The Ardabil plain is surrounded by elevations which are parts of Alborz Mountains. In West of the plain, conglomerate with some tuff, volcanic ashes and lahars are outcropped. These rocks due to the abundant springs originate from the Sabalan Mountain, affect aquifer recharge.
The rock units consisting of conglomerate with some sandstone, marl, fresh water limestone, pumice, tuff and lahar of Neogene age are located in Southwestern Ardabil plain. These formations have a very low effect on aquifer recharge. Other unit rocks including cherty limestone, cherty dolomite, sandstone and conglomerate with thin beds of gypsum in Northeast and megaporphyric trachy andesite, trachy basalt, volcanic breccias, olivine basalt, tuff and sandy tuff located in the South, East and North of the plain have a moderate potential from aquifer recharge point of view.
The Ardabil plain that has been formed out of Quaternary alluvial deposits originated from alteration of surrounding mountains. Based on the results of geophysical studies of pumping test data and drilling logs, the aquifer with a maximum thickness of about 220 m, is mainly composed of gravel, sand and a little amount of clay. The transmissivity of the aquifer varies between 50 and 2200 m2/day and the specific yield ranges from 0.021 to 0.14. The general direction of groundwater flow is from other directions to the North–West of the plain (Kord et al., 2013).
In the past, mostly springs, qanats and rivers were used for water supply, but now it is mostly based on exploitation of wells.
For investigation of the hydrochemistry status, the sampling sites were selected with convenient spatial distribution to cover the study area for representative sampling of the groundwater. Fig. 1 shows the location of the study area and the sampling points.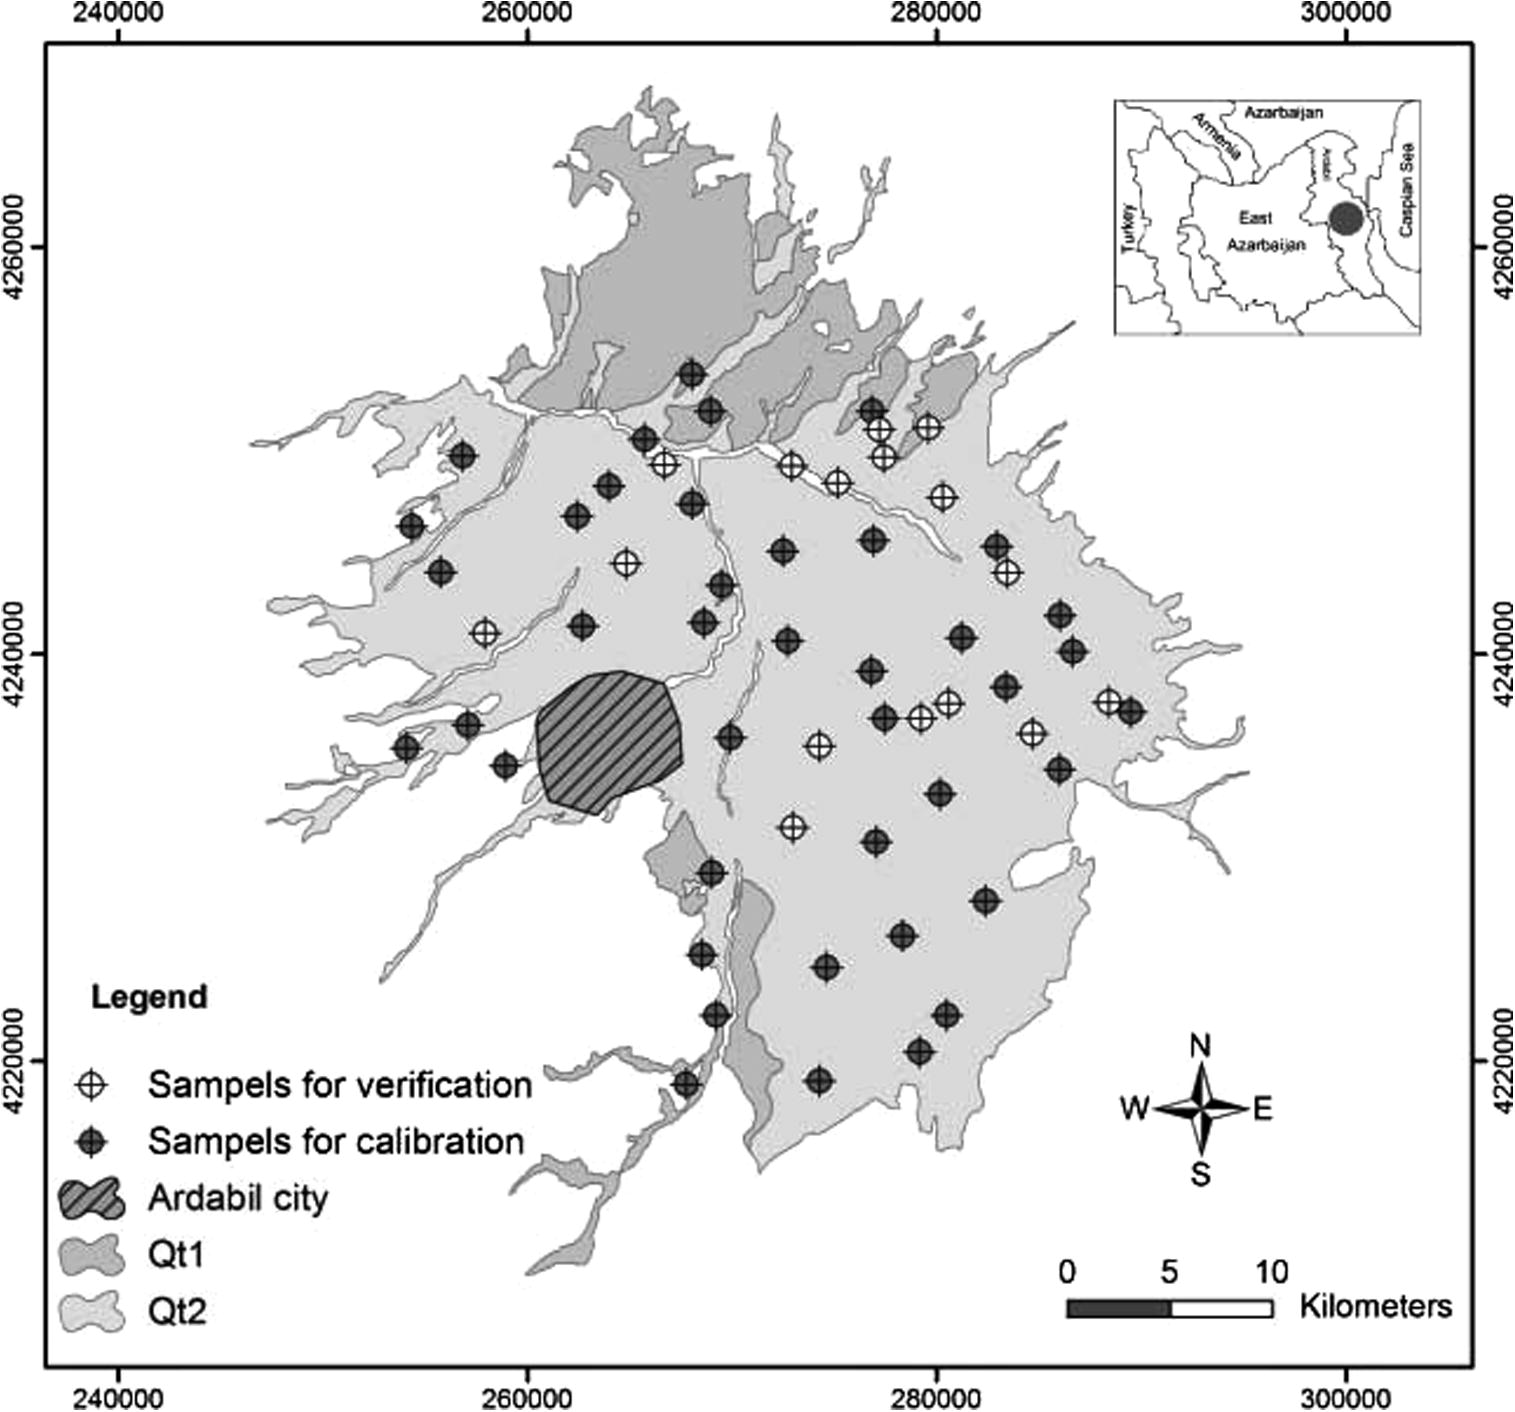
Location of the study area and sampled points.
The samples collected in bottles were immediately transported to the laboratory under standard conditions for quality analysis. Prior to collection, the poly ethylene bottles were washed thoroughly with the sample water. Two types of samples were collected from each well, one for anions and the other for cations. The samples for cations were filtered and acidified in the field (Schwartz and Zhang, 2003; APHA, 1998).
A total of 58 wells were sampled from active water wells for chemical analyses during October 2011. Each sample was analyzed for parameters such as pH, electric conductivity (EC), bicarbonate (
), carbonate (
), chloride (Cl−), fluoride (F−), sulfate (
), calcium (Ca2+), magnesium (Mg2+), sodium (Na+), potassium (K+), nitrate (
), Total hardness (TH), Arsenic (As), Iron (Fe), Lead (Pb) and copper (Cu) in the hydrogeological laboratory of University of Tabriz. The total concentrations of As, Fe, Pb and Cu were analyzed by atomic absorption, F−,
,
by spectrophotometer, Na+ and K− by flame photometer and
,
, Cl−, Ca2+ and Mg2+ via the titration method. It should be noted that EC and pH were also measured in field and TH was calculated from the samples (APHA, 1998). The accuracy of the chemical analyses was carefully examined by checking ion balances (Hounslow, 1995). The ion balance errors for all the samples were less than 5%. A statistical summary of chemical parameters from the groundwater samples is presented in Table 1. EC = electrical conductivity, TDS = total dissolved solids and TH = total hardness.
Parameter
Units
Min
Max
Average
Std
EC
μ mho/cm
300
7150
1411.42
1302.56
TDS
mg/l
189
4504.5
889.20
820.61
pH
–
7.63
8.91
8.36
0.32
Ca2+
mg/l
12.83
657.64
121.58
124.38
Mg2+
mg/l
5.83
272.16
42.85
50.83
Na+
mg/l
7.95
400.43
104.93
80.25
K+
mg/l
0.48
29.16
5.49
6.38
Cl−
mg/l
8
1199.63
166.75
215.61
mg/l
0.57
21.29
6.48
4.32
mg/l
6
1400
236.99
332.92
mg/l
100.04
739.32
300.72
121.56
F−
mg/l
0.29
3.52
0.90
0.50
TH
mg/l
55.99
2759.96
479.65
513.85
As
mg/l
0
0.000037
3.13E-06
6.80E-06
Fe
mg/l
0
2.82E-06
4.06E-07
4.77E-07
Pb
mg/l
1.66E-08
6.99E-07
2.38E-07
1.47E-07
Cu
mg/l
0
3.02E-08
3.12E-09
6.55E-09
Spatial distributions of each of the above mentioned parameters were estimated except for As, Fe, Pb and Cu, which due to being below less than the pollution limits, were estimated by using kriging and fuzzy modeling. They were all applied as inputs to fuzzy system for quality classification.
The proposed methodology for the evaluation of groundwater quality mapping has been shown in Fig. 2.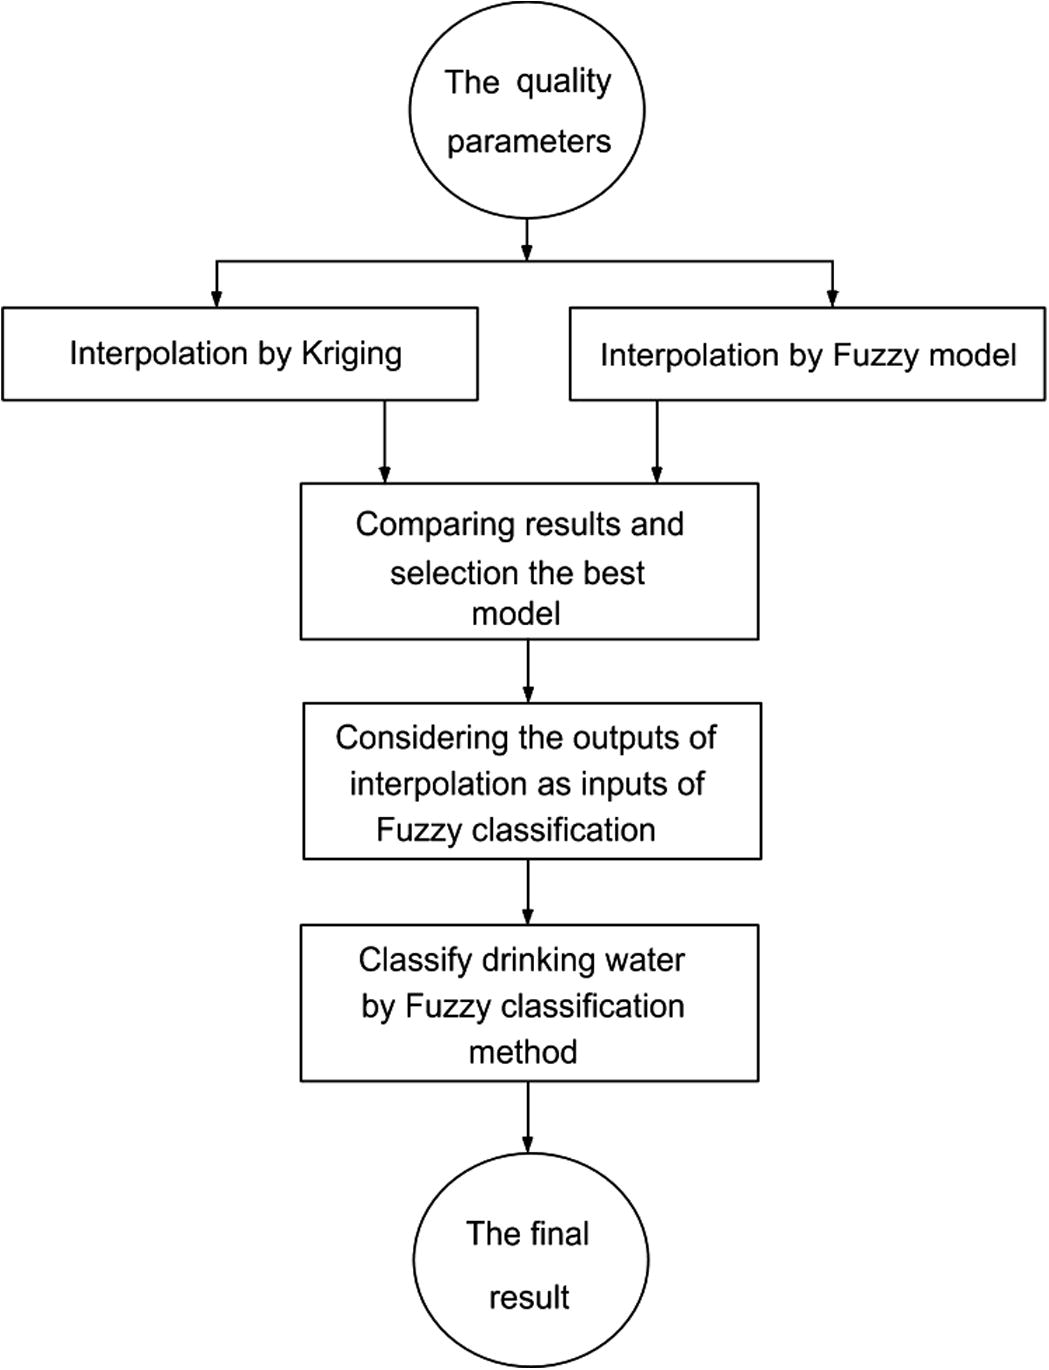
Conceptual diagram of the methodology for classification of groundwater quality.
3 Estimation by kriging
Kriging is a purely linear stochastic technique used in geostatistics using known values and a semivariogram to determine unknown values (Webster and Oliver, 2001).
In kriging, the estimated value, z, at any point x0 is given as follows:
First an experimental semivariogram has to be calculated using the following equation.
After calculating the experimental semivariogram, suitable theoretical models like spherical, exponential and Gaussian are fitted to them and the best model is selected based on the least RSS value and used in the kriging procedure.
4 Estimation by fuzzy modeling
One of the applications of fuzzy theory is modeling. In this modeling approach, input data are shown as membership functions and are related to output data by definition of fuzzy rules.
In this kind of modeling, the Sugeno model is used which includes the following three steps: first, data are classified by the fuzzy clustering method and their optimized cluster numbers are determined. In the next step, data are associated with outputs by defining fuzzy rules and finally, the model parameters are obtained using optimization of least squares errors (Takagi and Sugeno, 1985; Tutmez and Hatipoglu, 2010).
Fuzzy c-means (FCM) is a data clustering technique that assigns each data sample with a certain degree, which is specified by a membership grade, to one or more clusters. FCM aims to minimize the following objective function
In this study, FuzME software was used to cluster the quality parameters for 2–10 classes (Minasny and McBratney, 2002).
So, two cluster validity functions FPI and NCE were minimized by using FuzME to obtain the optimum number of classes (Roubens, 1982; Vitharana et al., 2006). FPI is determined as follows
And MPE is defined as
In the Sugeno model, the outputs are considered linear functions of the inputs and relation between inputs and outputs is described by if-then rules. In this study, the Gaussian function was chosen as input membership functions (Tutmez and Hatipoglu, 2010).
For each quality parameter, latitude and longitude have been taken as inputs and the parameter concentration has been considered as the output. The fuzzy estimator model is shown in Fig. 3.
General form of Sugeno’s model.
In Fig. 3 X is the matrix of fuzzy sets defined in the input space, Z is the matrix of outputs, R is the matrix of rules, α, β and ε are undefined parameters belonging to each rule that should be estimated, A and B are memberships which belong to input x1 and x2, respectively and K is the number of rules that is equal to the number of clusters.
Several methods are available in the literature (Hellendoorn and Thomas, 1993) of which the centroid method was used to obtain final output. Final output is estimated from the following function:
The last stage of modeling is to obtain the parameters of the rules. The least squares error optimization is used to obtain the parameters:
5 Water quality classification by fuzzy
Different water quality standards have been provided by different organizations. Quantitative limits specified in these standards are associated with uncertainties. On the other hand, the quality of water data has also some uncertainty during sampling, data processing, etc. Therefore, making a decision about the quality of water samples under these conditions is difficult. This problem becomes more serious when a quality parameter is close to quality standard limits. Then taking a transient boundary instead of crisp values can reduce the influence of uncertainty in the assessment of water quality.
In this study, the overall structure of the developed model for the interpretation of groundwater quality, is a fuzzy based decision making approach. This approach commonly consists of fuzzification, aggregation, and defuzzification. To do the fuzzification, the fuzzy membership functions for the evaluation of the water quality were defined based on the limits used in the water quality standards. The trapezoidal functions were used as input membership functions (Dahiya et al., 2007).
In aggregation, the fuzzy sets representing the outputs of each rule are combined into a single fuzzy set. The intersection of memberships was used for calculating each rule and the union of each rule’s output set was used for aggregation. Finally, to convert the fuzzy results to crisp numbers, the centroid defuzzification technique, described above, was applied (Eq. (11)).
6 Results
In order to interpolate the quality parameters 70% and 30% of the sampled data have been used for modeling and verification, respectively.
Before interpolation by kriging, the normality of all parameters was checked. For parameters without normal distribution, a lognormal transform was used. The characterization of the best theoretical model fitted to each experimental variogram is shown in Fig. 4 and given in Table 2.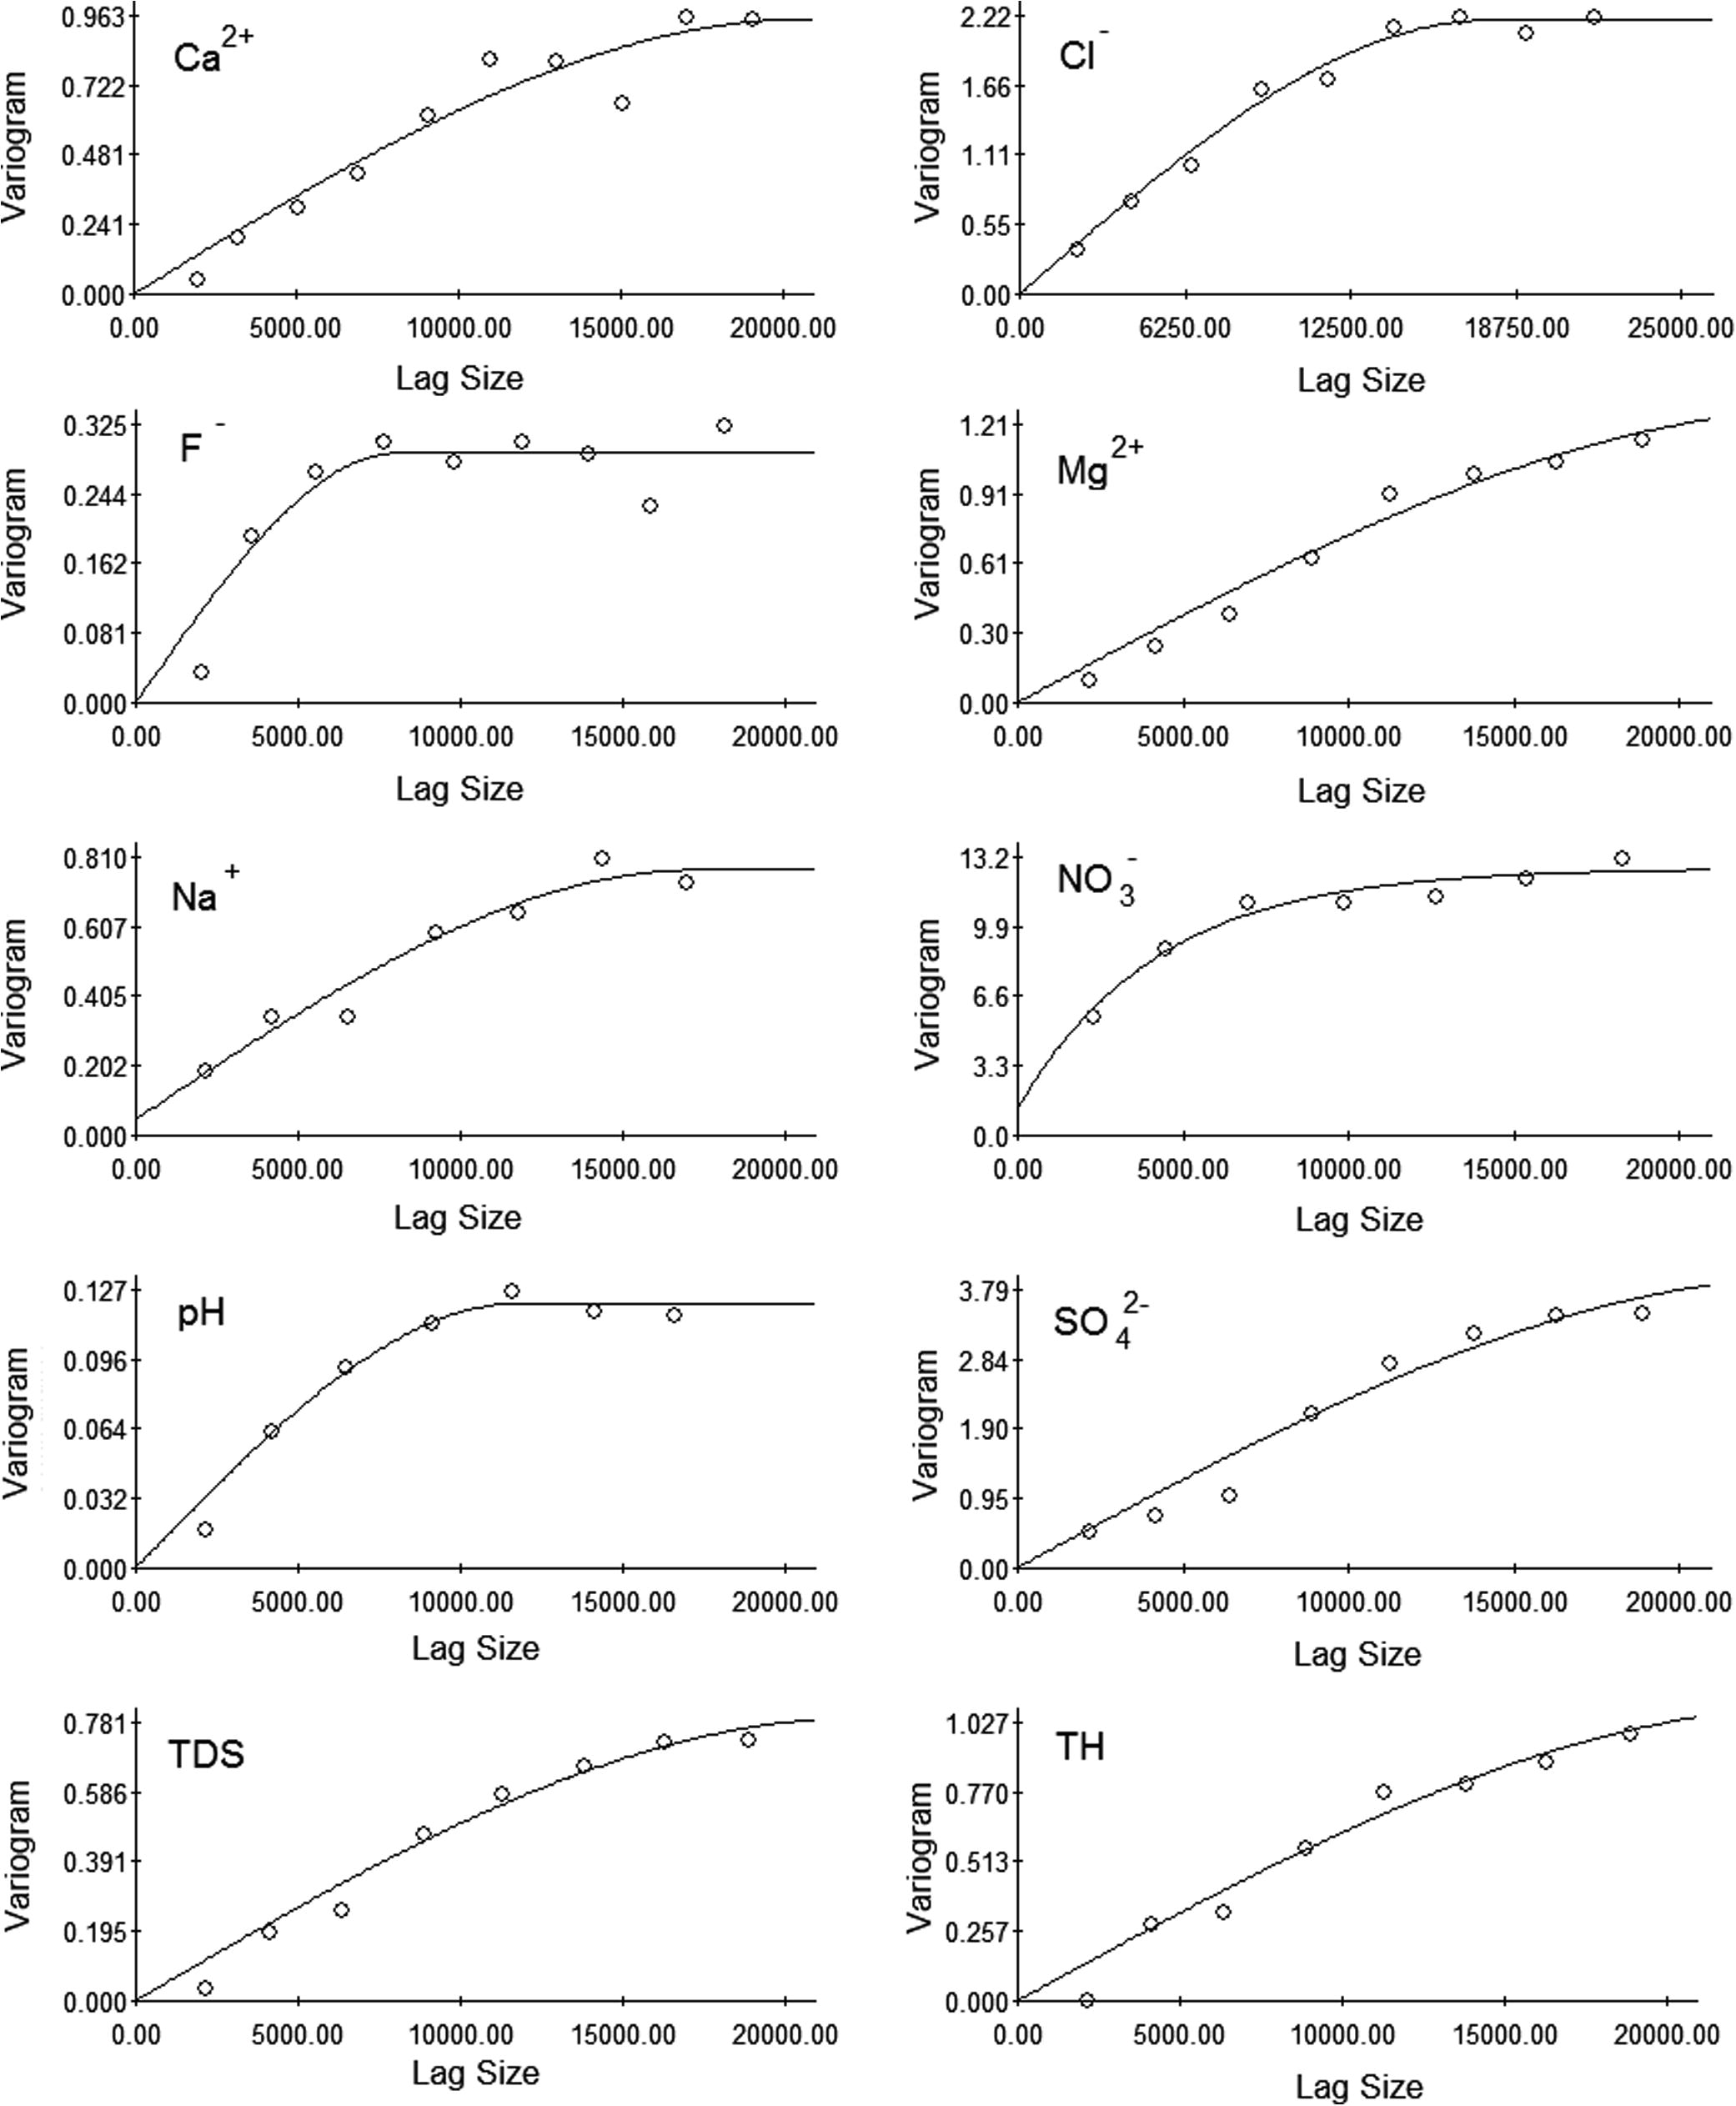
Experimental and fitted variogram for different data sets.
Parameters
Model
Nugget effect
Sill
Range
Nugget/sill
R2
RSS
Ca2+
Spherical
0.0010
0.9510
20720
0.001052
0.931
0.0669
Cl−
Spherical
0.001
2.180
17740
0.000459
0.987
0.0535
F−
Spherical
0.0001
0.2912
8070
0.000343
0.870
0.0103
Mg2+
Spherical
0.0010
1.280
24900
0.000781
0.980
0.0308
Na+
Spherical
0.0470
0.7720
17240
0.060881
0.948
0.0168
Exponential
1.280
12.690
4220
0.100867
0.953
1.80
pH
Spherical
0.00
0.121
11810
0
0.978
2.9E -4
Spherical
0.010
3.973
24420
0.002517
0.963
0.490
TDS
Spherical
0.0010
0.7940
22350
0.001259
0.983
0.0143
TH
Spherical
0.0010
1.0830
24760
0.000923
0.971
0.0316
In addition to kriging, fuzzy modeling was used for estimation. Fuzzy model inputs are the geographical coordinates and outputs are measured concentrations. Since the UTM values are large numbers, they were initially normalized between zero and one. After that, the quality data were clustered with an optimum number of classes using FCM for each quality parameter. For instance, Fig. 5 shows the values of FPI and MPE versus the number of clusters for Cl−. According to the lowest values of FPI and MPE the optimal numbers of clusters for Ca2+, Cl−, F−, Mg2+, Na+,
, pH,
, TDS and TH are 3, 2, 2, 2, 4, 6, 4, 3, 12 and 3, respectively.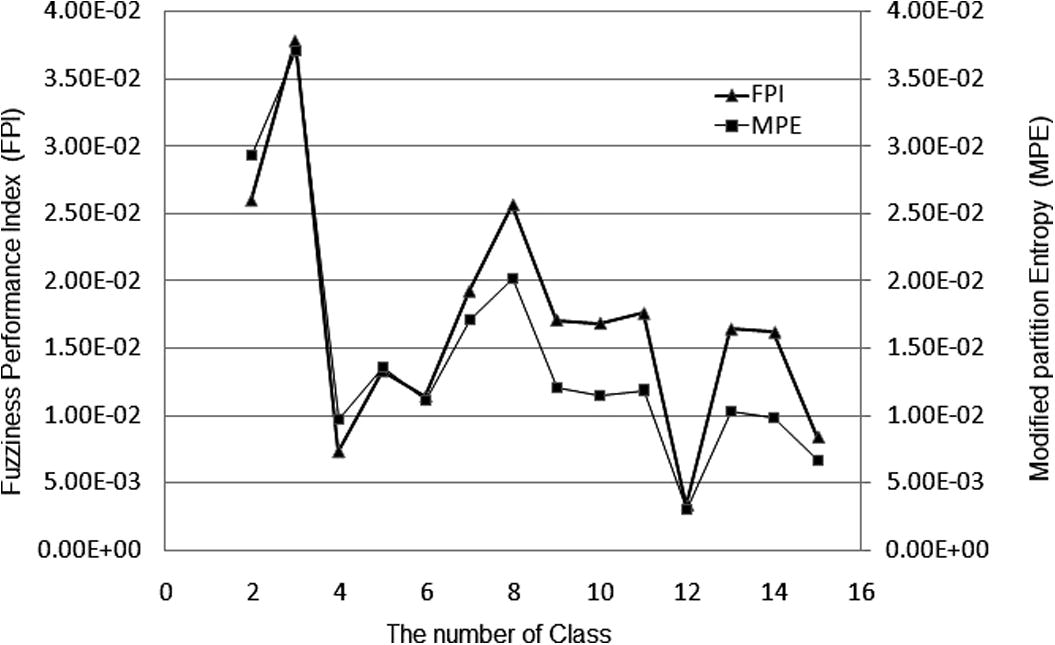
FPI and MPE, versus the number of classes for the Cl− data set.
In this study, performance of kriging and fuzzy logic models was compared on the basis of the coefficient of determination (R2), root mean square error (RMSE) and mean absolute error (MAE) (Tutmez and Hatipoglu, 2010) given in Table 3.
Parameter
Data
RMSE
MAE
R2
Ca2+
Kriging
47.1573
0.7176
0.76171816
Fuzzy modeling
42.2353
0.5541
0.822991826
Cl−
Kriging
64.9835
0.9219
0.849382157
Fuzzy modeling
35.4319
0.5701
0.968715802
F−
Kriging
0.2868
0.3334
0.309723564
Fuzzy modeling
0.2151
0.2840
0.660687166
Mg2+
Kriging
14.5079
0.4693
0.759009822
Fuzzy modeling
12.2509
0.6244
0.905060303
Na+
Kriging
45.3502
0.4846
0.882993387
Fuzzy modeling
43.1404
0.4662
0.891866326
Kriging
6.1532
0.3659
0.46938328
Fuzzy modeling
4.6357
0.3451
0.773955551
pH
Kriging
0.2965
0.0298
0.439166828
Fuzzy modeling
0.2172
0.0206
0.614699905
Kriging
125.135
1.0524
0.841515435
Fuzzy modeling
96.9842
0.5494
0.912377149
TDS
Kriging
229.5268
0.3423
0.828621537
Fuzzy modeling
306.3463
0.4415
0.83239726
TH
Kriging
160.9282
0.5735
0.792829974
Fuzzy modeling
156.424
0.4963
0.80847107
7 Discussion
According to the results presented in Table 3, the fuzzy model provides better results compared to kriging. Therefore, in this study after structure design and verification of the model, the fuzzy logic modeling was used to estimate unmeasured quality parameters throughout the study area.
A large number of spatial points causes the interpolated map to be smoother but the run time will be longer. So the model was applied to a 500 × 500 matrix and the results are shown in Fig. 6 on a raster.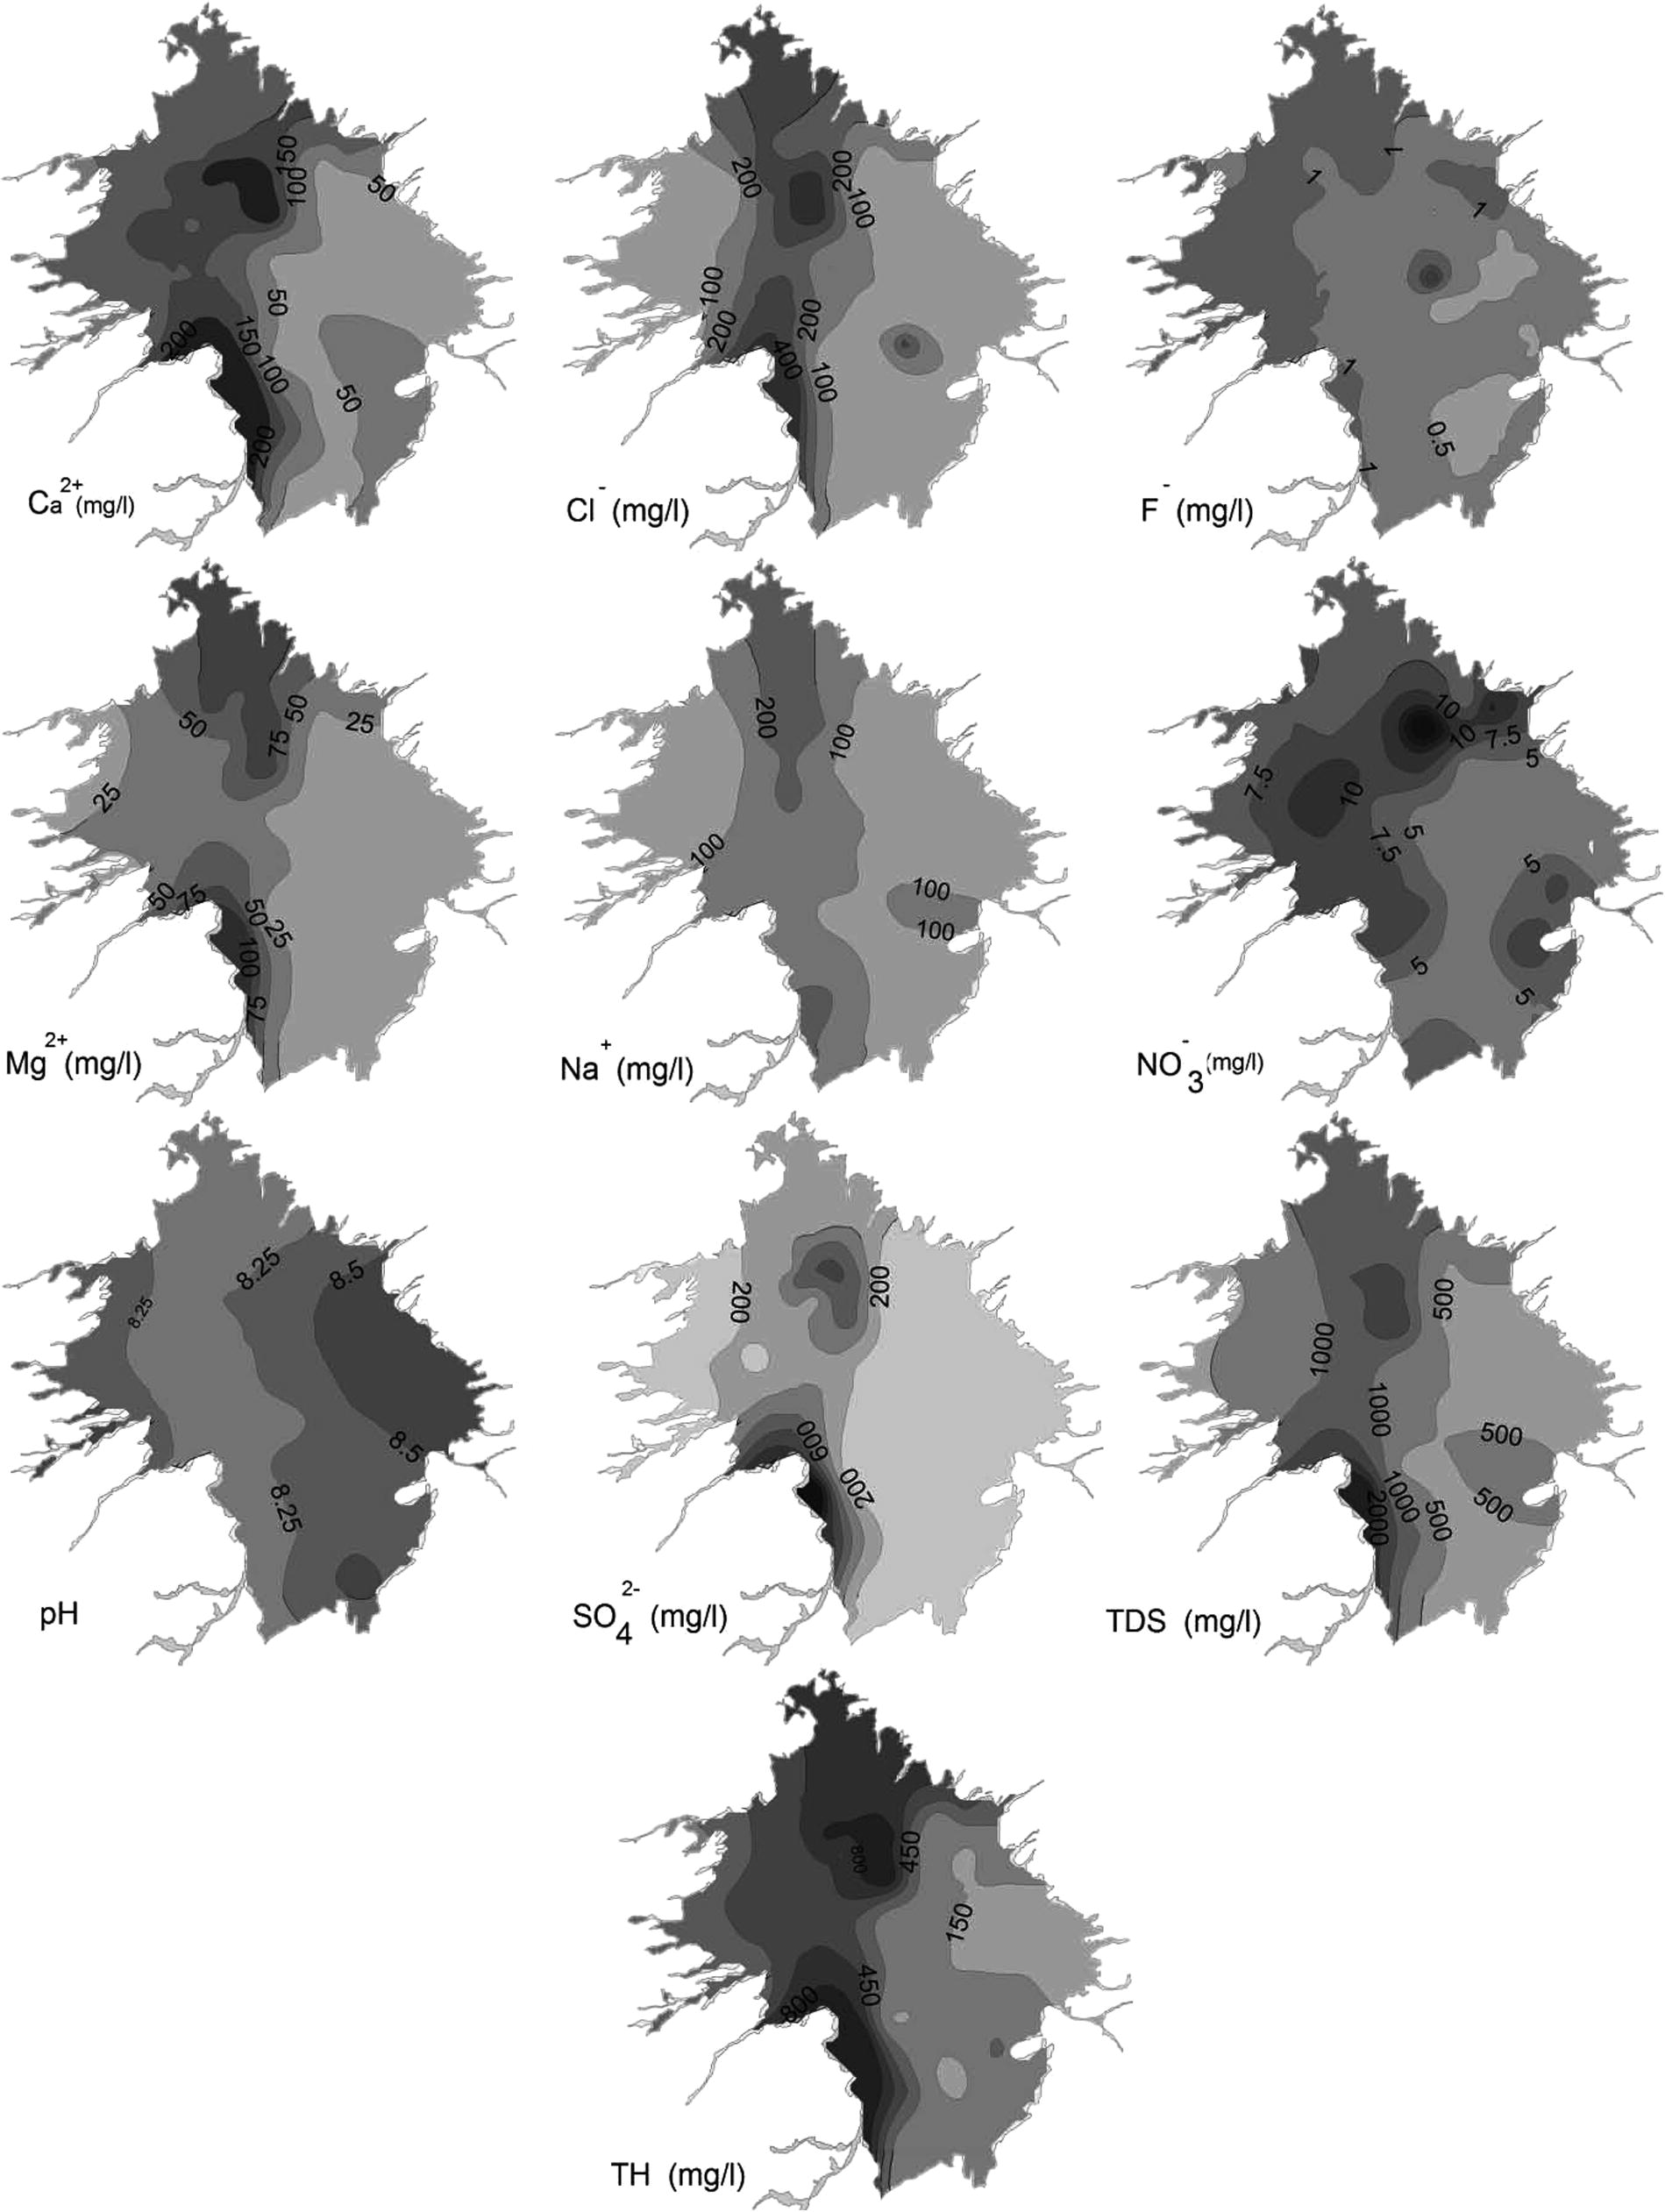
Contour maps of water quality parameters generated by fuzzy model.
In the present study, the ISIRI drinking water standard has been used for groundwater quality assessment by fuzzy logic which is presented in Table 4.
Parameter
Unit
MCLGa
MCLb
TDS
mg/l
500
1500
pH
–
7–8.5
6.5–9.2
Ca2+
mg/l
75
200
Mg2+
mg/l
50
150
Na+
mg/l
60
200
Cl−
mg/l
200
600
mg/l
10
45
mg/l
200
400
F−
mg/l
1.7
2
TH
mg/l
150
500
The adjusted membership functions of water quality parameters based on the ISIRI standards are shown in Fig. 7.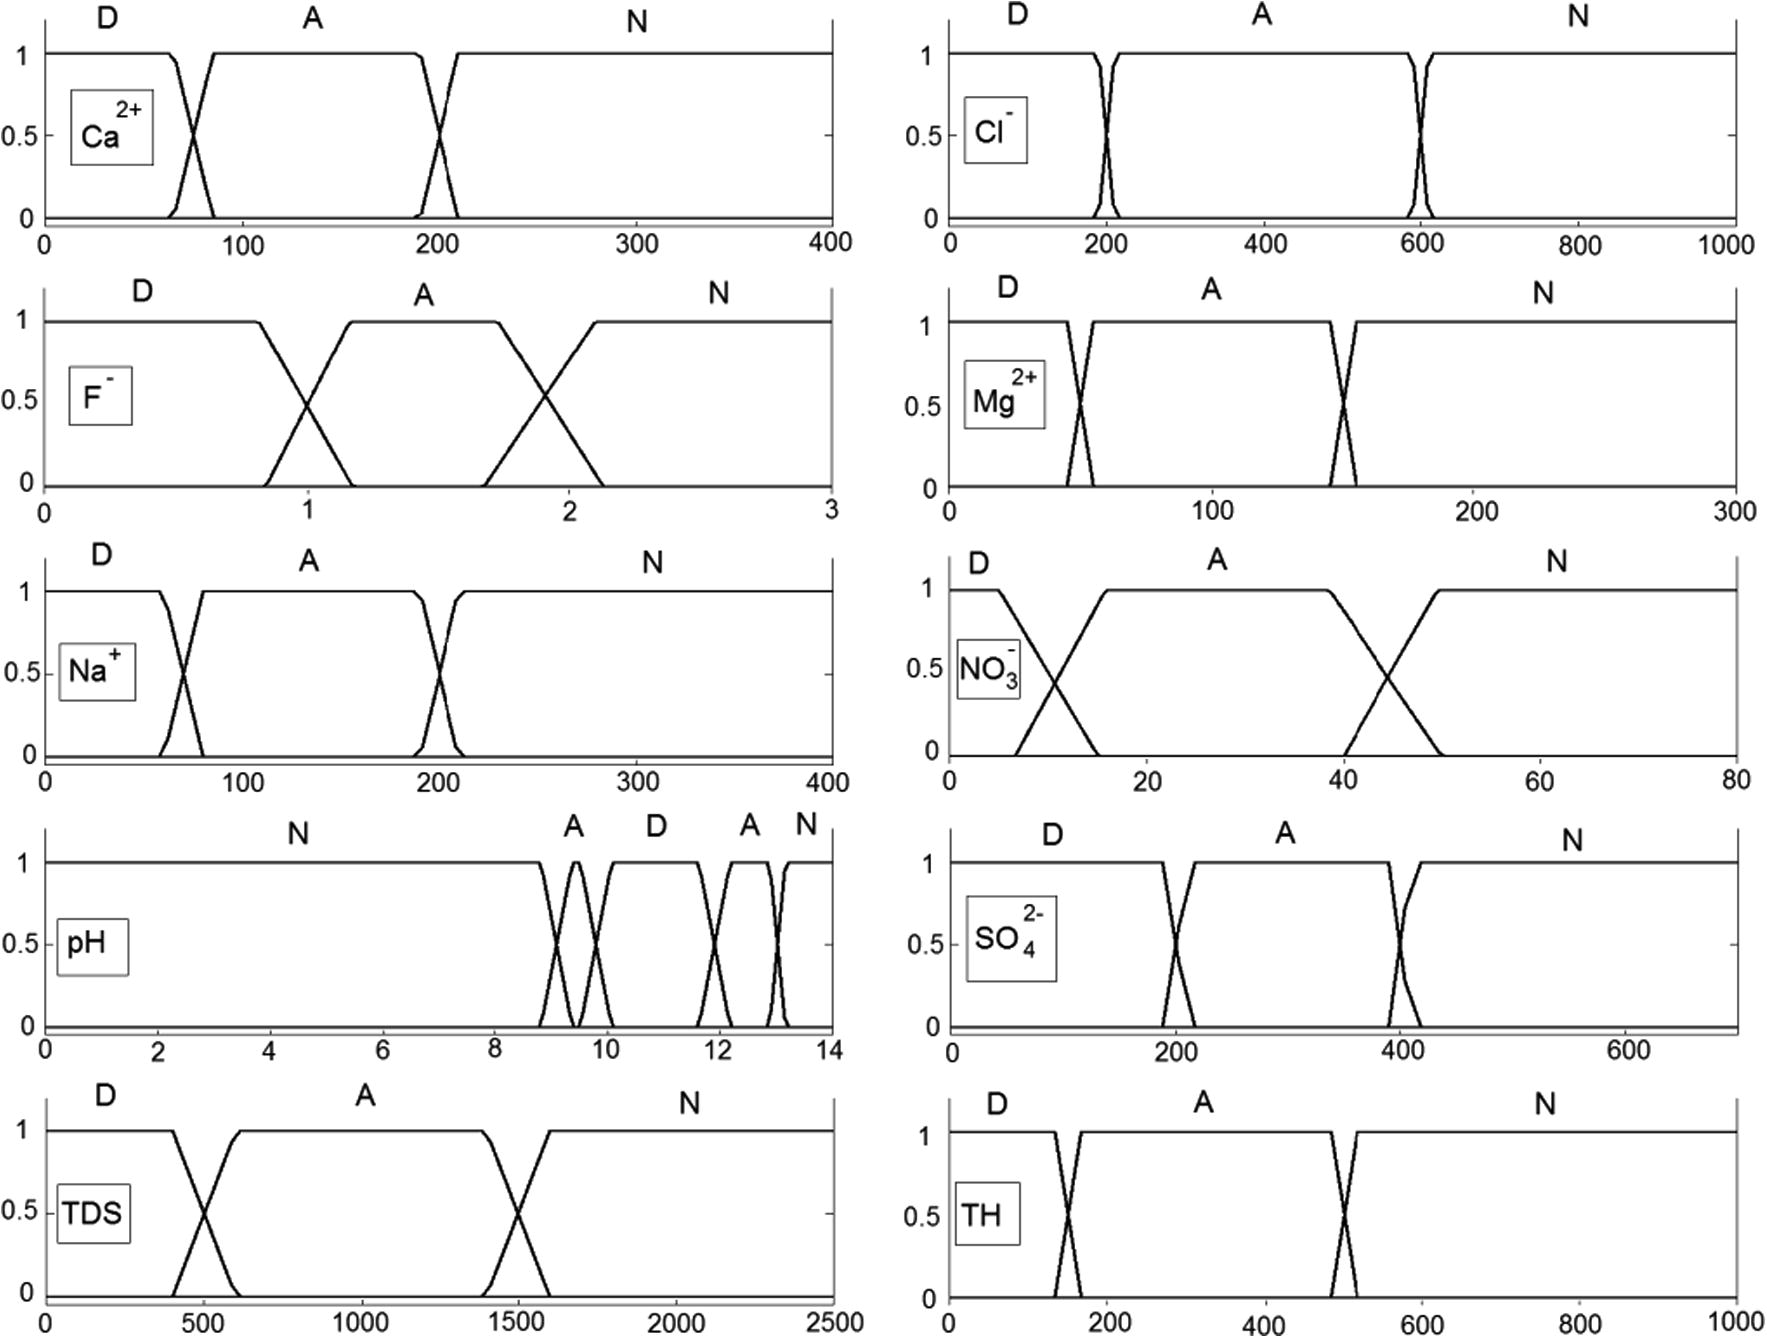
Membership functions defined for water quality parameters used in the study. ‘D’, ‘A’ and ‘N’ are abbreviations of ‘Desirable’, ‘Acceptable’ and ‘Not acceptable’, respectively.
Designing the fuzzy rule database consisting a set of logical rules expressing the relationship between fuzzy variables, is the most important part of a fuzzy system. Robustness of the system depends on the number and quality of the rules. Due to the large number of clusters and standard limits, the number of all possible states of fuzzy rules is extremely high. So in order to consider all states, the quality parameters were divided into four categories based on their significance in the evaluation of drinking water quality. The qualitative parameters were categorized into three groups i.e. TDS, pH, Cl− and in the first group, Na+, TH, Ca2+ and Mg2+ in the second while nitrate and fluoride were individually considered as separate groups due to their importance (Fig. 8). The final result was obtained by evaluating the combined results of these four groups. Out of a total of 297 rules to classify drinking water qualities, 81 rules were kept for the final result and 135 and 81 rules were specified for the first and second groups, respectively. In case of the first group, second group and final results, 3 sample rules are structured as follows:
-
Rule 1. If TDS is acceptable, pH is desirable, Cl− is desirable and is desirable then: groundwater sample quality is acceptable for drinking purpose.
-
Rule 2. If Na+ is not acceptable, Ca2+ is desirable, Mg2+ is acceptable and TH is desirable then: groundwater sample quality is not acceptable for drinking purpose.
-
Rule 3. If group 1 is desirable, group 2 is acceptable, nitrate is not acceptable and fluoride is acceptable then: groundwater sample quality is not acceptable for drinking purpose.
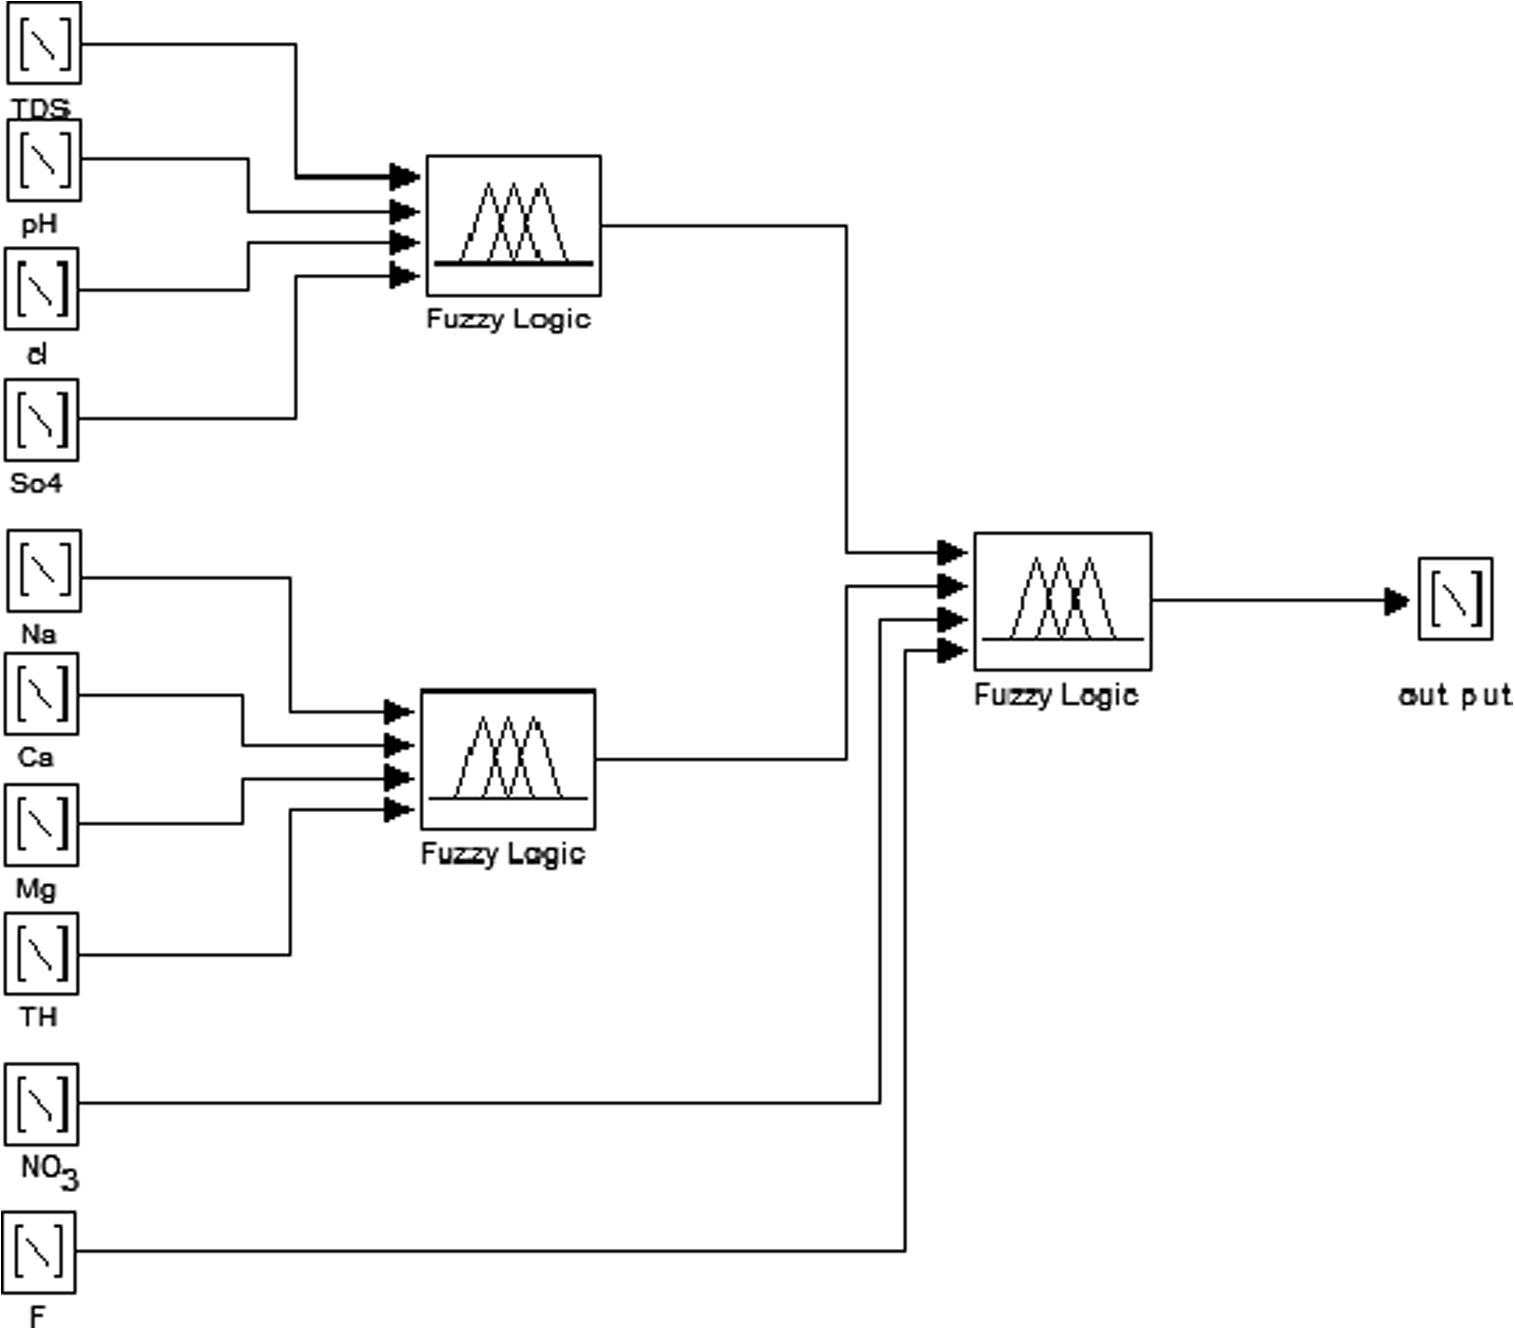
- Block Diagram of fuzzy based decision making for water quality classification.
In the same way, other rules were defined. Although the rule base definition was briefly described above, a wide description can be found in Dahiya et al. (2007) and Ross (2004).
Finally the fuzzy logic system generates the qualitative spatial distribution map of the plain employing the ten inputs mentioned above with the fuzzy approach to drinking water quality standard. This zoning map is presented in Fig. 9. Beside Fuzzy classification, a simple overlay technique was applied to classify potable groundwater. Fig. 10 shows the output of this technique.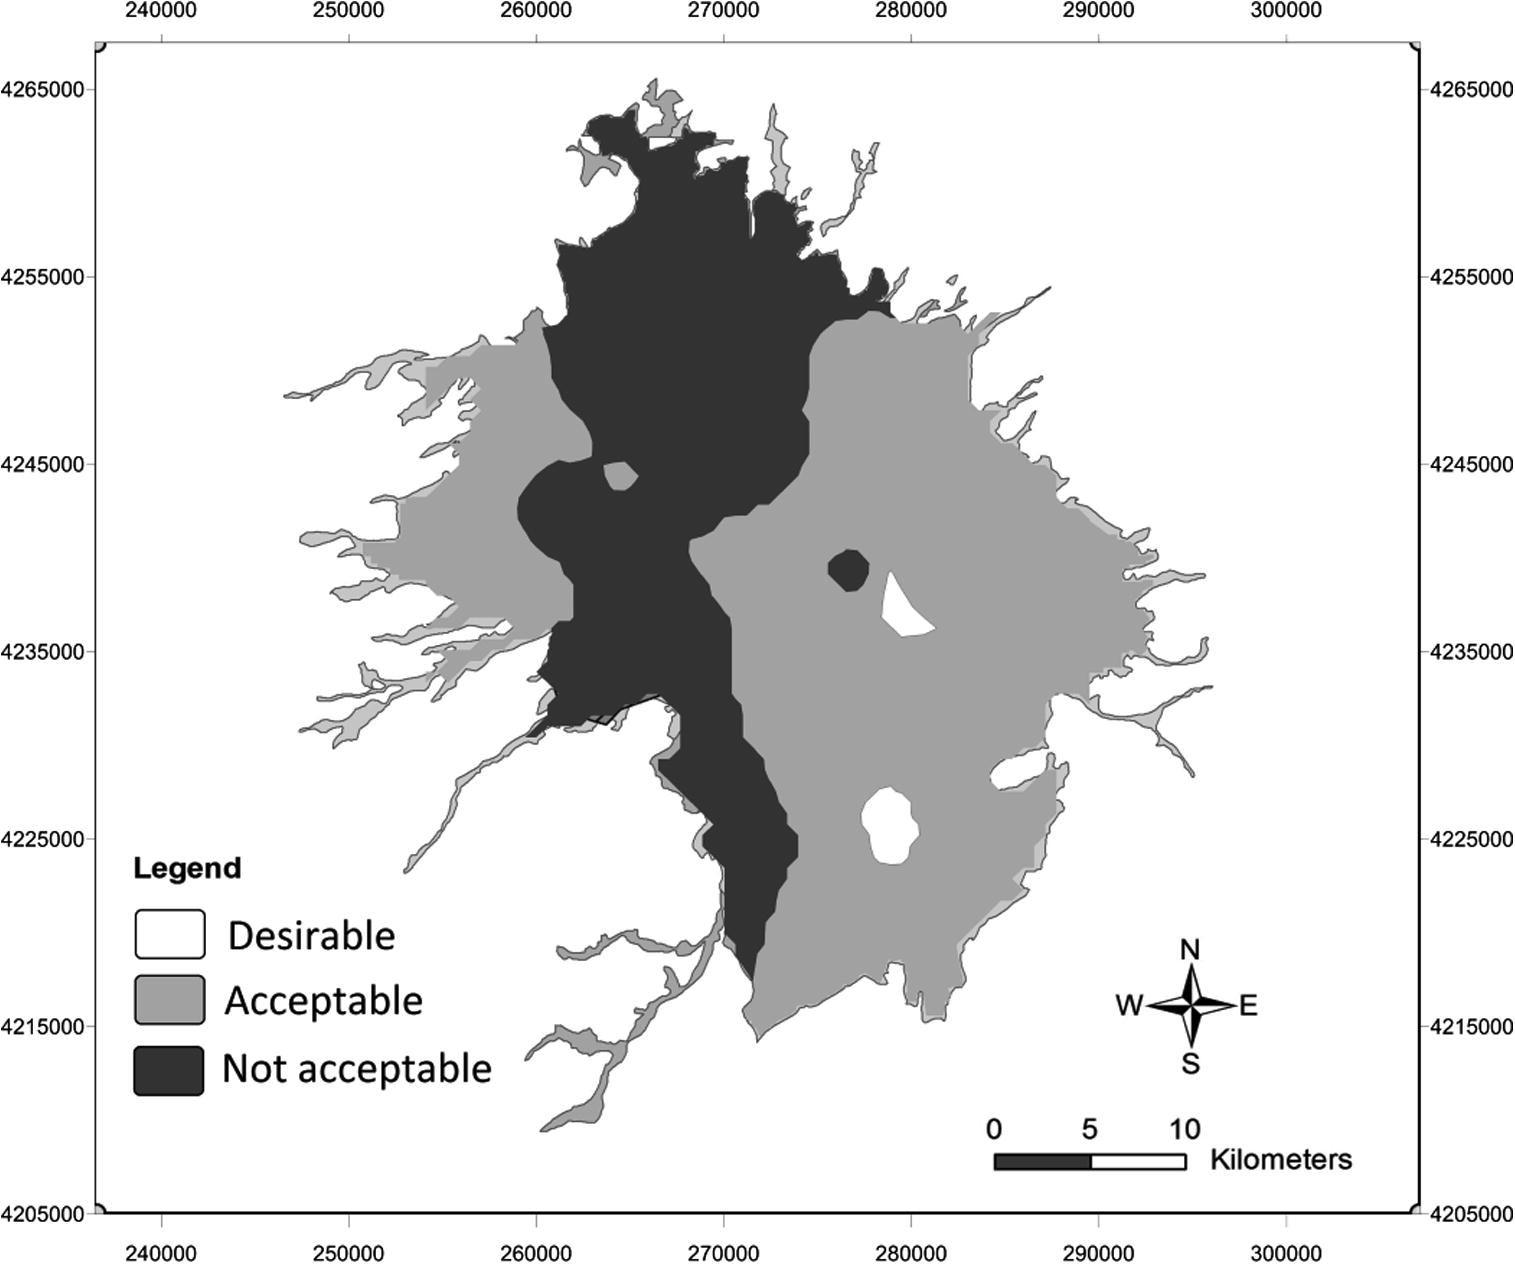
Potable water zoningmap for Ardabil plain aquifer generated by fuzzy logic.
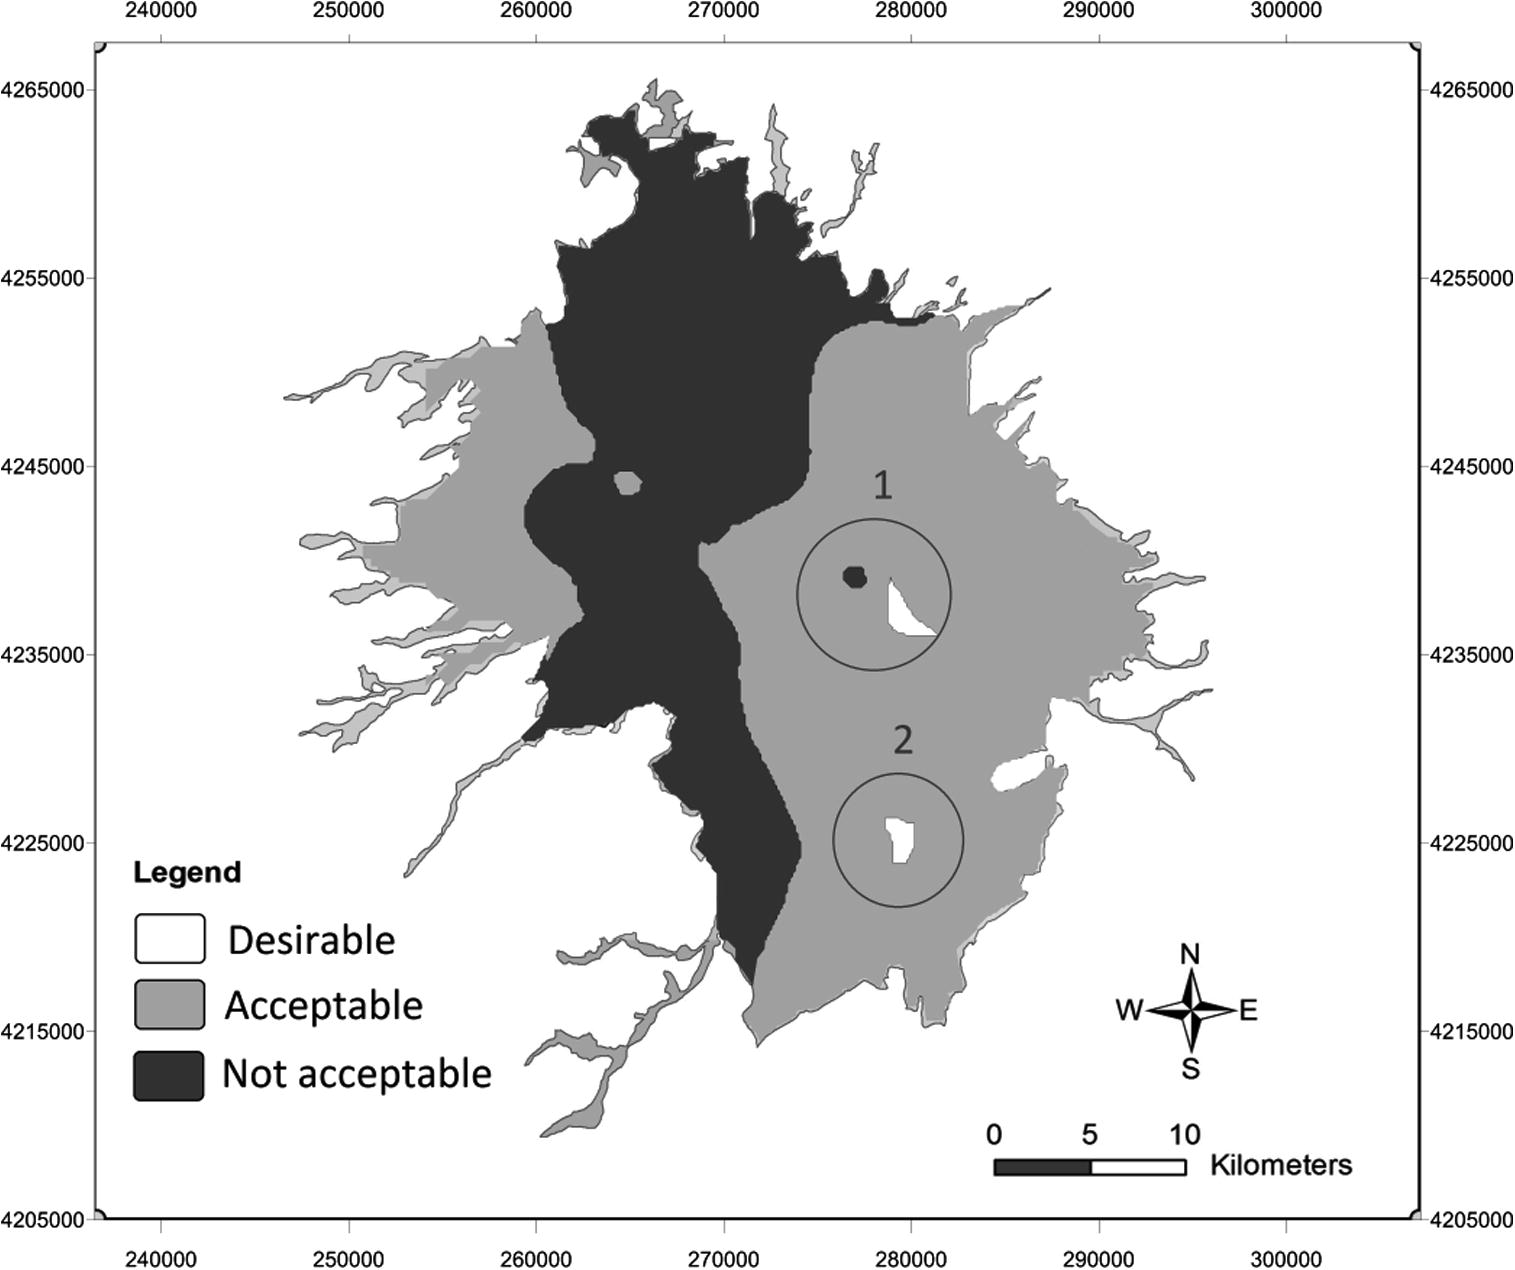
Potable water zoningmap for Ardabil plain aquifer generated by simple overlay.
The effect of the fuzzy function on the results is cleared by comparing Fig. 9 and Fig. 10 especially in circles that specified in Fig. 10. In circle (1), not acceptable area has been defined greater by fuzzy classifier due to F− and Cl− amounts close to MCLG. In this circle, desirable area has also been marked out greater because of TDS and TH amounts near to MCL.
The amounts of Na+ in circle (2) are very close to MCL and therefore by considering a transient boundary instead of sharp boundary, desirable area has been extended. In circle (1) desirable areas are located in short distance from not acceptable area, so with respect to quality parameter amounts in this part of aquifer, it can be concluded that the fuzzy logic classifier has a good performance.
8 Conclusion
Sampling in all parts of the study area at closed distances is not possible. On the other hand, it is clear that the reliability of spatial distribution maps of elements and pollutants plays a very important role in water resource management and also the interpolation methods are powerful tools in estimating data based on spatial structure. Hence, kriging and fuzzy modeling were used in this study to investigate the spatial distribution of water quality parameters. The results showed that the fuzzy model is more efficient than the kriging approach.
By using fuzzy logic and FCM modeling the spatial distribution structure of the data can be identified properly and it enables us to overcome the limitations and difficulties such as anisotropy of data which is associated with kriging. Therefore, in the vast areas where outputs of geostatistical methods are not accurate enough due to limited numbers of monitoring points and large distances between them, use of this method may be convenient and efficient to generate zoning maps and interpolation of data.
After interpolation of the quality parameters the classification of the quality status of the groundwater was determined as a fuzzy decision making problem.
In this study, ten qualitative interpolated parameters were used to classify potable groundwater. Since each parameter has a 500 × 500 matrix, it is not easy to compare them simultaneously. A fuzzy logic system compared these quality parameters with drinking water quality standards in the least possible time. On the other hand, qualitative sampled data and the prescribed limits in the drinking water quality standard are associated with uncertainty. This uncertainty can be mitigated with a fuzzy approach.
It was shown that most parts of the aquifer have acceptable and desirable water quality for drinking purposes; but groundwater in the Southwest and North of the plain is not acceptable for drinking. These areas are in conformity with Miocene formations. This spatial distribution map can help a lot for groundwater supply and offers a good insight of groundwater qualitative trend in this study area.
Acknowledgement
The authors gratefully acknowledge Prof. Dr. Wolfgang Kinzelbach for his valuable scientific advice.
References
- Continuous soil pollution mapping using fuzzy logic and spatial interpolation. Geoderma. 2005;124:223-233.
- [Google Scholar]
- Standard Method for the Examination of Water and Wastewater (17th ed.). Washington, DC: American Public Health Association; 1998.
- Evaluation of Uncertainties and Risks in Geology. Heidelberg: Springer-Verlag; 2004.
- Fuzzy Logic in Hydrology and Water Resources. Elsevier; 2003.
- Fuzzy mathematical methods for soil survey and land evaluation. Journal of Soil Science. 1989;40:477-492.
- [Google Scholar]
- Identification of river water quality using the fuzzy synthetic evaluation approach. Journal of Environmental Management. 2001;63:293-305.
- [Google Scholar]
- Analysis of groundwater quality using fuzzy synthetic evaluation. Journal of Hazard Materials. 2007;147:938-946.
- [Google Scholar]
- On the kriging of groundwater table elevations using collateral information form a digital elevation model. Geological Survey of Canada. 2002;255:25-38.
- [Google Scholar]
- Geostatistical Software Library and User’s Guide. New-York: Oxford University Press; 1998.
- Water quality analysis in rivers with non-parametric probability distributions and fuzzy inference systems: application to the Cauca River, Colombia. Environment International. 2013;52:17-28.
- [Google Scholar]
- Assessment of nitrate pollution in the Grand Morin Aquifers (France): combined use of geostatistics and physically-based modeling. Environmental Pollution. 2007;146:241-256.
- [Google Scholar]
- A novel approach in water quality assessment based on fuzzy logic. Journal of Environmental Management. 2012;112:87-95.
- [Google Scholar]
- Defuzzification in fuzzy controllers. Intelligent and Fuzzy Systems. 1993;1:109-123.
- [Google Scholar]
- Water Quality Data: Analysis and Interpretation. Lewis Publisher; 1995.
- Institute of Standard and Industrial Research of Iran (ISIRI), 1997. Characteristics of Drinking Water. Standard No. 1053. The 4th and 5th editions, Commission of the standard and drink water characteristics.
- Geostatistical analysis and conditional simulation for estimating the spatial variability of hydraulic conductivity in the Choushui river alluvial fan. Taiwan. Hydrological Processes. 2004;18:1333-1350.
- [Google Scholar]
- ANN and Fuzzy logic models for the prediction of groundwater level of a watershed. International Journal on Computer Science and Engineering, Engineering Journals Publications. 2011;3:2523-2530.
- [Google Scholar]
- Comparison of groundwater level estimation using neuro-fuzzy and ordinary Kriging. Environ Model Assess, Springer Science. 2008;14:729-737.
- [Google Scholar]
- Investigation of hydrogeological characteristics of Ardabil Plain aquifer, Northwest of Iran. ISESCO Journal of Science and Technology. 2013;9(15):63-69.
- [Google Scholar]
- Strategy for groundwater management in developing countries: a case study in Northern Costa Rica. Geomorphology. Journal of Hydrology. 2007;334:109-124.
- [Google Scholar]
- Minasny, B., McBratney, A.B., 2002. FuzME Version 3. Australian Center for Precision Agriculture The University of Sydney NSW 2006, Australia. Available from <http://www.usyd.edu.au/su/agric/acpa/fkme/program.html>.
- Modeling flow and nitrate transport in groundwater for the prediction of water travel times and of consequences of land use on water quality. Hydrological Processes. 2002;16:479-492.
- [Google Scholar]
- A fuzzy logic approach to assess groundwater pollution levels below agricultural fields. Environmental Monitoring and Assessment, Springer. 2006;118:337-354.
- [Google Scholar]
- Fuzzy Logic with Engineering Applications. John Wiley and Sons; 2004.
- Fuzzy clustering algorithms and their cluster validity. European Journal of Operational Research. 1982;10:294-301.
- [Google Scholar]
- Assessing groundwater quality for potability using fuzzy logic and GIS-a case study of Tiruchirappalli city – India. Computer modelling and new technologies, transport and telecommunication institute, Lomonosova. 2010;14:58-68.
- [Google Scholar]
- Statistical Center of Iran., 2011. Implementation of the 2011 Iranian Population and Housing Census, Iran.
- River water quality assessment: a comparison of binary- and fuzzy logic-based approaches. Ecological Engineering. 2012;47:132-140.
- [Google Scholar]
- Fundamentals of Ground Water. John Wiley and Sons; 2003.
- Geostatistical analysis of sorptivity for a soil under tilled and no-tilled conditions. Soil & Tillage Research. 2004;86:237-245.
- [Google Scholar]
- Optimization of marine environmental monitoring sites in the Yangtze River estuary and its adjacent sea, China. Ocean and Coastal Management. 2013;73:92-100.
- [Google Scholar]
- Development of an Entropy-based Fuzzy Eutrophication Index for reservoir water quality evaluation. Iran. J. Environ. Health. Science & Engineering. 2010;7:1-14.
- [Google Scholar]
- Fuzzy identification of systems and its applications to modeling and control. IEEE Transactions on Systems, Man and Cybernetics. 1985;5:116-132.
- [Google Scholar]
- Fuzzy logic algorithms for ruoff-induced sediment transport from bare soil surfaces. Advances in Water Resources. 2003;26:1249-1256.
- [Google Scholar]
- Comparing two data driven interpolation methods for modeling nitrate distribution in aquifer. Ecological Informatics. 2010;5:311-315.
- [Google Scholar]
- Identifying potential management zones in a layered soil using several sources of ancillary information. Soil Use and Management. 2006;22:405-413.
- [Google Scholar]
- 3D geological modeling for mineral resource assessment of the Tongshan Cu deposit, Heilongjiang Province, China. Geosience Frontiers. 2012;3(4):483-491.
- [Google Scholar]
- Geostatistical and geochemical analysis of surface water leakage into groundwater on a regional scale: a case study in the Liulin karst system, Northwest China. Journal of Hydrology (Amsterdam). 2001;246:223-234.
- [Google Scholar]
- Geostatistics for Environmental Scientists. Chichester: John Wiley and Sons; 2001.
- Analysis and study on space variation laws of rainfall of Yuanyang Hani terrace. International Conference on Structural Computation and Geotechnical Mechanics, Procedia Earth and Planetary Science. 2012;5:94-101.
- [Google Scholar]


