

Translate this page into:
Site effect estimation for shallow engineering bedrock using microtremor HVSR method and geotechnical borehole data, Riyadh city, Saudi Arabia
⁎Corresponding author. nalotaibic@KSU.EDU.SA (Naif Al-Otaibi)
-
Received: ,
Accepted: ,
This article was originally published by Elsevier and was migrated to Scientific Scholar after the change of Publisher.
Peer review under responsibility of King Saud University.
Abstract
The estimation of local site response and geotechnical properties of near-surface deposits becomes essential for improving the building codes especially in big cities as Riyadh. This study aims to estimate the site response parameters in the northern expansion zone of Riyadh city. Microtremor measurements were recorded at 45 sites at the study area, north of Riyadh, and the resonance frequency and amplification factor were calculated using the H/V spectral ratio approach. The microtremor data has been processed using geopsy software to get the H/V curve and get the value of the resonance frequency (fo) and amplitude (Ao). The values of the resonance frequency span from 0.79 to 45 Hz, while the amplification factor ranges from 1.22 to 8.5, indicating the presence of foundation bedrocks at various levels with varying soil thickness. Moreover, the N60 parameter was calculated to correct the SPT-N uncorrected field readings in order to estimate the shear wave velocity parameter down to 30 m depth (Vs30). The computed shear wave velocity for a depth of 30 m (Vs30) ranges from 210 to 630 m/s. Accordingly, the soil at the studied area can be divided into two site soil classes C and D according to the National Earthquake Hazard Reduction Program (NEHRP). The findings of this study should be considered as part of the development of the Saudi Building Code for Riyadh City.
Keywords
Site response
Amplification
Resonance frequency
Shear-wave velocity
Riyadh
Saudi Arabia

1 Introduction
The site effect, which occurs when the amplitude and frequency content of entering seismic waves are modified by the geological and geotechnical features of the surficial sediments, is crucial in this regard in case earthquake occurs (Seed et al., 1976) Borcherdt (1994) developed a simplified empirical approach for delineating local site categories and associated amplification factors in terms of the time-averaged Shear-wave velocity of the top 30 m, Vs30, to improve its understanding. Since then, building codes (e.g., BSSC, 2004) have used Vs30 to determine the seismic lateral forces induced by ground motion.
Riyadh City is the most crowded metropolitan center in Saudi Arabia, located in central Saudi Arabia on the Najd plateau at an elevation of 612 m above sea level. Due to recent urban expansion, Riyadh is now considered a crowded metropolis with a population of more than 8,000,000 people and an annual growth rate of 2.9 percent (General Authority of Statistics, 2016). As a result, there was a dramatic surge in development projects all across the city, with a northward tendency. As a result, geotechnical studies are critical for avoiding any potential dangers like cavities, sinkholes, and other geotechnical problems. Microtremor measurements (Nakamura's approach) are a popular method for estimating geotechnical parameters since it is a simple, low-cost method. It is also appropriate for use in populated and metropolitan regions (Abdel-Rahman et al., 2012).
It simply calculates the fundamental frequency (fo) and amplification factor (Ao) based on the horizontal-to-vertical spectral ratio (HVSR). 45 microtremor data were taken in this study, and they were connected with 11 boreholes sunk recently in the investigation site (Soil& Foundation limited company) (Fig. 1). There are numerous soil features that can be quite valuable in determining the local site effect, whether they are chemical or mechanical (e.g., Standard Penetration Test (SPT), Rock-quality designation (RQD), Grain size analysis, Groundwater level (GWL).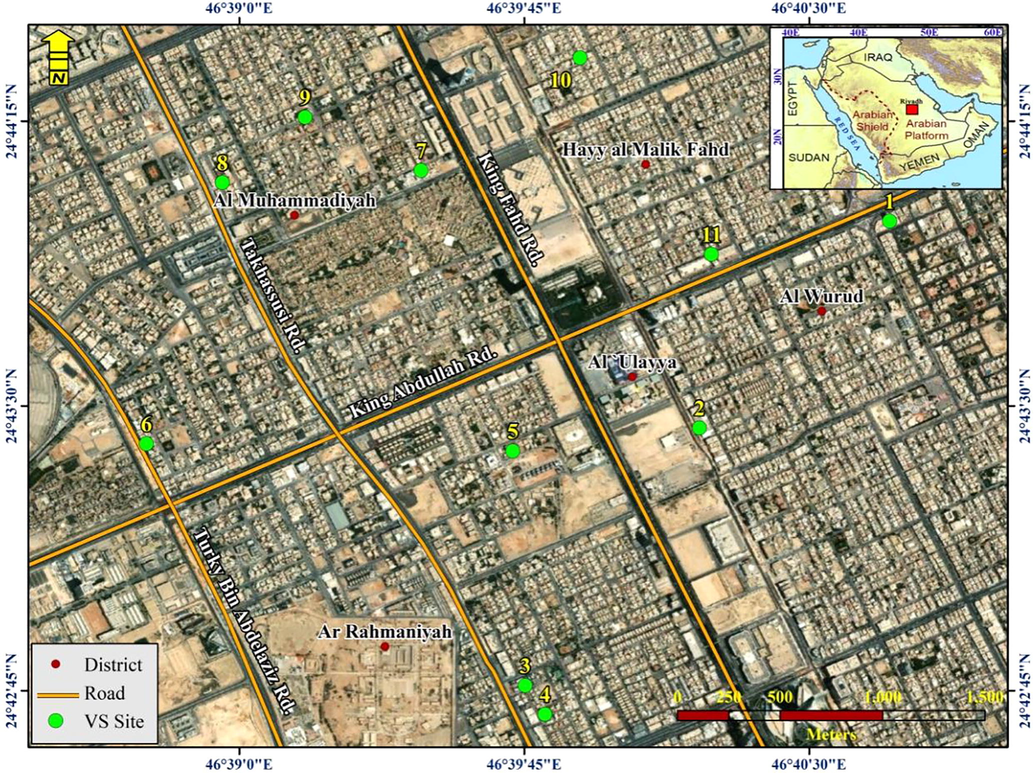
Map of the study area in Riyadh City, showing microtremor measurement sites and geotechnical boreholes.
The integration between microtremor measurements and soil geotechnical parameters have been conducted at several sites worldwide (Anbazhagan and Sitharam, 2008; Anbazhagan et al., 2011; Fnais et al., 2010; Alharbi et al., 2015; Almalki et al., 2011; Al-Malki et al., 2015; Alyousef et al., 2015a,b; Rezaei and Choobbasti, 2017; Abdelrahman et al., 2019; Koesuma et al., 2019; Alamri et al., 2020; Almadani et al., 2020; Mogren et al., 2020; Abdelrahman et al., 2021a,b; Almadani et al., 2021; Qaysi et al., 2021; Salsabili et al., 2021).
2 Geologic setting of the investigating area
Due to intense tectonic activity during the Neoproterozoic epoch (Gondwana split), when igneous and metamorphic rocks were produced and evolved in the Arabian Shield, Saudi Arabia has particularly unique geology, consisting mostly of two geological zones: Arabian Shield and Arabian shelf (Johnson et al., 2008). In addition, the Cretaceous epoch had a significant impact on the lithology and structural evolution of the area, particularly on the Arabian shelf, where sedimentary rocks and basins were present. Furthermore, these tectonic events have resulted in the formation of a complex geologic structure in both zones (i.e., Najd fault system, Majma'ah fault system).
The city of Riyadh is located in central Saudi Arabia and is made up primarily of carbonates, sandstone, shale, alluvium, and sheeted gravel (Fig. 2). The examination site is located in the upper Jurassic Arab and Jubaila Formations and is characterized by creamy and extensively worn limestone, as well as a sedimentologic sequence that evolves in a subtidal to intertidal carbonates environment with sabkha topped by evaporites (Cantrell and Hagerty, 1999). From the ground surface to the highest depths examined, the subsurface geologic setting at the site is divided into three layers:
-
–
Silty and clayey sand: A light brown, medium to very dense, dry to damp silty sand layer on top. This layer is around 5.5 m thick on average.
-
–
Completely weathered limestone: Below the creamy top layer, with silty sand filling fissures and vugs, extremely to moderately weathered, and very heavily slightly fractured. This layer's thickness ranges from 2.5 to 13.5 m.
-
–
Slightly fractured limestone: Dry to wet and creamy limestone that lies beneath the top layer of very dense sand.
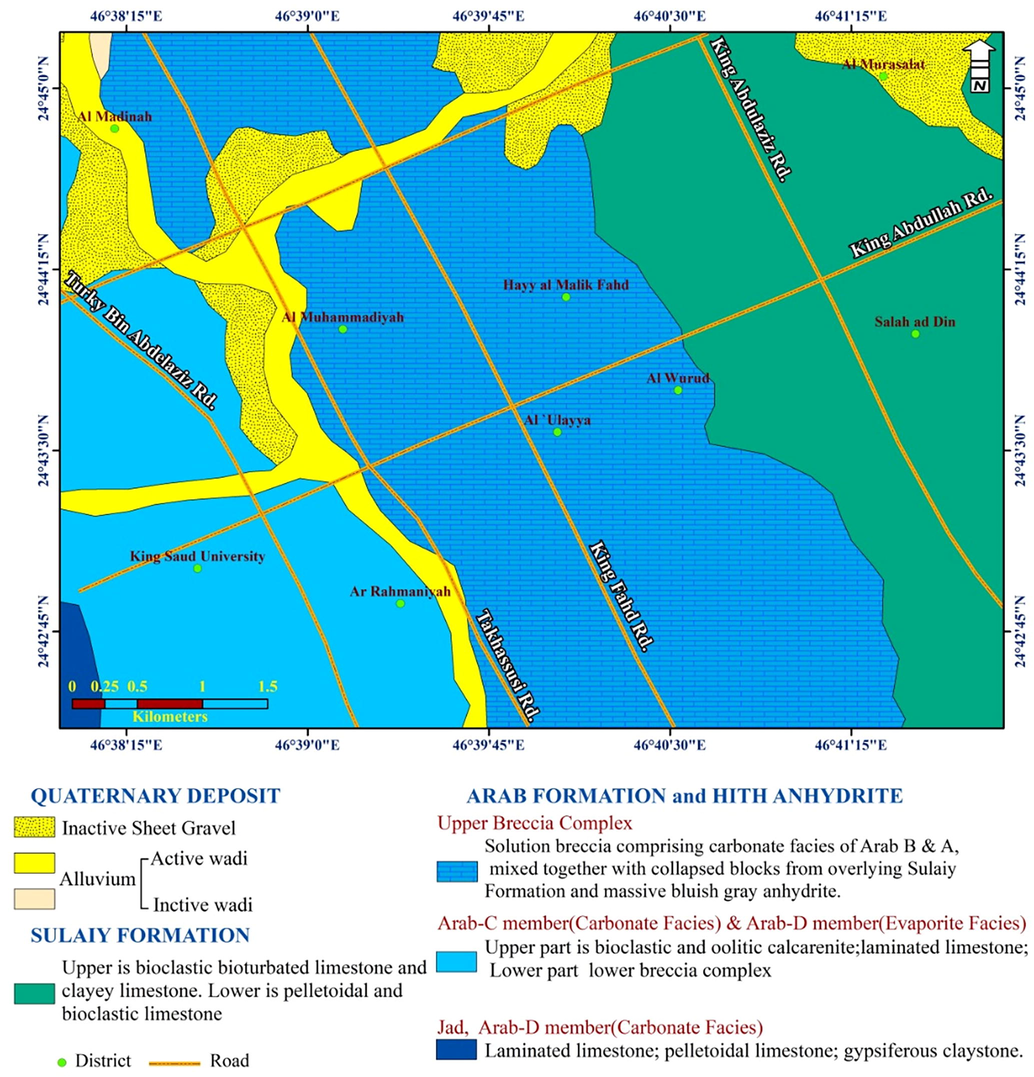
- The geologic setting of the study area.
3 Data acquisition
3.1 Microtremor data acquisition
A digital seismograph model Taurus with a high-sensitivity 3-components seismometer Trillium small 120 s was used to take 45 microtremor readings (Fig. 1) (Nanometrics Inc, Canada). The majority of the data was collected after midnight to improve data quality and eliminate any noise that could impair the ambient recordings. For each point, continuous microtremor measurements were taken for an average of 1 h. The length of the recording is a crucial factor. Nakamura (1996), Mucciarelli (1998) proposed that recording time to obtain a reasonable and accurate average spectral ratio. Microtremor data was collected using a band-pass filter with a frequency range of 0.2–20 Hz and a sampling rate of 100 samples per second. The results of microtremor measurements, including fundamental resonance frequency and amplitude reflect the site geotechnical suitability for installing the overlying residential buildings where the presence of cavities, sinkholes, subsurface heterogeneities will appear in several peaks in the H/V curves.
The purpose of increasing the frequency range to 20 Hz is to dig deeper into the site, where several horizontal to vertical spectral ratio peaks can reveal deeper layers. As a result, we can delve deeper into subsurface geology. In waterproof and thermally isolated boxes, the sensors are effectively protected from harsh weather and temperature variations.
3.2 Location of boreholes
Microtremor readings must be correlated and integrated with geotechnical borehole data in order to assess and conduct reliable outcomes. As a result, it has partnered with one of Riyadh's most well-known geotechnical firms (Soil & Foundation limited company). They gave the most recent data from boreholes conducted at our investigation site. The overall number of boreholes employed in this study is 11 covering our study region.
Shear-wave velocity, which indicates the stiffness of the sediment as an effective factor in the amplitude and ground motion, is one of the most critical factors that can be determined from geotechnical borehole data (Boore et al., 1993; Anderson et al., 1996). Furthermore, physical attributes derived from borehole data (e.g., Standard Penetration Test, Rock Quality Designation) are used in site response estimation, which is the goal of this work. Furthermore, the more information we have, the better results we can achieve. The number of layers, as well as their physical and chemical characteristics, are recorded in the test boring log whether the geological composition is loose sediment or hard rock. It also shows the groundwater level ranges between 3.8 m and 8.9 m below the ground surface.
4 Data processing
4.1 Microtremor measurements
GEOPSY-software, developed by the SESAME European project (https://www.geopsy.org/), has been employed in microtremor measurement processing. The processing sequence and approach used to properly handle the data will determine the quality of the final results. After the amplitude spectra were Fourier amplitude transformed, the H/V spectral ratio was computed, and the amplitude spectra were smoothed using Konno and Ohmachi (1998) technique. The ambient noise data was then calculated using > 10 windows, with any data point that did not satisfy this number of windows being ignored.
At each observation point's fundamental resonance frequency (fo) and amplification factor (Ao) have been computed (examples are illustrated in Fig. 3). Three more tests, including the damping value, horizontal spectrum rotate, and H/V rotate, were also conducted to assess whether these peaks were created naturally or artificially following SESAME project (2004) recommendations.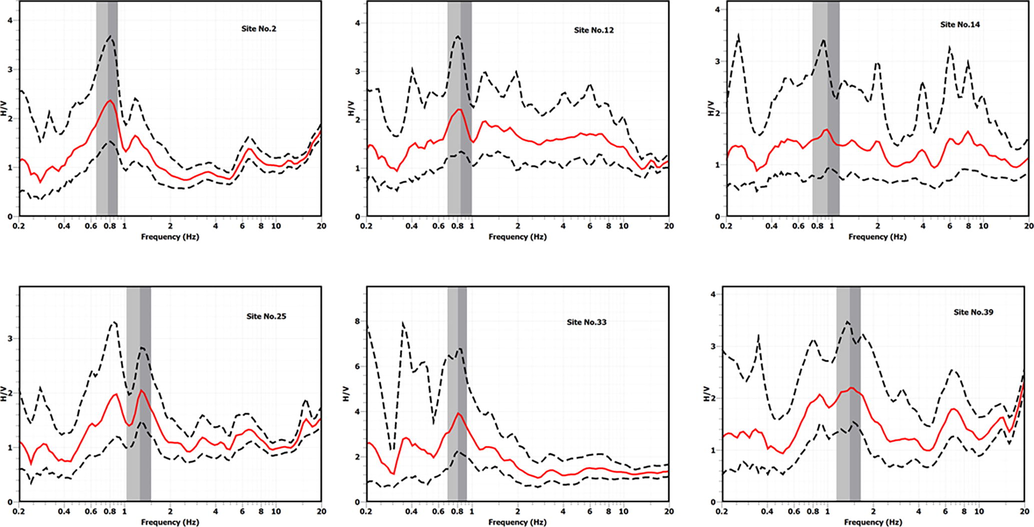
Examples of Microtremor data analysis.
4.2 Borehole geotechnical data
Average Shear-wave velocity and standard penetration resistance are crucial and fundamental factors in seismic microzonation to characterize the site effect. The following equations can be used to calculate these characteristics from the Standard Penetration Test (SPT):
In this study, 11 boreholes were dug through the investigated area, extending to a depth of 30 m below ground level. At several borehole locations, the standard penetration test (SPT) values revealed that the general soil profile has a varying thickness of soil overburden that spans between 4.5 m and 30 m from the ground surface. The subsoil profiles have been divided into zones for each of Riyadh's districts.
N values obtained in the field using the SPT technique (N60) have been corrected for various parameters (Seed et al., 1983; Skempton 1986; Sitharam et al., 2005; Anbazhagan et al., 2007) as overburden pressure (CN), hammer energy (CE), borehole diameter (CB), presence/absence of liner (CS), rod length (CR), and fines content (Cfines) using Eq. (3);
This relationship has been applied to calculate the Shear-wave velocity for each layer, Vsi, based on equation (4) (Bellana, 2009);
5 Results and interpretation
The H/V spectral ratios for selected windows were determined at 45 of the studied stations. Within the research region, the peak frequency f (Peak) runs from 0.38 to 10.05 Hz Fig. 4. This great variation represents the change in the depth of bedrock where the lower frequencies reflect the deep depths of bedrock while the higher frequencies illustrate the shallow depths of bedrock. The lower frequency values are spread in the northeastern and western parts of the study area, while the higher values cover the southern and central parts of the region. Moreover, the amplification factor runs from 1.22 to 8.5 (Fig. 5). This figure shows the variance of the amplification factor (H/V amplitude). The distribution of the lower amplification factor covers the majority of the study area while higher amplification occupies a small area, indicating greater thicknesses of alluvium sediments or severely weathered limestone rocks.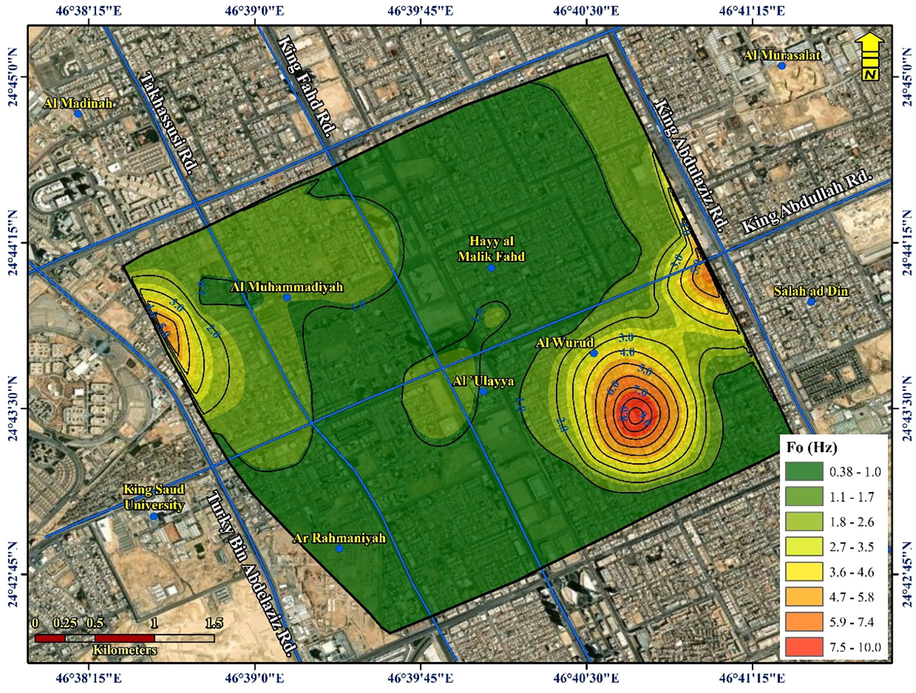
Map of fundamental frequency distribution across the study area.
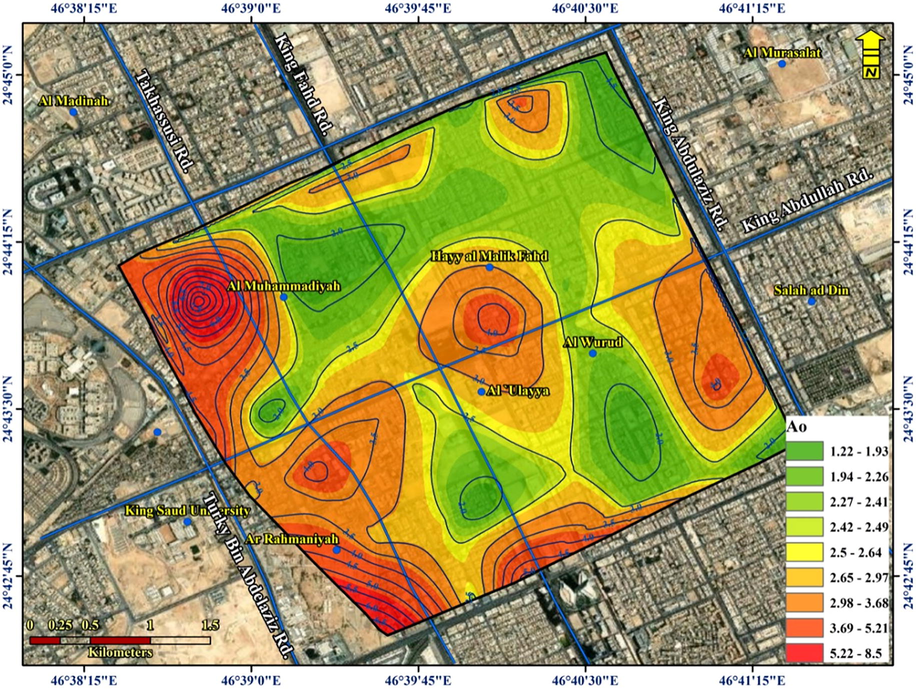
Map of amplification factor distribution across the investigated area.
The analysis of 11-boreholes that have been drilled through the Riyadh area extending to 30 m depth below the ground surface. Based on the values of the standard penetration test (SPT), it is indicated that the general soil profile has a variable thickness of soil overburden as indicated by Figs. 6 and 7. These figures clarify the variation of SPT (N values) and depth till 4.5 m indicating the heterogeneities of soil properties. Moreover, the values of shear wave velocity on 30 m ranged from 210 to 630 m/sec (Fig. 8). Moreover, site soil classification has been calculated based on the NEHRP (National Earthquake Hazards Reduction Program) and the NEHRP site classification map was generated. It is revealed that there are only two soil classes (class C and D) in the study area (Table 1). The D site class is represented by the silty clayey sand of the topmost layer while the c class is composed of limestone having cracks and vugs filled by silty sand, highly to moderately weathered, and very high to slightly fractured. This map reveals that values of less than 360 m/s cover the central zone of the study area while the values greater than 360 m/s occupies the western, southeastern, and northern parts. Note: N: SPT blow count, Su: Undrained shear strength, PI: Plasticity Index, w: Water content.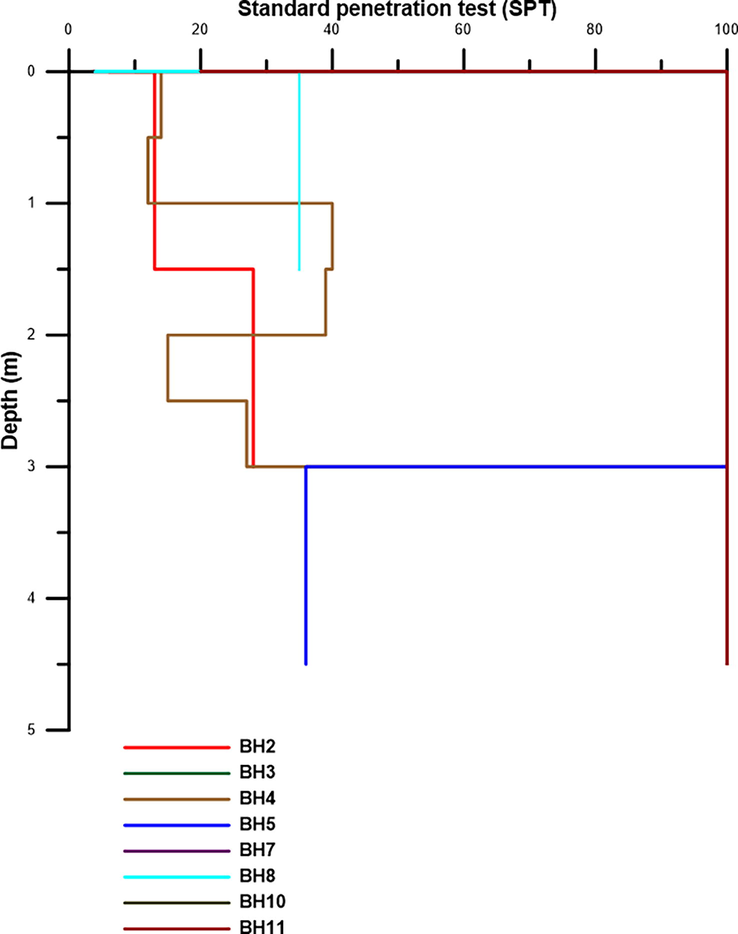
The relationship between SPT (N values) and depth.
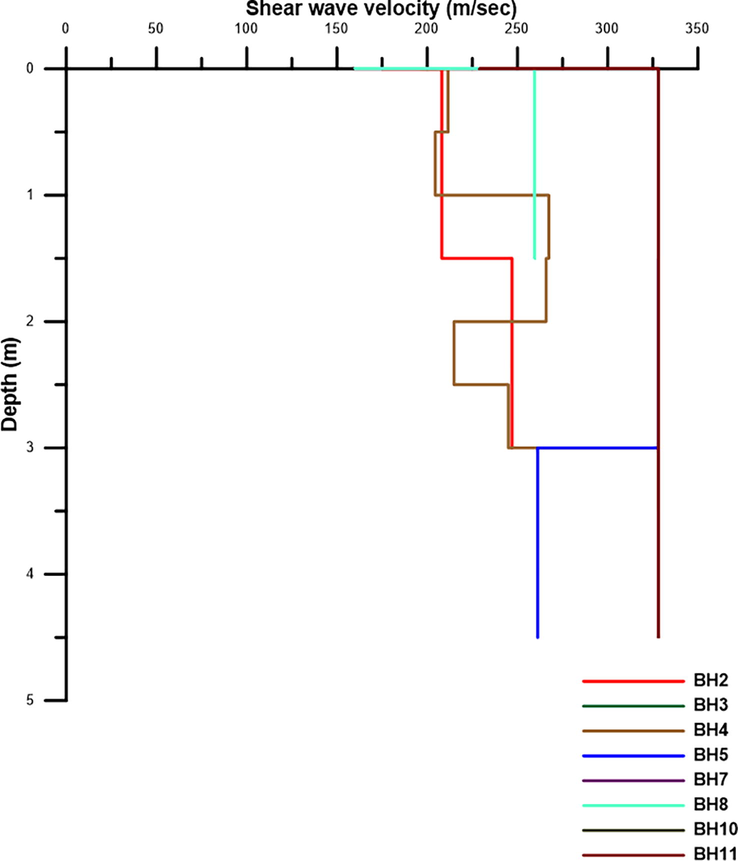
The relationship between Vs30 and depth.
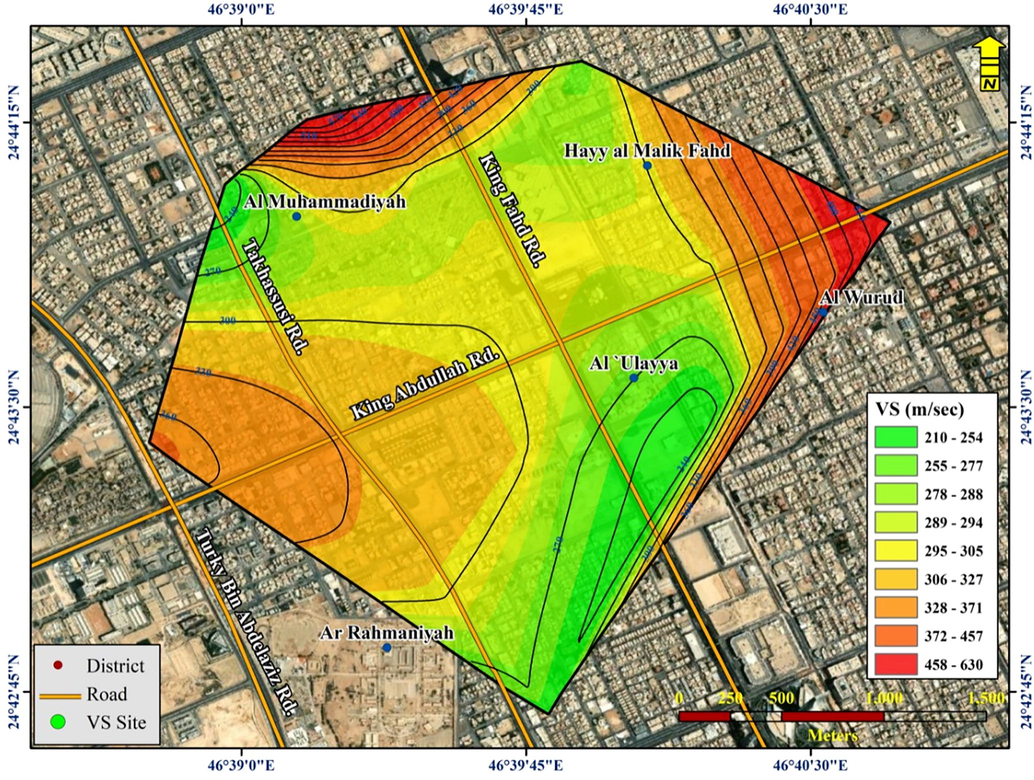
Map of the average Vs30 distribution across the study area.
Soil type
General description
Vs (m/s)
A
Hard rock
Vs > 1500
B
Rock
760 < Vs ≤ 1500
C
Hard and/or stiff/very stiff soils; most gravels
360 < Vs ≤ 760
D
Sand silts and/or stiff/very stiff clays, some gravels. Having average blow counts of 15 ≤ N < 50 or average shear strength of 50 kPa ≤ S ≤ 100 kPa
180 < Vs≤360
E
Having thickness lower than 3 m and P > 20, w ≥ 40% and Su < 25 kPa soft clay
Vs < 180
F
Needs specific calculations
6 Conclusions
The site response effect and site soil properties for northern Riyadh were investigated in this study. There is a wide range of resonance frequencies between 0.79 and 45 Hz, with amplification factors ranging from 1.22 to 8.5. The sharp peaks represent the impedance contrast between the uppermost surface soil and the underlying hard-rock (SESAME Project, 2004). Large impedance contrasts are reflected in the second peaks (SESAME Project, 2004). Other locations have large peak curves, which may be due to the presence of a sloping subsurface interface between softer and harder strata. Overall, according to the recorded shear wave velocity, NEHRP, and IBC, the area of interest belongs to two site soil classes C and D. The findings of this study should be considered as part of the development of the Saudi Building Code for Riyadh City.
Acknowledgments
This research was supported by Researchers Supporting Project number (RSP-2022/351), King Saud University, Riyadh, Saudi Arabia.
Declaration of Competing Interest
The authors declare that they have no known competing financial interests or personal relationships that could have appeared to influence the work reported in this paper.
References
- Fundamental site frequency estimation at New Domiat city, Egypt. Arabian J. Geosci.. 2012;5(4):653-661.
- [Google Scholar]
- Ground motion acceleration and response spectra of Al-Mashair area, Makkah Al-Mukarramah, Saudi Arabia. Arabian J. Geosci.. 2019;12(11)
- [Google Scholar]
- Site effect and microzonation of the Jizan coastal area, southwestern Saudi Arabia, for earthquake hazard assessment based on the geotechnical borehole data. Arabian J. Geosci.. 2021;14:688.
- [CrossRef] [Google Scholar]
- Evaluation of kinetic moduli and soil competence scale of soil profiles in Jizan area, southwestern Saudi Arabia. Arabian J. Geosci.. 2021;14(3)
- [CrossRef] [Google Scholar]
- Soil site characterization of Rabigh city, western Saudi Arabia coastal plain, using HVSR and HVSR inversion techniques. Arabian J. Geosci.. 2020;13(1)
- [Google Scholar]
- Site response assessment at the city of Al Khobar, eastern Saudi Arabia, from microtremor and borehole data. Arabian J. Geosci.. 2015;8(11):10015-10030.
- [CrossRef] [Google Scholar]
- Site response assessment and ground conditions at King Saud University Campus, Riyadh City, Saudi Arabia. Arabian J. Geosci.. 2020;13:1-14.
- [Google Scholar]
- Integrated geoinvestigation for evaluation of an engineering site—a case study from the western Riyadh city, central Saudi Arabia. Arabian J. Geosci.. 2021;14(5)
- [Google Scholar]
- Estimation of near-surface geotechnical parameters using seismic measurements at the proposed KACST expansion site, Riyadh, KSA. Arabian J. Geosci.. 2011;4(7-8):1131-1150.
- [Google Scholar]
- Estimation of fundamental frequency in Dammam city, eastern Saudi Arabia. Arabian J. Geosci.. 2015;8(4):2283-2298.
- [Google Scholar]
- Site effect evaluation for Yanbu City urban expansion zones, western Saudi Arabia, using microtremor analysis. Arabian J. Geosci.. 2015;8(3):1717-1729.
- [Google Scholar]
- Amplification based on shear wave velocity for seismic zonation: comparison of empirical relations and site response results for shallow engineering bedrock sites. Geomech. Eng.. 2011;3(3):189-206.
- [Google Scholar]
- Anbazhagan, P. and Sitharam, T.G. (2008). Site Characterization and Site Response Studies Using Shear Wave Velocity. JSEE: Summer 2008, Vol. 10, No. 2, 53-67p.
- Control of strong motion by the upper 30 meters. Bull. Seism. Soc. Am.. 1996;86:1749-1759.
- [Google Scholar]
- Bellana, N. (2009). Shear Wave Velocity as Function of SPT Penetration Resistance and Vertical Effective Stress at California Bridge Sites. A thesis submitted in partial satisfaction of the requirements for the degree Master of Science in Civil and Environmental Engineering. University of California Los Angeles. 79P.
- Boore, D. M., Joyner, W. B., Fumal, T. E. (1993). Estimation of response spectra and peak accelerations from western North American earthquakes: an interim report.
- Estimates of site-dependent spectra for design – Methodology, and justification. Earthq. Spectra. 1994;10(4):617-653.
- [Google Scholar]
- National Earthquake Hazard Reduction Program (NEHRP): Recommended Provisions for Seismic Regulations for New Buildings and Other Structures. Washington DC: BSSC; 2004.
- Microporosity in Arab formation carbonates. Saudi Arabia. GeoArabia. 1999;4(2):129-154.
- [Google Scholar]
- Microtremor measurements in Yanbu city of Western Saudi Arabia: A tool for seismic microzonation. J. King Saud Univ.-Sci.. 2010;22(2):97-110.
- [Google Scholar]
- Determination of shear wave velocity by using microtremor method in the west part of Surakarta city. Int. Conf. Sci. Appl. Sci. (ICSAS). 2019;2019
- [CrossRef] [Google Scholar]
- Ground-motion characteristics are estimated from the spectral ratio between horizontal and vertical components of microtremor. Bull. Seismol. Soc. Am.. 1998;88(1):228-241.
- [Google Scholar]
- Near-surface foundation level assessment from seismic measurements: a case study of north Jeddah City, Saudi Arabia. Arabian J. Geosci.. 2020;13(5)
- [Google Scholar]
- Reliability and applicability of Nakamura's technique using microtremors: an experimental approach. J. Earthq. Eng.. 1998;2(04):625-638.
- [Google Scholar]
- Nakamura, Y. (1996), Real-time information systems for seismic hazards mitigation UrEDAS, HERAS and PIC, Quarterly Report of RTRI, 37(3), 112-127.
- Seismic hazard assessment for the proposed site of electric power plant: Comprehensive approach. J. King Saud Univ. Sci.. 2021;33(3):101360.
- [Google Scholar]
- Application of the microtremor measurements to a site effect study. Earthq. Sci.. 2017;30(3):157-164.
- [Google Scholar]
- Seismic microzonation of a region with complex surficial geology based on different site classification approaches. Geoenviron. Disasters. 2021;8(1)
- [Google Scholar]
- Site-dependent spectra for earthquake-resistant design. Bull. Seismol. Soc. Am.. 1976;66(1):221-224.
- [Google Scholar]
- SESAME project 2004. Guidelines for the implementation of the h/v spectral ratio technique on ambient vibrations measurements, processing and interpretation. WP12 – Deliverable D23.12 European Commission – Research General Directorate Project No. EVG1-CT-2000-00026 SESAME, December 2004.


