

Translate this page into:
Simultaneous determination of four endogenous steroids in bio matrices by LC-MS/MS
⁎Corresponding author at: Department of Pharmaceutical Analysis, Rao’s College of Pharmacy, Nellore, Andhra Pradesh, India. premrpa@gmail.com (Premanand Ranganathan)
-
Received: ,
Accepted: ,
This article was originally published by Elsevier and was migrated to Scientific Scholar after the change of Publisher.
Peer review under responsibility of King Saud University.
Abstract
A simple sensitive and accessible ultra-high performance liquid chromatography coupled with triple quadrupole mass spectrometry using AJS-ESI method is established and validated for the intended purpose of quantification of major cholesterol steroidal metabolites Corticosterone, 11α-Hydroxyprogesterone, Testosterone and Progesterone is extracted by Tertiary butyl methyl ether solvent from human plasma and analyzed using Infinity Lab Poroshell 120 EC-C18, (2.1 × 150 mm, 2.7 µm) column by gradient elution. The Eluent composed of 5 milli molar Ammonium formate in Methanol as eluent A and 5 mM Ammonium formate as eluent B and detection was done by AJS- ESI fitted tandem mass spectrometry in positive mode. The internal standard used is Caffeine. The quantification lower limits (LLOQ) are 0.200 ng per liter for all four steroids Corticosterone, 11α-Hydroxyprogesterone, Testosterone and Progesterone. The Calibration curve are linear over the respectively limits of 0.200 to 1000.000 ng per milliliter of Plasma for each analyte and quadric for Testosterone. This new LC-MS/MS method shows presentable precision & accuracy and provides satisfactory sensitive for the fulfillment of human pharmacokinetic studies.
Keywords
Progesterone
11α-Hydroxyprogesterone
Corticosterone
Testosterone
Method validation and LCMSMS

1 Introduction
Steroids compounds are a unique by which all structural differences is centered on a common conjugated ring system (Fig. 1). It is steroid structure that makes the technical problem of steroid analysis challenging. All steroids share the same characteristic arrangement of four cycloalkane rings and all are derivatives of cholesterol. The chemical diversity of steroids is due to double bonding and various functional groups (Fig. 2). Steroids are one major class of lipids and has multiple numbers of attached functional groups. The non-polar character of steroids is due to the large number of carbon-hydrogens which is same as in all lipids (Moss, 1989). The hormones of the adrenal cortex and sex hormones are in these classes. The three primary sex steroids classes are testosterone, progesterone and estrogens.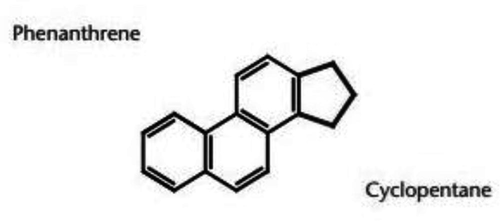
Base structure of steroid molecules.
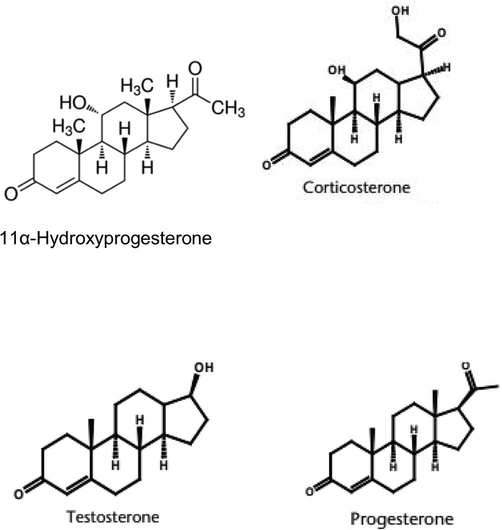
Chemical structures of the analyzed Steroids.
Steroids compounds contain the cyclopenteno phenanthrene ring system in their chemical structure and are derived metabolically from cholesterol. The testosterone is the most significant human derivatives. The naturally occurring human progestagene and most significant one is progesterone Steroid hormones are largely used round the body and are involved in many regulatory pathways including sexual differentiation, metabolic function and immune response.
This extensive activity makes steroids a significant class of therapeutic compounds and drug monitoring is required constantly to reduce many side effects (Peng et al., 2005). A variety of commonly used chemicals in the environment have endocrine disrupting properties and of growing concern. But sex hormones have the most estrogenic potential (Kuster et al., 2004), such systemic effects often require drug monitoring. The analytical determination of steroid hormones as micro pollutants and also the clinical determination in the blood are no easy tasks, due to prime analytes exceptional minimal concentrations and matrices complexity.
The Primary aim of the methodology is to reach the required selectivity and sensitivity for their simultaneous analysis at the concentrations physiologically active (picogram to nano gram per milliliter), with procedures consumes less period of time are required. For numerous Periods, steroidal hormones estimation was performed by biological techniques, like immunoassays and GC–MS (Diaz Cruz et al., 2003; Marten and Naguschewski, 2011). Though, currently, due to growth of Instrumentation techniques in the relevant research area, LC-MS/MS has gained enormous growth. Many methods including liquid chromatography associated with ultra violet spectroscopy detector (LC-UV) (Long, 2012). MS/MS combined with Liquid chromatography (LC-MS/MS) (Allende et al., 2014; Bowers, 1997; Thevis and Schanzer, 2005; Fluri and Rivier, 2001; Steffenrud and Maylin, 1992; Thieme et al., 2000; Madhusudhana Reddy et al., 2009) has been evolved to quantify Steroids in biological fluids. Above reported methods has limitations and are insufficient because of inadequate sensitivity, with high run time of the method, large sample quantity required for sample processing and a huge solvent usage. A simple, sensitive, accessible and efficient LC-MS/MS methodology is of need for establishing methodology development and validation in Plasma, a human biological matrix. This research study objectives were to establish method development and validating a simple, sensitive, fast and accurate methodology of the separation with beneficial run time and Steroids quantification in human Plasma. The present work describes a triple quadrupole mass spectrometry with fast gradient Agilent 1290 Infinity II Ultra High performance liquid chromatography technique for estimating of four steroid hormones in single run in less than 7.0 min.
2 Material and methodology
2.1 Reagents and chemicals
All Certified reference material (CRM) standards Corticosterone, Progesterone, 11α-Hydroxyprogesterone, Testosterone and internal standard caffeine were procured from Cerilliant (NMI Australia), Steraloids (Newport, USA). Methyl tertiary butyl ether (MTBE) from Supelco (India), methanol from JT Baker (Phillipburg, USA), acetonitrile, Isopropyl alcohol and Ammonium formate were purchased from Qualigens (India), formic acid procured from Merck (India). Ultra-pure grade water was obtained from ELGA Laboratory water purification system (Metrohm, India).
2.2 Liquid chromatographic conditions
An Agilent Liquid Chromatography (LC) 1290 Infinity II model was utilized in this methodology. Compounds elution was performed on an Infinity Lab Poroshell 120 EC-C18 part number 693775-902 (2.1 × 150 mm, 2.7 µm) maintained at 30 °C and the Auto sampler temperature maintained at 5°centigrade. The Eluent composition A as 2 milli molar Ammonium formate in Methanol and B as 2 milli molar Ammonium formate with a gradient elution is used as LC mobile phase. The injection capacity was 5 µl; the mobile phase run rate was 400 µl per minute. and total runtime was 7.0 min for the complete analysis.
The gradient program used was:
Time
%B
0.00
90
0.50
90
4.00
05
5.00
05
5.50
90
7.00
90
2.3 Mass spectrometry conditions
The mass spectrometry used in this study is an Agilent LCMSMS model 6490 mass spectrometry with AJS electrospray ionization technology in positive polarity mode with a unit resolution is used for detection. The following parameters were optimal: Sheath Gas Heater 250 °C, Gas Temperature 300 °C, Gas flow 5 L per min, Sheath Gas Flow 11 L per minute, Nebulizer pressure 45 psi, V Charging 500 and Capillary 3500 V. Multiple reactions monitoring (MRM) mode is used for Detection. High pure gas of nitrogen 99.995% was utilised for collision gas. More Instrument conditions are given in Table 1.
Compound Name
Precursor Ion (m/z)
Product Ion (m/z)
Fragmentor (V)
Collision Energy (V)
Corticosterone
347.2
329.2
110
12
Corticosterone
347.2
121.1
110
24
11α hydroxy Progesterone
331.2
109.1
100
27
11α hydroxy Progesterone
331.2
97.1
100
27
Progesterone
315.2
109.1
100
25
Progesterone
315.2
97.1
100
20
Testosterone
289.2
109.1
100
25
Testosterone
289.2
97.1
100
25
Caffeine (ISTD)
195.1
138
125
20
Caffeine (ISTD)
195.1
110.1
125
24
2.4 Procedure of standard and sample solution preparation
All four steroid standards stock solutions 1 mg per milliliter (w/v) and the Internal Standard (IS) 1 mg per milliliter (w/v) were individually made up in 10 mL class A certified volumetric flasks for Standards and 5 mL class A certified volumetric flasks for Internal Standard using 100 percent methanol. Calibration and controls working solutions were made from the 1 mg per milliliter (w/v) stock solution and diluent prepared by required further dilution using Water: Acetonitrile (40:60 v/v). The IS 25.000 ng per milliliter solution was made by diluting the 1 mg per milliliter (w/v) stock solution with diluent to achieve required concentrations. Drug free human Plasma 980 µl was taken and 20 µl of working solutions were added to achieve all four steroids standard concentration levels of 0.200, 0.400, 1.000, 2.500, 7.500, 15.000, 30.000, 75.000, 150.000, 300.000, 600.000, 800.000 and 1000.000 ng per milliliter. Quality controls (QC) were made as a volume based on a separate weighing for 4 levels of QC samples. For quantification lower limits (LLOQ) 0.200 ng per milliliter standard drug concentrations, for quality control low (LQC) 0.500 ng per milliliter, for quality control Middle 2 (M2QC) 30.000 ng per milliliter, for quality control Middle (MQC) 300.000 ng per milliliter and for quality control high (HQC) 797.000 ng per milliliter as a individual batch for respective level of concentration. These spiked samples were aliquoted in Tarson tubes of 250.00 µl (µL) and placed in the ultra-deep freezer at below −70°Centigrade til the entire study completes.
2.5 Methodology for sample preparation
The extraction technique involved in sample preparation is liquid–liquid (LLE), Tertiary butyl methyl ether is used as extraction solvent. Human plasma stability samples spiked of Corticosterone, 11α-Hydroxyprogesterone Testosterone and Progesterone were brought out from the -860 Ultra freezer stored at −70°Centigrade and defrosted at ambient temperature. After the stability spiked samples were thawed vortex mixed sufficiently and centrifuged before pipetting. 250.00 of freshly prepared stability spiked samples were aliquoted. 50.00 µL of internal standard at 30.000 ng per milliliter concentration were spiked in calibration standards and quality Controls into RIA vials pre labeled excluding blank and vortexed for 30 s on vortexer. 2.5 ml of tertiary butyl methyl ether was added to respective RIA vial and mixed in platform shaker for 5 min at 2000 rotation per minute. After this samples were centrifuged at 4000 rotation per minute for 10 min at 40 °C. Measured quantity 1.800 mL of supernatant layer was transferred by using a micropipette, the separated supernatant layer then kept in low volume nitrogen evaporator at 40°Centigrade for evaporation up to complete dryness, 300 µl of Eluent was used for reconstitution and mixed for 60 s in a vortexer and then transferred to a injection vials and loaded in the auto sampler for LCMSMS study.
2.6 Method validation parameters
2.6.1 System suitability
To establish the Instrument performance, system suitability parameters were studied by six replicate samples containing steroids standard mix MQC level were analyzed. Factors such as percentage RSD of analyte area ratio, retention time and tailing factor were considered for system suitability verification.
2.6.2 Selectivity
Selectivity is to verify the ability to evaluate explicitly of the analyte in the presence of other analytes, metabolites or contaminants which may be present in the same RT of components, the specificity was established by chromatographic data’s obtained from 8 individual blank plasma lots lipeamic and heamolysed each one spiked at LLOQ and ULOQ levels.
2.6.3 Method limit of detection and quantitation
The method limit of detection (LOD) and limit of quantitation (LOQ) of the bio analytical method was estimated by using the response and the slope method’s standard deviation. The LOQ is interpreted as the least Conc. which could be quantified with an coefficient of variation of less than 20 percentage and accuracy between 80 and 120 percentage for the interday and the LOD could be accurately characterized from background noises.
2.6.4 Linearity
Calibration standard solutions analyte area of the quantifier of each individual analyte of interest against concentrations was plotted to build matrix matched calibration curves. Concentration range of Corticosterone, Testosterone, Progesterone and 11α-Hydroxyprogesterone was found to be precise and accurate from 0.200 to 1000.000 ng per milliliter correspondingly. CV was >0.99 for Corticosterone, Testosterone, Progesterone and 11α-Hydroxyprogesterone.
2.6.5 Precision and accuracy
Interday evaluation of precision and accuracy was estimated after the duplicates in 3 distinct batch runs. Intraday assay precision and accuracy (P&A) of Corticosterone, Testosterone, Progesterone and 11α-Hydroxyprogesterone were calculated at 5 Quality control, quantification levels lower limit (LLOQ) (0.200 ng per milliliter), quality control low (LQC) (0.500 ng per milliliter), quality control Middle 2 (M2QC) (30.000 ng per milliliter), quality control Middle (MQC) (300.000 ng per milliliter) and quality control high (HQC) (797.000 ng per milliliter) range for the 6 injection for each level of the same analytical batch run.
2.6.6 Recovery
The extraction efficacy of Corticosterone, Testosterone, Progesterone and 11α-Hydroxyprogesterone was calculated at the 3 QC samples concentrations containing 0.500, 300.000, 797.000 ng per milliliter for Corticosterone, Testosterone, Progesterone and 11α-Hydroxyprogesterone by the analyte peak area comparison from the extracted spiked standard with an un extracted standard. Internal Standard recovery was determined at 25.000 ng per milliliter concentration by matching 6 unspiked and spiked plasma samples at same level of concentration.
2.6.7 Matrix effect
Matrix effects evaluation were carried out for 8 individual lots of blank K3EDTA plasma including lipeamic and heamolysed one at each level. The duplicate samples were prepared and final reconstitution made with high quality control and low quality control samples. To define the following parameter of analyte and Internal Standard (IS) un-extracted i.e. aqueous samples and extracted were then compared. Internal standard standardized source factor for each lot is defined. The respective results of all high quality control and low quality control samples must be within the level 0.85–1.15 of their nominal concentration. At least sixty seven percentages of quality control samples must be within the given acceptance level at each Quality Control levels of Low and High.
2.6.8 Dilution integrity
To verify the dilution reliability the matrix was spiked above the upper limit of quantitation with an analyte concentration and further dilution of the sample were made with blank matrix. The limits for precision and accuracy should be within ±15 percentage. The objective of studying dilution integrity was to cover the entire range of dilution factor utilized to the real time samples.
2.6.9 Stability
Detailed experimentation were executed to verify the firmness of Corticosterone, Testosterone, Progesterone and 11α-Hydroxyprogesterone in Plasma samples and in stock solution under various expected influenced conditions, reproducing the environment happens during the study performance. The following stability parameters were established such as Process, Auto injector, Room temperature, freeze thaw, dry extract, long term of samples and solution were executed.
3 Results and discussion
3.1 Method optimization
The trustworthy of the methodology was verified by the following parameters selectivity, sensitivity, carry over test, linearity, precision and accuracy and recovery of the methodology (Snyder et al., 1997). Based on the outcome derived for the above mentioned descriptions, the eluent constituents with different combination and with different ratios, pH and different flow rate were choosed for validation. Out of all trials and combinations, the outcome of results recommended the Eluent composition A as 2 milli molar Ammonium formate in Methanol and B as 2 milli molar Ammonium formate with a gradient elution is used as LC mobile phase, pH 4.7 and Flow rate 0.400 ml per minute which ensures in a retention time of 4.679 mins for Corticosterone, 4.967 mins for Testosterone, 5.255 mins for Progesterone, 4.760 mins for 11α-Hydroxyprogesterone and 3.101 mins for the IS.
3.2 Method validation
The optimised methodology was confirmed with validation with adhering to Food and Drug Administration (Guidance for Industry Bioanalytical Method Validation, 2001, 2013; Bievre, 2004; Burhenne, 2012; Sonawane et al., 2014; Whitmire et al., 2011) in terms of mentioned parameters.
3.2.1 Selectivity
The Selectivity was studied by blank sample without internal standard (IS) and analyte, IS at 30.000 Nano gram per milliliter concentration without analyte and samples of analyte at quantitation lower limit and quantitation upper limit after extraction. The area noticed at the RT of Corticosterone, Testosterone, Progesterone and 11α-Hydroxyprogesterone was established to be <20percentage of the quantitation lower limit area (0.200 Nano gram per milliliter). It was established that analyte is not intruding with internal standard and same for IS and analyte. Illustrative chromatograms presented in Fig. 3 (3A and 3B). Detection lower limit was 0.0500 ng per milliliter for corticosterone, testosterone, 0.0600 ng per milliliter for progesterone and 11α-Hydroxyprogesterone.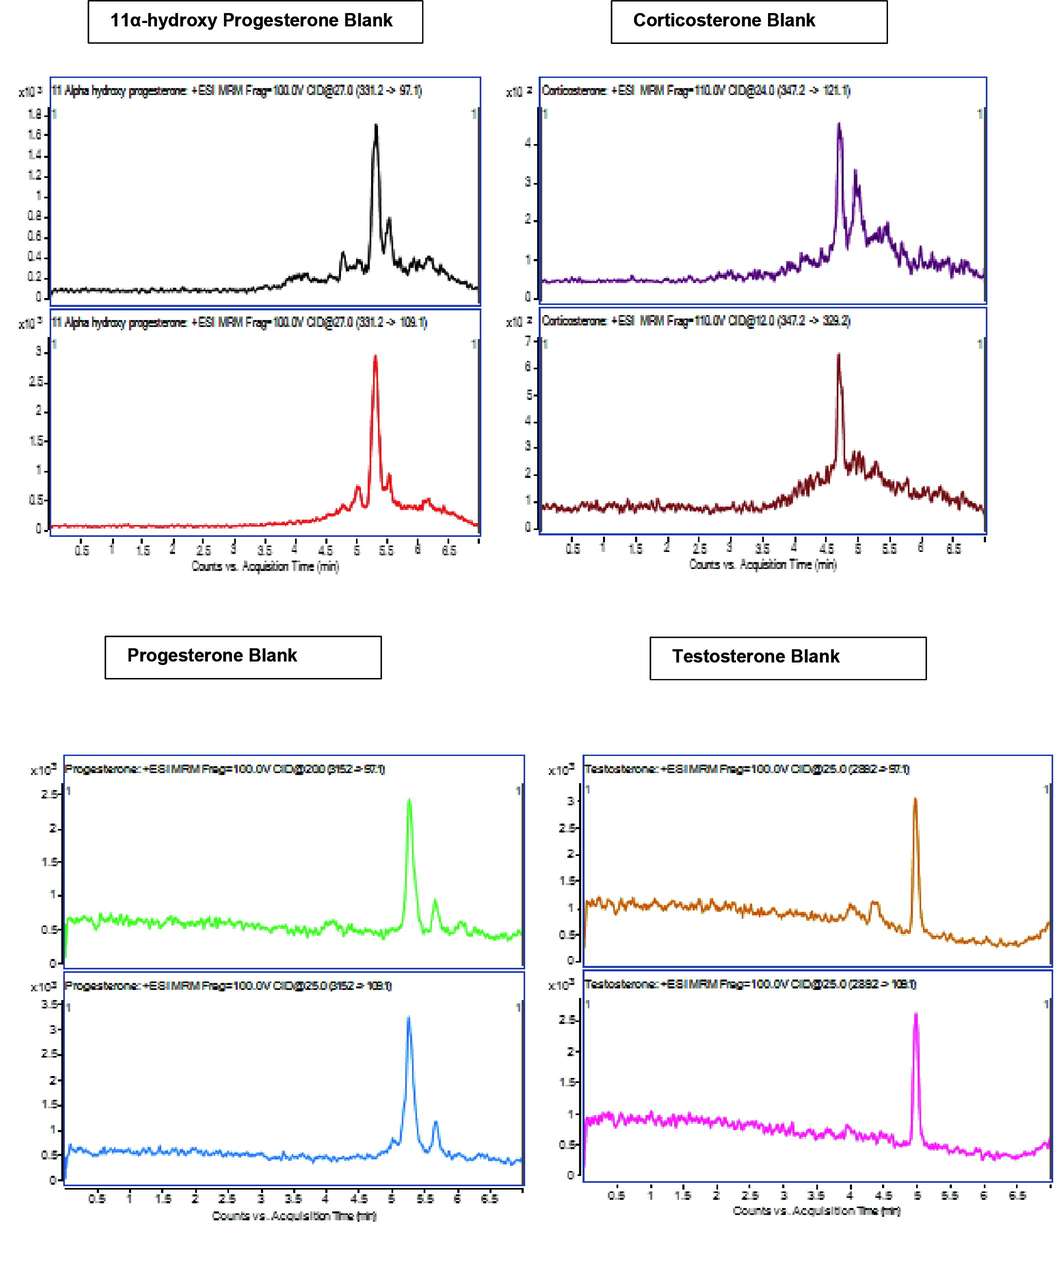
Blank chromatograms (3A) and LLOQ level (3B).
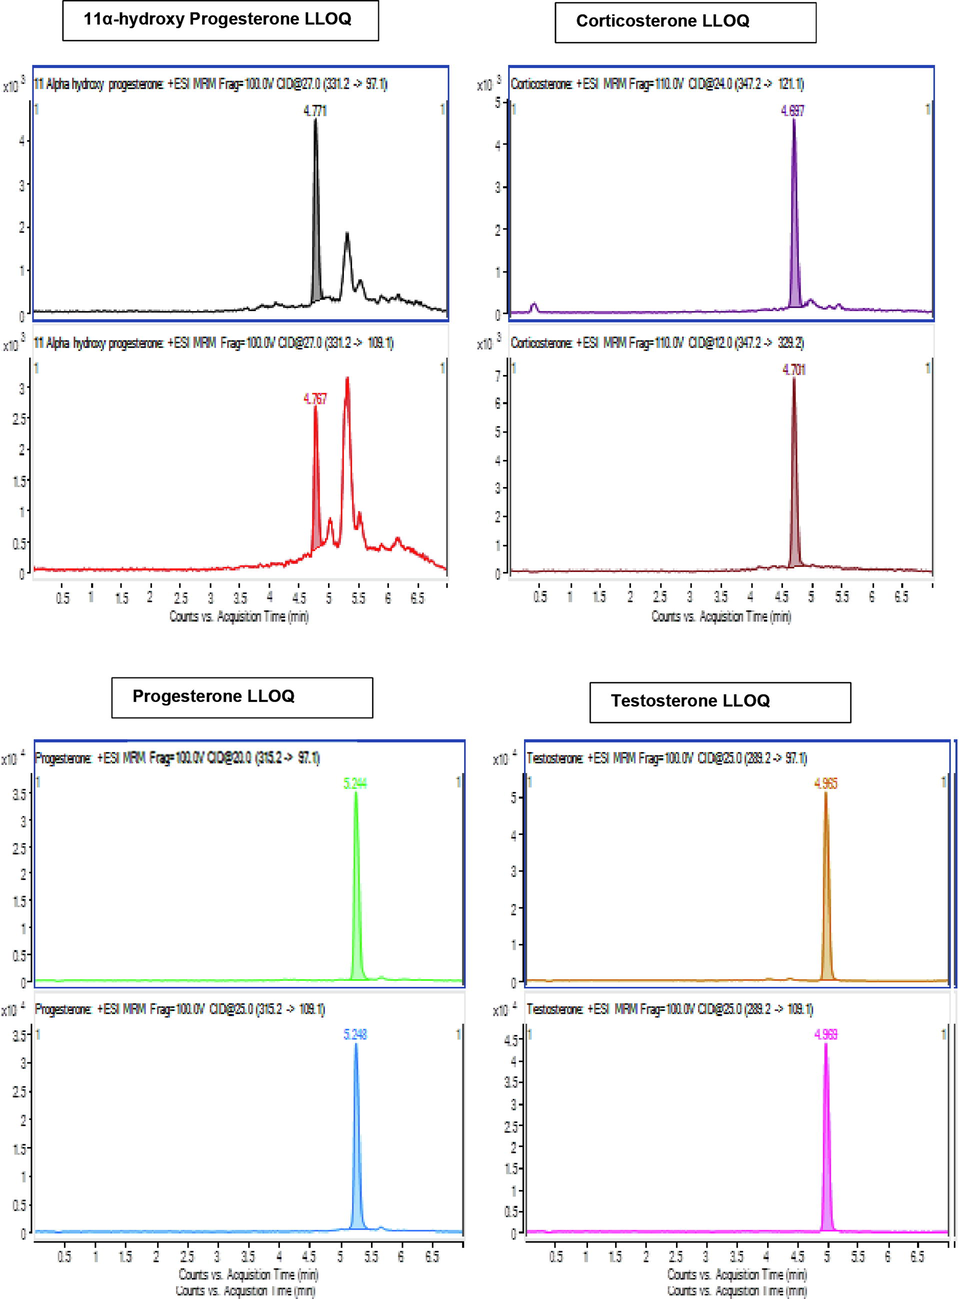
Blank chromatograms (3A) and LLOQ level (3B).
3.2.2 Linearity
The Linearity for testosterone was a quadratic (1/x2) and for corticosterone, progesterone and 11α-hydroxyprogesterone was a linear regression (1/x2). The coefficient of determination (r2) for validation and was >0.99 which was within the given criteria and this gave the best curve fit. The significance average for r2 was found to be 0.992 for Corticosterone, 0.997 for Progesterone, 0.993 for 11α-Hydroxyprogesterone and 0.990 for Testosterone.
3.2.3 Precision and accuracy
The Intra batch Relative standard deviation obtained was from 0.58 to 14.70% and % accuracy were from 85.85 to 108.86% for Corticosterone, Testosterone, Progesterone and 11α-Hydroxyprogesterone. The Inter batch CV obtained was from 1.39 to 15.36% and percentage accuracy observed were from 87.25 to 107.61% for Corticosterone, Testosterone, Progesterone and 11α-Hydroxyprogesterone respectively. The Intraday and Interday results are within ±20% and for lower limit of quantitation and for other levels the results are within ±15%. The results are given in Table 2. a Quality control. b Standard deviation. c Coefficient of variation.
Steroid
QCa 0.200 ng/mL
QCa 0.500 ng/mL
QCa 30 0.000 ng/mL
QCa 300.000 ng/mL
QCa 797.000 ng/mL
Mean ng/mL ± SDb
CVc
Accuracy
Mean ng/mL ± SDb
CVc
Accuracy
Mean ng/mL
CVc
Accuracy
Mean ng/mL ± SDb
CVc
Accuracy
Mean ng/mL ± SDb
CVc
Accuracy
Cortico sterone Intraday
0.204 ± 0.0210
10.53
101.88
0.456 ± 0.0120
2.61
91.21
29.182 ± 0.6920
2.37
97.27
278.739 ± 2.6230
0.94
92.91
705.965 ± 13.1930
1.87
88.58
Cortico sterone Interday
0.214 ± 0.0193
9.06
106.81
0.479 ± 0.0373
7.79
95.84
28.853 ± 0.5362
1.86
96.18
280.944 ± 5.2738
1.88
93.64
706.225 ± 14.6700
2.08
88.61
Testo sterone Intraday
0.200 ± 0.0294
14.70
99.99
0.4361 ± 0.0091
2.08
87.23
28.2277 ± 0.3557
1.26
94.09
315.713 ± 1.8333
0.58
105.24
713.9446 ± 8.6642
1.21
89.58
Testo sterone Interday
0.215 ± 0.0330
15.36
107.61
0.441 ± 0.0084
1.90
88.10
27.262 ± 0.9066
3.33
90.87
307.311 ± 7.0640
2.30
102.44
719.35 ± 26.7514
3.72
90.26
Proge sterone Intraday
0.191 ± 0.0203
10.61
95.48
0.429 ± 0.0117
2.72
85.85
27.278 ± 0.3130
1.15
90.93
278.581 ± 2.0815
0.75
92.86
787.101 ± 7.4824
0.96
98.13
Proge sterone Interday
0.205 ± 0.0022
10.87
102.62
0.484 ± 0.0630
13.03
96.76
26.654 ± 0.7331
2.75
88.85
273.283 ± 4.6603
1.71
91.09
747.598 ± 25.8302
3.46
93.80
11- Alpha proge sterone Intraday
0.218 ± 0.0081
3.73
108.86
0.482 ± 0.0330
6.84
96.31
27.574 ± 0.7252
2.63
91.91
280.020 ± 2.1124
0.75
93.34
698.114 ± 5.6653
0.81
87.59
11- Alpha proge sterone Interday
0.212 ± 0.0173
8.17
105.78
0.488 ± 0.0431
8.83
97.66
27.519 ± 0.7218
2.62
91.73
284.947 ± 5.6727
1.99
94.98
695.369 ± 9.6988
1.39
87.25
3.2.4 Dilution integrity
To verify dilution integrity the concentrations of the samples were taken as high quality control samples concentration doubled and that was diluted two times and four times with pooled blank Plasma screened before pooling. Six replicates of each dilution of 2 times and 4 times are extracted and injected for analysis. The calibration curve standards were injected followed by extracted samples. Percentage accuracy (PA) for two times dilution of Corticosterone was 89.10% and for four times dilution are 94.30%, PA for 2 times dilution of Testosterone was 95.02% and for 4 times dilution are 98.88%, PA for 2 times dilution of Progesterone was 98.13% and for 4 times dilution are 100.82% and PA for 2 times dilution of 11α-Hydroxyprogesterone was 95.54% and for 4 times dilution are 102.38% correspondingly and inside ± 15percentage of the nominal concentration, the relative standard deviation for 2 times dilution are 1.28% and for 4 times dilution are 3.58% for Corticosterone, the CV for 2 times dilution are 4.06% and for 4 times dilution are 4.69% for Testosterone, the CV for 2 times dilution are 0.96% and for 4 times dilution are 3.01% for Progesterone and the CV for 2 times dilution are 8.38% and for 4 times dilution are 4.58% for 11α-Hydroxyprogesterone corrospondingly. The dilution integrity was found to be within the criteria limit.
3.2.5 Matrix effect
Matrix effect (ME) was studied, ME samples were prepared and studied calibration standards in the identical matrix was used during methodology establishment of validation, using 8 individual lots of Plasma at low quality control and high quality control levels duplicates were prepared as per the methodology.. The resulted matrix factor of all low quality control and high quality control samples was within the acceptable limits of 0.85–1.15 of their nominal concentration of low quality control and high quality control samples. Relatively 67percentage of quality controls must be within the mentioned criteria at separate low quality control and high quality control levels were achieved. The described method demonstrates that there is no effect found by the matrix for K3EDTA human Plasma and outcomes given in Table 3. a Matrix Effect; b Recovery; c Standard deviation.
Steroid
IS normalized Matrix Factor MEa
REb (%)
LQC
HQC
Mean ng/mL
SDc
Mean ng/mL
SDc
Mean ng/mL
SDc
Corticosterone
1.02
0.09
0.99
0.09
84.68
1.23
Testosterone
0.98
0.09
0.97
0.07
82.38
1.61
progesterone
0.94
0.05
0.98
0.05
72.86
8.77
11- Alpha progesterone
1.01
0.06
0.99
0.05
75.21
2.01
ISTD
91.67
2.90
3.2.6 Recovery
Recovery (RE) of Corticosterone, Testosterone, Progesterone and 11α-Hydroxyprogesterone and the IS Caffeine were assessed by analyzing mean peak response of 6 spiked and extracted LQC, MQC and HQC samples to those of 6 properly made equal concentration of aqueous solutions. Total Mean RE calculation of analytes Corticosterone, Testosterone, Progesterone and 11α-Hydroxyprogesterone are 84.68, 82.38, 72.86 and 75.21 Mean recovery values of IS Caffeine was 91.67 for LQC, MQC and HQC levels respectively. This result displays the methodology as very good recovery method of both internal standard and analytes. The results were shown in Table 3.
3.2.7 Stability
The analytes and internal standard stability in K3EDTA human Plasma under various time and temperature environments were studied, as well as standard stock solution steadiness, was studied and details given below. The studies of stability analysis were carried out at LQC and HQC stages of Corticosterone, Testosterone, Progesterone and 11α-Hydroxyprogesterone (0.500 ng per milliliter and 797.000 ng per milliliter) as LQC and HQC values with 6 injections for each parameters involved in this section along with CC STDs. The outcomes are represented in Table 4. a Percentage. b Standard Deviation.
S. No.
Stability Experiments & Duration and Temperature
Corticosterone
Testosterone
Progesterone
11 Alpha Progesterone
Conc. Found (ng/mL)
%a Stability
Conc. Found (ng/mL)
% a Stability
Conc. Found (ng/mL)
% a Stability
Conc. Found (ng/mL)
% a Stability
(Mean ± SDb)
(Mean ± SDb)
(Mean ± SDb)
(Mean ± SDb)
1A
Five freeze thaw cycles-LQC −70 °C
0.480 ± 0.0418
102.99
0.561 ± 0.0196
112.42
0.497 ± 0.0162
100.19
0.497 ± 0.0560
109.47
1B
Five freeze thaw cycles-HQC −70 °C
710.683 ± 31.2377
100.64
758.865 ± 17.3428
102.83
780.849 ± 12.5701
100.23
698.984 ± 21.5627
99.37
2A
Auto sampler Stability-LQC 32 h 20 m at 5 °C
0.518 ± 0.0427
110.96
0.500 ± 0.0187
100.06
0.504 ± 0.0148
101.56
0.468 ± 0.0435
103.15
2B
Auto sampler Stability-HQC 32 h 20 m at 5 °C
715.056 ± 28.7179
101.25
741.723 ± 38.2724
100.51
776.455 ± 14.9902
99.67
739.674 ± 41.1327
105.16
3A
Bench top Stability-LQC 10 h 48 m at 20 °C
0.524 ± 0.0489
112.37
0.536 ± 0.0393
107.31
0.508 ± 0.0136
102.52
0.521 ± 0.0327
114.65
3B
Bench top Stability-HQC 10 h 48 m at 20 °C
723.139 ± 30.2623
102.40
784.137 ± 21.8350
106.26
789.751 ± 18.5818
101.38
723.139 ± 30.2623
102.81
4A
Dry extract Stability-LQC 28 h at 30 °C
0.496 ± 0.0405
106.33
0.496 ± 0.0405
99.32
0.494 ± 0.0154
99.61
0.496 ± 0.0405
109.22
4B
Dry extract Stability-HQC 28 h at 30 °C
713.207 ± 36.4855
100.99
713.207 ± 36.4855
96.65
793.899 ± 28.9912
101.91
713.207 ± 36.4855
101.40
5A
Wet extract Stability-LQC 17h24m at 5 °C
0.472 ± 0.0496
104.95
0.492 ± 0.0398
98.62
0.498 ± 0.0171
100.48
0.496 ± 0.0365
109.20
5B
Wet extract Stability-HQC 17h24m at 5 °C
730.349 ± 32.7710
104.08
740.794 ± 32.4299
100.38
768.146 ± 42.5998
98.60
777.460 ± 9.1956
110.53
6A
Intermediate Stability-LQC 03 days 08 h at-20 °C
0.485 ± 0.0515
104.82
0.485 ± 0.0515
97.14
0.500 ± 0.0114
98.23
0.485 ± 0.0515
106.83
6B
Intermediate stability-HQC 03 days 08 h at-20 °C
728.356 ± 27.6750
105.10
753.356 ± 23.1358
102.09
788.059 ± 21.1180
102.32
728.356 ± 27.6750
103.55
The experiment designed for a time window above that was anticipated to be experienced all along the regular sample processing; stored K3EDTA human plasma samples were defrosted and kept at room temperature (7 h and 30mins) For short term stability determination,. These results show respectable stability performance under the test conditions of the routine analysis.
The auto injector stability of QC samples stored for 32 h 20 mins was verified. The results proves that solutions of Corticosterone, Testosterone, Progesterone and 11α-Hydroxyprogesterone were found to be stable for 32 h 20 mins in auto injector with stability percentage 101.25 to 110.96%, 100.06 to 100.51%, 99.67 to 101.56% and 103.15 to 105.16, percentage accuracy 89.72 to 103.50%, 93.06 to 99.93%, 97.42 to 100.73% and 92.81 to 93.67 respectively. Coefficient of variation was 4.02 to 8.24%, 3.74 to 5.16%, 1.93 to 2.93% and 5.56 to 9.28 respectively. Corticosterone for Testosterone, Progesterone and 11α-Hydroxyprogesterone and IS caffeine can wait in the auto injector for relatively 32 h 20 mins, without a variation in the results, demonstrating that samples processed lying in instrument auto injector should be studied within this speculated time.
The Analytes of interest were established to be reliable and stable as dry extracted sample for 28 h 30 mins, established to be stable as wet extracted sample 17 h 24 mins and established to be stable on work bench for 10 h 48 mins. The outcome of the study acknowledges excellent stability in K3EDTA Plasma samples.
Corticosterone, Testosterone, Progesterone and 11α-Hydroxyprogesterone were established to be unchanged and steady in K3EDTA human Plasma stored at −20°Centigrade for three days 08 h and were unchanged over 5 freeze and thaw cycles (FT) at −70 °C, outcomes given in Table 4.
The stock solutions stability was experimented and stable at room temperature for 10 h 10 mins and under refrigeration (2 °C–8 °C) for 04 days 06 h. The results acknowledge excellent constancy for the made standard stock solutions during the period intended for routine analysis.
These results reveals that storage in Plasma samples at below −70 °C for Corticosterone, Testosterone, Progesterone and 11α-Hydroxyprogesterone is satisfactory and substantial without presenting a change in the calculated values, representing that samples stored in ultra-deep freezer should be tested inside this time period, Then there will not be any change in results and stability related issues would be predictable during daily study for bioequivalence studies and pharmacokinetic studies for this intended time period.
4 Conclusion
The liquid chromatography combined with mass spectrometry method explained here is precise, accurate, specific, and in accordance with guidelines of FDA. Recovery, Matrix Effect, good sensitivity and Dilution Integrity were achieved for analyte determination. The study demonstrated method with stability and low sample quantity can simplify the bio study of corticosterone, testosterone, progesterone and 11α-hydroxyprogesterone with inclusion of more study point’s. The analytical qualities of this method make it appropriate for carryout as a routine methodology in the bioequivalence and pharmacokinetic studies in humans allowing the evaluation of corticosterone, testosterone, progesterone and 11α-hydroxyprogesterone events in a one bioanalytical run.
Acknowledgments
The authors pay their gratitude to the Management of Neosciencelabs Pvt. Ltd. Chennai, India for supporting necessary lab facilities to carry out the study. Researchers Supporting Number (RSP-2020/7) King Saud University, Riyadh, Saudi Arabia.
Declaration of Competing Interest
The authors declare that they have no known competing financial interests or personal relationships that could have appeared to influence the work reported in this paper.
References
- LC–MS/MS Method for the Simultaneous Determination of Free Urinary Steroids. Chromatographia.. 2014;77:637-642.
- [CrossRef] [Google Scholar]
- De Bievre, 2004. The fitness for purpose of analytical methods. A laboratory guide to method validation and related topics, EURACHEM guidance document.
- Analytical advances in detection of performance enhancing compounds. Clin. Chem.. 1997;43(7):1299-1304.
- [Google Scholar]
- Diaz Cruz, M.S., Lopez de Alda, M.J., Lopez, R., Barcelo, D., 2003. Determination of estrogens and progestogens by mass spectrometric techniques (GC/MS, LC/MS and LC/MS/MS), J. Mass Spectrom. 38, 917–923.
- Method for conformation of synthetic corticosteroids in doping urine samples by liquid chromatography electrospray ionization mass spectrometry. J. Chromatography A.. 2001;926:87-95.
- [Google Scholar]
- Guidance for Industry Bioanalytical Method Validation, 2001.
- Guidance for Industry Bioanalytical Method Validation, 2013.
- Kuster, M., Lopez, M.J., Barcelo, D., 2004. Estrogens and Progesterons in Wastewater, Sludge, Sediments and Soil, Handbook of Environmental Chemistry, pp. 3.
- Fast screening methods for steroids by hplc with agilent poroshell 120 columns. USA: Agilent Technologies Inc.; 2012.
- Madhusudhana Reddy, I., Alka Beotra, Jain, S., Ahi, S., 2009. A simple and rapid ESI-LC-MS/MS method for simultaneous screening of doping agents in urine samples, Indian J. Pharmacol. 41(2), 80–86.
- Marten, S., Naguschewski, M., 2011. UHPLC-MS method for the quantification of steroid hormones. Application Note, ID VPH0043N, http://www.knauer.net/Germany.
- Identification of steroids in urine and plasma. LCGC Europe; 2005.
- Practical HPLC Method Development. New York: Wiley-Blackwell; 1997.
- Sonawane, L.V., Poul, B.N., Usnale, S.V., Waghmare, P.V., Surwase, L.H., 2014. Bioanalytical Method Validation and Its Pharmaceutical Application- A Review. Pharm. Anal. Acta. 5, 3.
- Thermospray liquid chromatography mass spectrometry of corticosteroids. J. Chromatography.. 1992;577:221-227..
- [Google Scholar]
- Suitability of HPLC/MS-MS for the detection of diuretics: Recent advances in doping analysis (8). Koln: Sport und Buch Strauβ; 2000. p. :47-55.
- Monica Whitmire, Jennifer Ammerman, Patricia de Lisio, Jacqueline Killmer, Devon Kyle, Emily Mainstone, Lynann Porter, Tianyi Zhang, 2011. LC-MS/MS Bioanalysis Method Development, Validation, and Sample Analysis: Points to Consider When Conducting Nonclinical and ClinicalStudies in Accordance with Current Regulatory Guidances. J. Anal. Bioanal. Tech. 4, 1–10.


