

Translate this page into:
Shear-wave velocity profiling of Jizan city, southwestern Saudi Arabia, using controlled-source spectral analysis of surface-wave measurements
⁎Corresponding author. nalotaibic@KSU.EDU.SA (Naif Al-Otaibi)
-
Received: ,
Accepted: ,
This article was originally published by Elsevier and was migrated to Scientific Scholar after the change of Publisher.
Peer review under responsibility of King Saud University.
Abstract
Shear-wave velocity profiles are the main site-specific data for site classification, which are commonly used for the purposes of seismic microzonation and hazard assessment. The controlled-source spectral analysis of surface wave (CSSASW) dispersion measurements have been successfully performed to characterize seismic sites up to 30-m depths. This study utilizes the CSSASW application in Jizan City to obtain shear-wave velocity profiling at 14 sites distributed throughout the city using an electromagnetic vibrator. The recorded Rayleigh wave phase velocity dispersion curves are transformed to calculate the apparent velocity distribution in depth. Shear-wave velocities, calculated using theoretical relationships, can then be utilized to obtain design parameters for the soil strata. Shear-wave velocity varies from 216.97 to 829.59 m/s through Jizan City indicating the remarkable change of the near-surface sediments. The hard soil profiles of soft rock that were revealed by Vs values in this terrain (sites No. 7, 8, and 13) can be attributed to the existence of a dense layer of salt rock. Construction in such areas is prohibited due to the high susceptibility of large settlements in foundations as a consequence of salt dissolution. In the Sabkha terrains, all soil profiles were related to Vs, defined as stiff soils that were then modified to a softer class owing to their high liquefaction potential. These results should be considered before establishing important and strategic projects in the city.
Keywords
Shear-wave velocity
CSSASW
Dispersion
Jizan
Saudi Arabia

- ASTM
-
American Society for Testing and Materials
- CSSASW
-
Controlled-source spectral analysis of surface wave
- ICC
-
International code council
- JMOC
-
Japan Ministry of Construction
- SASW
-
Spectral analysis of surface waves
- SWV
-
Shear-wave velocity
Abbreviations
1 Introduction
In situ shear-wave velocity (SWV) evaluation depending on the propagation of elastic waves generated at shot-point and recorded at receiver locations. Rodriguez-Ordonez (1994) provided an excellent overview for SWV profiling methodologies including two major groups: a drilling-based group (invasive methods) and a group based on surface techniques (noninvasive methods).
The CSSASW dispersion measurement by Rodriguez-Ordonez (1994) is a noninvasive method used in the United States and Japan for site classification. In March 1997, the Japan Ministry of Construction (JMOC) certified the CSSASW method as a standard test in Japan, similar to an ASTM designation in the United States. Furthermore, the CSSASW technique is a widely used and accepted method in both of geotechnical and civil engineering applications for the assessment of material properties in layered structures using the surface waves dispersion characteristics.
The propagation velocity of surface waves (Vs) depends on the soil structure. However, if soil properties vary, then the surface waves of different wavelengths travel at different phase velocities. This variation of phase velocity (Vf) with wavelength is referred to as dispersion. The process of determining the Vs structure is stated as the Vf–Vs method. The Vf–Vs principle is utilized in several different methods as (SASW), CSSASW, and other techniques based on using background vibrations or earthquake data to get the dispersion of surface wave.
The Vf–Vs methods aims to acquire a SWV profile using the measured dispersion curve. This is an inverse problem in which the system properties are computed from the response to an excitation of stress waves. Forward modeling of elastic wave propagation is the primary tool utilized in the inverse problem. Using these models, the dispersion curves can be computed for a known soil profile.
The inversion procedures for the Vf–Vs methods currently available have significant limitations. They require extensive computations, the outcomes are not unique, and there are no appropriate means to assess the resolution and accuracy of the outcomes. In addition, these procedures require highly specialized and experienced analysts. These drawbacks have limited the general use of the Vf–Vs methods. However, the CSSASW approach alleviates these limitations, extending the application areas of the Vf–Vs methods.
Jizan City represents one of the vital cities in Saudi Arabia (Fig. 1), where it has major economic and strategic projects have been planned for the near future. Furthermore, the city extends parallel the Red Sea coastal strip and covered with soft sediments and sabkha with a considerable thickness. The geotechnical parameters of near-surface sediments in Jizan City have been evaluated by Alhumimidi (2020). In addition, the soil kinetic properties and the soil competence scale in the Jizan area have been evaluated by Abdelrahman et al. (2021a) & Abdelrahman et al. (2021b). Through the current study, the SWV profiles at a depth of 30 will be assessed using the CSSASW system.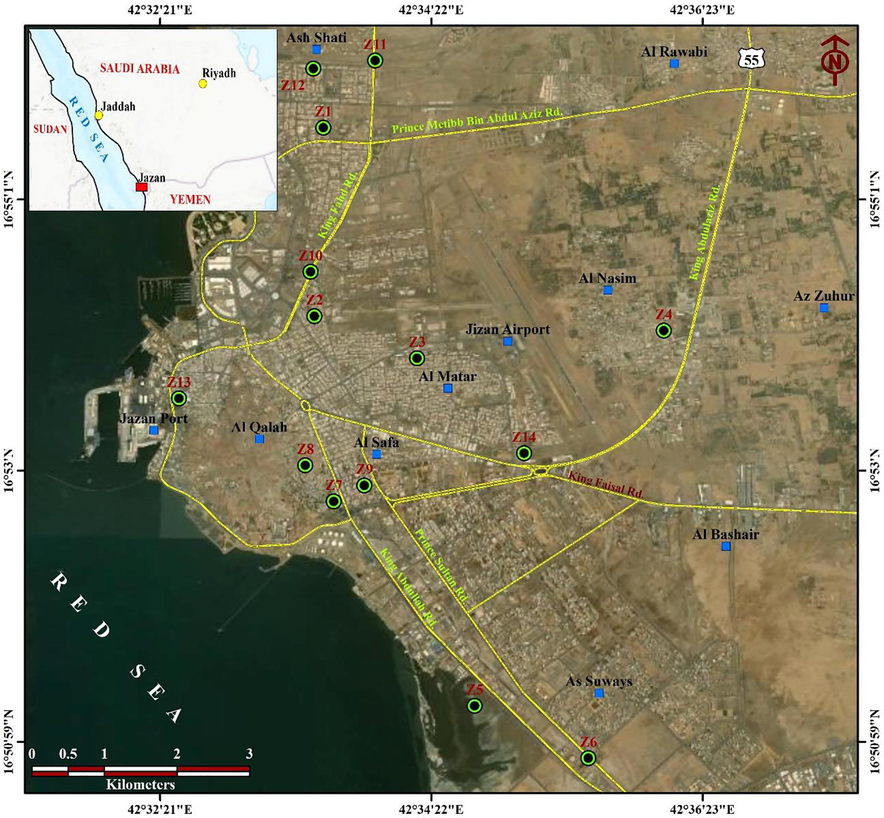
Location map of Shear-Wave test sites in Jizan city.
2 Geologic setting
The Jizan site is located in the southern Arabian Shield where the geological setting is the heterogenous including hard (the late Proterozoic rocks), soft (Cambrian and early Tertiary times), the middle Tertiary and the present Red Sea basin (Blank et al., 1986). These tectonically quiescent conditions terminated with the onset of volcanism. In a traverse from west to east, the following units are encountered: the sabkha deposits (200–300 m), an aboard zone of Quaternary alluvial deposits (30–35 km), Quaternary basalts, and then a narrow zone of Tertiary igneous rocks with Ordovician sandstones that were exposed by faulting. To the east, the Precambrian basement complex forms the elevated mountains (Fig. 2).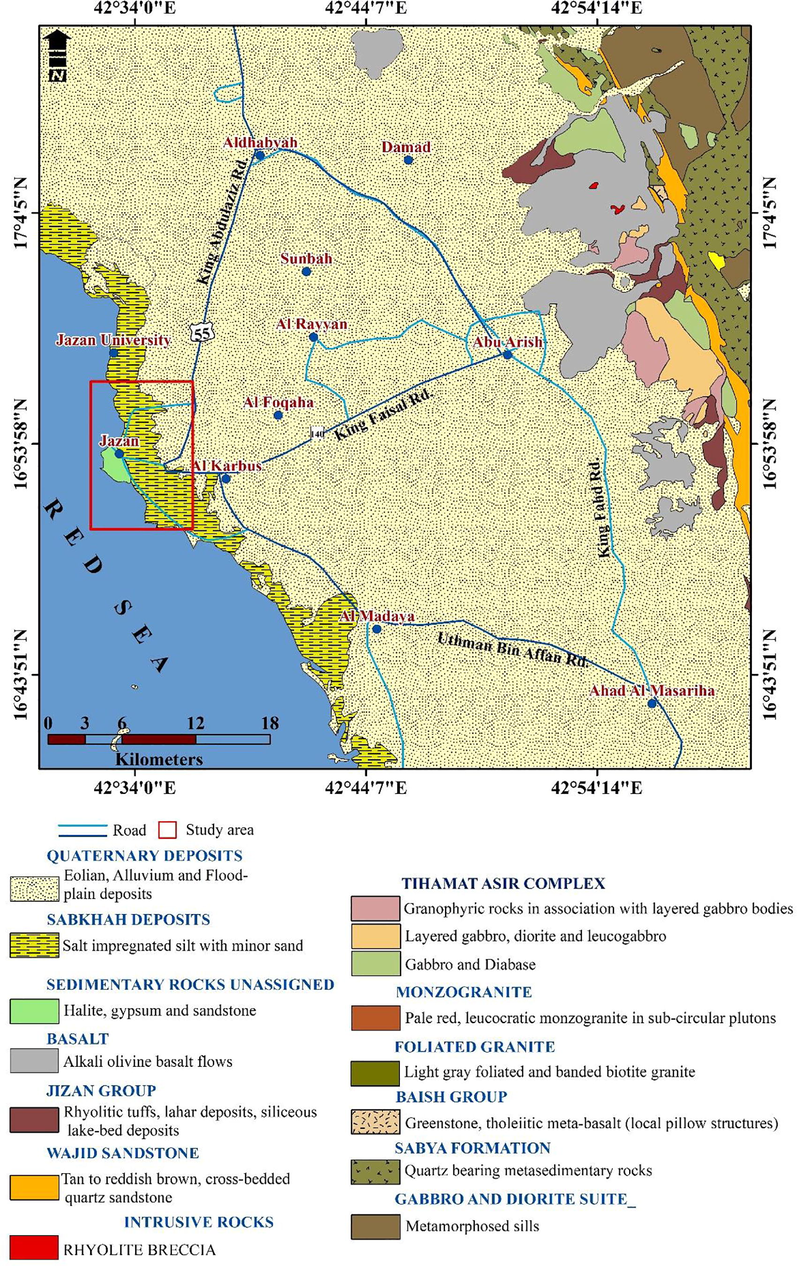
Geological setting of Jizan city.
The salt rocks are mostly composed of gypsum, which have diapirically upward through the Baid formation. These rocks are awfully faulted and disturbed, but the sequence at the salt dome composed of the following:
1. Massive halite containing thin sections of anhydrite reaches a thickness of approximately 1500 m.
2. Fine, silty sandstone and shale rich in organic matter of about 50 m.
Alluvial terrace deposits constitute approximately 40% of the Quaternary deposits composed primarily of sand, gravels and silts. Sideways of the Red Sea coastal line, extensive sabkha deposits occur, dissected by alluvium or eolian sands with thickness of 5–6 m. Alluvial deposits occupy all the major streams. They contain flood plain and terrace deposits. The terrace deposits consist of gravels, sands, silts, and clay. Silts and the associated fine sediments are gypsiferous.
3 Geotechnical characterization of sites
Local soil conditions can have significant effects on ground surface motions and the behavior of supported structures. The strong earthquake and collapse of multiple buildings in Mexico City in 1985 due to the dynamic prperties of the soft clay (Dobry and Vucetic, 1987; Seed, et al., 1985). During the Armenian Earthquake in 1988, the large horizontal amplifications and widespread damages in Leninakan, as compared with the damages in relatively close Kirovakan, have been correlated with the characteristics of local geologic deposits.
The evaluation of the liquefaction potential strategy at selected sites initially focused on the collected information from boring conducted in the area to characterize the engineering properties of various geologic units. The soil logs of each city were obtained from several soil testing companies, engineering firms, and government agencies. The SPT-N values, grain size data, and soil classification data were the primary information compiled. To supplement our data, 14 carefully selected sites in Jizan City were tested using the CSSASW technique to obtain mean SWV results in the upper 30 m.
Soil conditions, based on collected data and data obtained from field work in Jizan City, are presented in the following sections. Three categories of geologic units are recognized in the city of Jizan as; sand dunes, sabkha deposits and salt rocks.
Sand Dune Deposits: These aeolian deposits vary in thickness (0–20 m) and are underlain by salt rock. The sand is primarily composed of fine quartz grains and volcanic rock fragments with a fine sediment content of 7%–30%, with an average of 19.8%. The natural water content of the sand ranges from 4% to 20%, with an average of 12.7%. The relative density of the sand significantly varies from loose at shallow depth (0–2 m), loose to medium at intermediate depth (2–10 m), and dense to very dense below. The standard penetration resistances vary by location and appear to range from 4 to 18 for the upper 5–10 m.
Sabkha Deposits: The flat coastal plain surrounding the elevated terrain in the north and south is covered by recently deposited thick sediments that consist of soft or loose organic saline soils, known locally as sabkha. The base layer consists of fine to coarse and dense to very dense sand.
Salt dome: According to Basyoni and Aref (2015), the highest topographic area (50 m) in the coastal plain of Jizan is a salt dome at the old Jizan city (Fig. 1). The salt dome consists of a massive and thin bedded clear, colorless, mosaic, halite crystals on fresh surface and gray on weathered surface. The halite mass has vertical dissolution lines with sharp ridges in between due to their recent dissolution by rainfall. Several dissolution sinkholes with a diameter less than 4 m and depth exceeding 6 m were observed at the floor of the quarries made in the area of salt dome. The halite of the salt dome is usually enclosed with duricrust due to re-precipitation of halite crust on the weathering surface that may form polygonal ridges. The cap rocks of the salt dome are gypsum, anhydrite, dolomite, shale, and sandstone layers.
4 Methodology
The CSSASW is utilized in the project for SWV measurements and is recognized as a relatively noninvasive and cost-effective approach for obtaining SWV data (Rodriguez-Ordonez, 1994). The CSSASW technique measures the dispersion of Rayleigh waves produced by a controlled vibrator using an accelerometer and a digital data processing unit. The 700-kg electromagnetic source is made to vibrate with a periodic random signal produced by a signal analyzer and amplified by a 20-Amp power amplifier. The signal has a flat spectrum over the considered frequency range. The system produces Rayleigh waves in the range of 3 to 100 Hz, with a wavelength of up to 59 m. During the test, the wave component velocity is obtained by measuring the phase of the cross-power spectrum between two receivers located at specified distances from the source. The velocity is assessed depending on the phase lag and the receiver’s distance. The typical spacing used is 1, 2, 5, 10, and 15 m, and the frequencies are between 3 and 100 Hz. From the test data and further processing, it is possible to get the SWV profile down to a 30-m depth.
In a CSSASW test, the receivers are located colinearly to the source at specified distances. The acceleration, or velocity response, is measured at the receiver locations, and the cross-power spectrum is calculated. The recorded phase of the cross-power spectrum is the basis of the spectral analysis of Rayleigh waves. During the tests, the phase shift (
) between the two receivers is automatically computed. The calculation of the phase velocity is based on the consideration that the travel time for one wavelength is the inverse of the frequency (
). The travel time (
, which is equivalent to the phase shift, is computed using Equation (1):
During this time, the wave traveled over the distance between the receivers (
) at a velocity of Vf. The phase velocity (Vf = X/t) is automatically computed using Equation (2):
The wavelength (λ) is computed as λ = Vf/f. The results obtained from Equation (2) for the discretized frequency range represent the experimental dispersion curve. These data are the basis for the interpretation of the SWV structure, as presented in Fig. 2. The entire interpretation procedure (Rodriguez-Ordonez 1994) additionally handles distinct layers within the SWV that deviate from the reference profile. However, the focus of this paper is on the obtainment of the reference SWV profile of the soil from the measured dispersion curve. Therefore, it is expected that the SWV reference profile has a typical form (as most soils do) and that it is composed of one or more relatively uniform materials.
Fig. 3 presents the flow chart for the new interpretation procedure including three components; The first is the definition of the target dispersion curve from the Vf–Vs measurement, denoted by F(λ). This module describes the phase velocity as a function of the wavelength λ. F(λ) is related to the dispersion curve of the obtained SWV profile. This interpretation procedure is useful in case of the dispersion curve is controlled by the fundamental mode of Rayleigh waves. The second is the computation of the phase velocity reference profile. The parameters that describe the reference profile are attained by minimizing the sum of squares of the difference between the target data and the reference profile (RO) as follows:
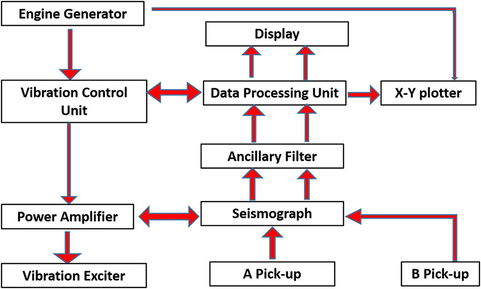
Flow chart of CSSASW data collection and processing sequence.
The third component is the computation of the SWV reference profile. The dispersion curve of the SWV reference profile matches that of the phase velocity reference profile. It is assumed that the SWV and phase velocity reference profiles have the same functional form. Equations (4) and (5) may be used to calculate the SWV reference profile parameters when considering only one material. An optional optimization may be carried out to refine the parameters obtained from the equations, although this is usually not required for a single material model.
The corresponding equation obtained for
When there are several materials, Equations 12 and 13 can be used to calculate the first estimate of the parameters for the SWV reference profiles associated with each material. A refinement is then obtained by minimizing R1, which is the sum of squares of the difference between the phase velocity reference profile and the dispersion curve obtained with the SWV reference profile parameters as follows:
At this point, the obtained dispersion curve is compared with the target dispersion curve (F(λ)). Often, the approximation obtained from the reference profile is accurate enough for a final interpretation within the resolution limits of the Vf–Vs method. In the case, the site amplification evaluation of the data is adequate.
5 Results and discussion
Fig. 4 reveals the SWV depth profile for site no. 3, as an example, in Jizan city while Figs. 5 and 6 illustrate the soil profiles from 14 sites. The data are organized in columns indicating depth (D) in m spanning up to the bottom of the respective layer, SWV (Vs) in m/s, and layer thickness in m. The depth limit is 30 m, which is in accordance to the proposed site classification methods of the NEHRP (1994a), NEHRP (1994b). The bottom of the dataset shows the respective average SWV to 30-m depth that is calculated as the average of the layered SWV inverse values, as expressed in Equation (7).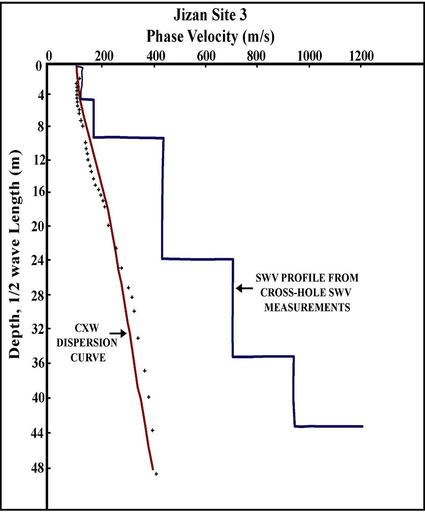
Shear-wave velocity profile for test site No.3 in Jizan city.
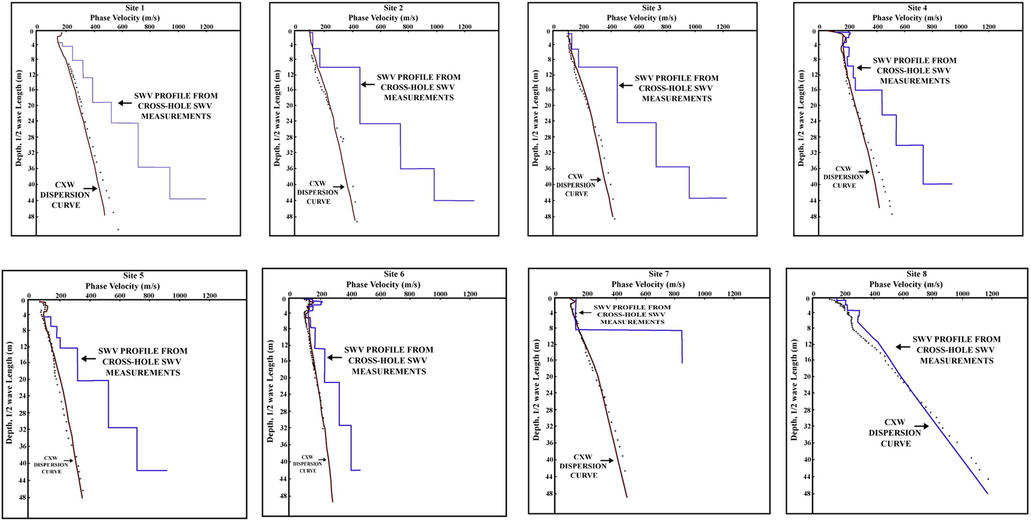
Shear-wave velocity profiles for test sites from 1 to 8 in Jizan city.

Shear-wave velocity profiles for test sites from 9 to 14 in Jizan city.
According to NEHRP (1994a), NEHRP (1994b) recommendations, the seismic soil profile classification (site class) is defined in terms of a weighted average of SWV (Vs), that can be calculated for the top 30 m as follows:
where the symbol i refers to any one of the layers between 1 and n; Vs, the SWV; and di, the depth of the respective layer in consistent units.
In noninvasive testing, there is the issue of valid comparisons with the direct measurement methods. It is widely accepted that the cross-hole SWV measurement is the only method that provides accurate comparisons for the CSSASW method. The down-hole SWV measurement can be useful for such a comparison; however, it is less precise and more operator-subjective than the cross-hole measurement, and its application is limited by the cost of such a comparison. Many investigators have used the CSSASW database, which is available in more than 400 sites in Japan, California, New York, Alaska, and Hawaii, for site-specific seismic response studies. In Japan, there is a database with more than 20 sites where comparative cross- and down-hole SWV measurements were obtained at a depth of 30 m in several different geologic formations. In March 1997, the Japanese Ministry of Construction used this database to approve the CSSASW method as a standard method. The JMC certification in Japan is similar to other test methods, such as the American Society for Testing and Materials (ASTM). Based on the recent CSSASW results from Japan and Alaska, the CSSASW has been proposed as a standard method, and it is now being considered for adoption by ASTM Committee D18 (ASTM STP 1350, January 1998). Several independent researchers have demonstrated a strong correlation of the CSSASW results to direct SWV measurements. Park and Elrick (1998) used the CSSASW to map seismic site response in Southern California. whereas Nath et al. (1997) demonstrated a very strong correlation between the CSSASW and direct SVW measurements.
6 Conclusions and recommendations
Shear-wave velocity has been estimated at 14 carefully selected sites in Jizan city to depict the soil profile at depths of 50 m. The used approach depends on SWV structures from Rayleigh wave dispersion curves (the Vf–Vs method) according to the reference profile concept. A reference profile describes the average dispersion curve and corresponding SWV structure, and it is consistent with the fundamental dependency of SWV on the confining pressure (depth) in soils.
The noninvasive CSSASW dispersion measurements provide cost-effective dispersion data up to a great depth. These data are used to obtain reference profiles for most soil formations. This technique is rapid and computationally efficient, and its results are more illustrative of the actual soil structure than the results attained from other noninvasive methods. This method was verified at several sites where accurate cross-hole SWV data was also available.
The most significant and notable results that have been achieved. The technique of the CSSASW was employed for the measurements of SWV profiles at depths down to 50 m for 14 sites in Jizan City. These velocities were comprehensively used to classify the soil profiles of Jizan sites, as per the recent state of knowledge on the soil-site categories for building design codes. Specifically, the current provisions of the NEHRP on soil profile definitions (1994), which were adopted in both UBC-1997 (1997) and IBC-2000 (2000), were adopted in this study. The values of Vs were calculated for Jizan City.
In Jizan City, the soil profiles cannot be classified solely based on the Vs values. This is due to the inferred problematic soil formation and pertinent liquefaction potential in the city. As presented in Fig. 2, there are two main soil formations in Jizan. These are the elevated terrain and sabkha soil. The elevated terrain is underlain by the salt dome, which is the predominant structural feature in the coastal area. Thus, the hard soil profiles of soft rock that were revealed by the Vs values in this terrain (sites No. 7, 8, and 13) can be attributed to the existence of a dense layer of salt rock. Construction in such areas is prohibited due to the high susceptibility of large settlements in foundations as a consequence of salt dissolution. In the sabkha terrains, all soil profiles were related to Vs, defined as stiff soils that were then modified to a softer class owing to their high liquefaction potential. The predominant liquefaction potential in the sabkha terrains causes the classification of these sites to fit softer classes. Therefore, these sites require site-specific geotechnical evaluations, especially for buildings that are classified as special or essential in the seismic design code.
Acknowledgments
Deep thanks and gratitude to the Researchers Supporting Project number (RSP-2021/351), King Saud University, Riyadh, Saudi Arabia for funding this research article.
Declaration of Competing Interest
The authors declare that they have no known competing financial interests or personal relationships that could have appeared to influence the work reported in this paper.
References
- Geotechnical assessment of near-surface sediments and their hazardous impact: Case study of Jizan city, southwestern Saudi Arabia. Journal of King Saud University – Science. 2020;32(3):2195-2201.
- [Google Scholar]
- Basyoni, M. H. and Aref, M. A. (2015): Sediment characteristics and microfacies analysis of Jizan supratidal sabkha, Red Sea coast, Saudi Arabia. Arab. J. Geosci. DOI 10.1007/s12517-015-1852-1.
- Blank, R., Johnson, P., Gettings, M., Simmons, G., 1986. Explanatory notes to the geologic map of Jizan quadrangle, sheet 16F, deputy ministry of mineral resources, Jeddah, Saudi Arabia, p. 25.
- State-of-the-art report: Dynamic properties and response of soft clay deposits, Proc. Intl. Symp. ON Geotec. Eng. Of Soft Soils, Mexico City. 1987;2:51-87.
- [Google Scholar]
- Evaluation of kinetic moduli and soil competence scale of soil profiles in Jizan area, southwestern Saudi Arabia. Arabian J. Geosci.. 2021;14:172.
- [CrossRef] [Google Scholar]
- Kamal Abdelrahman & Abdullah M. Al-Amri & Mohammed S. Fnais & Saleh Qaysi & Ali K. Abdelfattah & Naif Al-Otaibi (2021b): Site effect and microzonation of the Jizan coastal area, southwestern Saudi Arabia, for earthquake hazard assessment based on the geotechnical borehole data. Arabian Journal of Geosciences (2021) 14:688 10.1007/s12517-021-07049-8.
- Correlation study of shear wave velocity in near surface geological formations in Anchorage, Alaska. Earthquake Spectra. 1997;13(1):55-75.
- [Google Scholar]
- NEHRP, 1994. Recommended provisions for the development of seismic regulations for new buildings, building seismic council, Washington, D.C.
- NEHRP. 1994. Recommended provisions for seismic regulations for New buildings, Pail 2-Conunentaiy, Federal emergency management agency, 1994 edition, building seismic safety council, Washington, D.C., p. 335.
- International building code 2000 (IBC2000), 1998. Final draft, international code council (ICC), falls church, Virginia.
- Predictions of shear wave velocities in southern California using surface geology. Bull. Seismol. Soc. Am.. 1998;88:677-685.
- [Google Scholar]
- Rodriguez-Ordonez, J.A, 1994. New method for interpretation of surface wave measurements in soil, Ph.D. Dissertation. North California state university, civil engineering department.
- Uniform building code (UBC 97), 1997. The international conference of building officials, Whittier, California.


