

Translate this page into:
Serum iron deficiency and 25-hydroxyvitamin D deficiency as an independent risk factor for osteoporosis in postmenopausal Arab women
⁎Corresponding author at: Biochemistry Department, College of Science, King Saud University, Riyadh 11451, Saudi Arabia. ndaghri@ksu.edu.sa (Nasser M. Al-Daghri)
-
Received: ,
Accepted: ,
This article was originally published by Elsevier and was migrated to Scientific Scholar after the change of Publisher.
Peer review under responsibility of King Saud University.
Abstract
Background
Iron deficiency and 25-hydroxyvitamin D (25(OH)D) deficiency are among the most common nutrient deficiencies in the world. Osteoporosis, a major bone disorder, is prevalent globally as well as in Saudi Arabia. The relationship between these micronutrient deficiencies with osteoporosis is less investigated. Hence, the current study aimed to determine the relationship between iron and 25(OH)D deficiencies among postmenopausal Saudi women with osteoporosis and their associations with bone biomarkers.
Methodology
A total of 184 postmenopausal Saudi women ≥ 45 years old [N = 75 osteoporosis group; N = 109 without osteoporosis or control group] were enrolled in this cross-sectional study. Anthropometrics and bone mineral density were measured. Serum iron indices, 25(OH)D and bone biomarkers [β-carboxyterminal telopeptide of type 1 collagen (β-crosslap), osteocalcin (OC), osteoprotegerin (OPG), osteopontin (OPN) and bone-specific alkaline phosphatase (BsALP) were determined.
Results
In all subjects, significant associations were observed between serum iron and OC (r = 0.19; p = 0.02) as well as OPN (r = 0.17; p = 0.05). Also, serum 25(OH)D was inversely associated with BsALP (r = −0.25; p = 0.02), and positively with β-crosslap (r = 0.38; p = 0.01). An inverse significant association was observed between 25(OH)D and OPG (r = −0.25; p = 0.01) in the control group and BsALP (r = −0.31; p = 0.02) in the osteoporosis group.
Conclusion
Significant associations between circulating iron and 25(OH)D with select bone biomarkers were observed in postmenopausal Arab women with osteoporosis, suggesting that these micronutrients may affect bone metabolism.
Keywords
Iron deficiency
Vitamin D deficiency
Osteoporosis
Postmenopausal
Arab women

- ALP
-
alkaline phosphatase
- β-crosslab
-
beta-carboxyterminal telopeptide of type 1 collagen
- BMD
-
bone minerals density
- BMI
-
body mass index
- BsALP
-
bone-specific alkaline phosphatase
- DXA
-
dual-energy x-ray absorptiometry
- GCC
-
Gulf Cooperation Council
- ID
-
iron deficiency
- IDA
-
iron deficiency anemia
- NTx
-
N-telopeptide cross-linked of type 1 collagen
- OC
-
osteocalcin
- OPG
-
osteoprotegerin
- OPN
-
osteopontin
- P1NP
-
N-terminal propeptide of type 1 procollagen
- SOST
-
sclerostin
- VDD
-
vitamin D deficiency
- VDR
-
vitamin D receptors
- WHR
-
waist-to-hip ratio
Abbreviations
1 Introduction
Osteoporosis is a common disease of the elderly caused by decreased mass, strength and microarchitecture of bone that leads to increased risk for fractures (Rachner et al., 2011). It is established that the skeletal system is a metabolically active organ influenced by key markers of bone remodeling that involves formation [e.g., osteocalcin (OC), osteopontin (OPN), bone-specific alkaline phosphatase (BsAlp), N-terminal propeptide of type 1 procollagen (P1NP)] and resorption [e.g., osteoprotegerin (OPG), N-telopeptide cross-linked of type 1 collagen (NTx)] in the physiology of osteoporosis (Eastell and Szulc, 2017). Globally, osteoporosis affects ∼200 million individuals, mostly women (Kanis, 2007). In Saudi Arabia, the prevalence of osteoporosis among women aged >50 years was 34% (Sadat-Ali et al., 2012).
Vitamin D has well-known significant functions in bone metabolism. Vitamin D deficiency (VDD) has been linked to secondary hyperparathyroidism and bone loss, low bone mineral density (BMD) and an elevated risk of osteoporosis (Lanham-New et al., 2011). VDD is very common in Saudi Arabia as well as most countries in the Gulf Cooperation Council (GCC) region despite year-long sunshine (Al-Saleh et al., 2020).
Iron is a trace element with a significant role in energy production and metabolism. It participates in the form of ‘heme’ which is found in hemoglobin, myoglobin and cytochromes (Wilson and Reeder, 2008). Iron deficiency (ID) is a state of decreased iron stores despite normal erythropoiesis and absence of anemia (Stoltzfus and Dreyfuss, 1998). More than 30% of the world's population suffer from anemia due to ID (McLean et al., 2009). In Saudi Arabia, the prevalence of iron deficiency anemia (IDA) ranges from 11.6% in school children secondary to growth spurts, and as high as 40% among women of childbearing age due to menstrual blood loss (Hwalla et al., 2017).
Iron has an important role in collagen formation (Shoulders and Raines, 2009). An important step during collagen synthesis is hydroxylation of lysine and proline amino acids. This reaction is catalyzed by enzymes lysyl and prolyl hydroxylase (Gorres and Raines, 2010). Iron acts as a cofactor for these two enzymes (Tuderman et al., 1977). Furthermore, iron is involved in bone metabolism by affecting vitamin D activation and inactivation process through participation as cofactor of several heme-containing monooxygenases, a superfamily of cytochrome P450 which plays a major role in these pathways (Pikuleva and Waterman, 2013). In Saudi Arabia, circulating iron indices were observed to be inversely associated with 25(OH)D levels among adolescents and modestly decreased after vitamin D supplementation (Masoud et al., 2018, 2020). Whether these micronutrients are also associated among Arab women with osteoporosis and whether such micronutrients influence bone markers in the same population remains to be investigated. The present study aims to fill these gaps.
2 Materials and methods
2.1 Subjects and blood collection
In this cross-sectional study, a total of 184 postmenopausal women age ≥45 years were included. The subjects were selected randomly from the Osteoporosis Registry Database in King Saud University (KSU), a capital-wide database of Saudi patients where bone mineral density was assessed between 2013 and 2016 at King Khaled University Hospital, King Fahad Medical City and King Salman Hospital, Riyadh, Kingdom of Saudi Arabia (KSA) (Wani et al., 2019; Ansari et al., 2020). Written informed consents were taken from all subjects prior to inclusion. Ethics approval was obtained from the College of Science in KSU, Riyadh, Saudi Arabia (No 8/25/454266). Information extracted included demographics, general health status and past medical history. Exclusion criteria included those with chronic medical conditions (e.g., cardiac, kidney, liver, or psychiatric conditions), and those who took calcium supplements or hormone replacement therapy. For this particular study, the group included 75 women diagnosed with osteoporosis by clinicians based on clinical features and radiological evidence, and 109 age matched women without osteoporosis (controls). Blood samples were collected after overnight fasting and immediately transferred to non-heparinized labeled serum separator tubes. These tubes were then centrifuged at 5000 rpm for 10 min to obtain serum and stored in specialized containers until biochemical analysis at −80 °C at the Chair for Biomarkers of Chronic Diseases in KSU, Riyadh, KSA.
2.2 DXA and anthropometry
Diagnosis of osteoporosis was assessed in spine and femur (left). It was done for all subjects was using dual-energy X-ray absorptiometry (DXA) (Hologic QDR 2000 Inc., Woltham, MA). BMD was measured as (g/cm2) and T-scores were used for diagnosis (Al-Saleh et al., 2020). All participants visited their respective hospitals for measurement of anthropometry. Height and weight were rounded to the nearest 0.5 cm and 0.1 kg, respectively. Waist-to-hip ratio (WHR) was calculated as the ratio of waist and hip circumference (cm) and body mass index (BMI) was calculated as (kg/m2) body weight (kilograms) by height (square meters).
2.3 Sample analysis
2.3.1 Measurements of biochemical parameters, serum iron, vitamin D and bone biomarkers
Measurements of calcium and albumin were done using a chemical autoanalyzer (Konelab, Espoo, Finland). Serum iron concentration and total iron binding capacity were determined using Spectrophotometer (Spectra Max® M5, Molecular Devices LLC, US). Transferrin was measured using commercially available assays. Serum 25-hydroxyvitamin D (25(OH)D), N-telopeptide cross-linked of type 1 collagen (NTx), β-carboxyterminal telopeptide of type 1 collagen (β-crosslap), N-terminal propeptide of type 1 procollagen (P1NP) and bone-specific alkaline phosphatase (BsALP) were assessed using electro-chemiluminescence immunoassay kits purchased from Roche Elecsys Modular Analytics Cobas e411, an automated analyzer (Roche Diagnostics, Mann-heim, Germany). Osteoprotegerin (OPG), osteocalcin (OC), osteopontin (OPN) and sclerostin (SOST) were determined according to the manufacturer's protocol by Luminex Multiplex Assay system (Luminex Inc.) using kits purchased from Millipore’s Milliplex MAP.
2.4 Statistical analysis
Data analysis was done by using SPSS version 16.0 (Chicago, IL, US). Normally distributed continuous parameters were presented as mean ± standard deviation (SD). Non-normal parameters were presented as median (1st quartile – 3rd quartile). Categorical data were presented as frequencies and percentages (%). Kolmogorov-Smirnov test was used to check normality of continuous variables. Comparison between groups were performed using Independent Student T-test for normal data and Mann Whitney U test for non-normal data. Correlation analysis was done to determine associations and presented as coefficients (R). Univariate and multivariate linear regression analysis were done to determine independent factors affecting serum iron. Significance was set at p-value < 0.05.
3 Results
A total of 184 postmenopausal Saudi women [N = 109 normal (59.2%) and N = 75 (40.8%) with osteoporosis] aged ≥ 45 years were included in this present cross-sectional study. Demographics and clinical characteristics between control and osteoporosis groups are shown in table 1. Women with osteoporosis were significantly older (58.5 ± 8.2) than those without osteoporosis (53.5 ± 5.1). The osteoporosis group also had a significantly lower mean BMI (30.4 kg/m2 ± 5.7) than the control group (34.0 kg/m2 ± 6.1). The osteoporosis group had significantly more years of menopause (p-values < 0.001) than the control group. The rest of the anthropometric measures showed no significant difference between groups. As expected, the BMD of both spine and dual femur (left) were significantly lower in the osteoporosis group than controls (p < 0.001). A significantly higher serum 25(OH)D (p = 0.027) was observed in the osteoporosis group (82.3 nmol/L ± 37.5) than controls (70.4 nmol/L ± 33.8). Non-significant associations were shown between groups with respect to calcium, corrected calcium, albumin and the rest of the bone markers including iron indices (Table 1). Note: # denotes non-normal data; Significant at p < 0.05.
Parameters
Control
Osteoporosis
P-value
N
109 (59.2)
75 (40.8)
---
Age (years)
53.5 ± 5.1
58.5 ± 8.2
<0.001
BMI (kg/m2)
34.0 ± 6.1
30.4 ± 5.7
<0.001
WHR (cm)
0.9 ± 0.1
0.9 ± 0.1
0.08
Menarche (years)
13.3 ± 1.3
13.3 ± 1.6
0.86
Menopause (years) #
5.0 (3.0–8.0)
10.0 (4.0–19.0)
<0.001
BMD (g/cm2) (Spine) #
−0.2 (-0.6–0.2)
−3.0 (-3.3- −2.7)
<0.001
BMD (g/cm2) (Dual Femur left) #
0.7 (-0.3–1.1)
−1.3 (-2.0 - −0.6)
<0.001
25(OH) D (nmol/L)
70.4 ± 33.8
82.3 ± 37.5
0.03
Calcium (mmol/L)
2.3 ± 0.3
2.3 ± 0.2
0.54
Albumin (g/L)
40.6 ± 5.3
39.5 ± 4.5
0.37
Corrected calcium (mmol/L)
2.3 ± 0.2
2.3 ± 0.2
0.56
NTx (nmol/L)
56.5 ± 16.4
59.6 ± 29.0
0.75
β-crosslap (ng/ml) #
0.01 (0.01–0.09)
0.07 (0.01–0.10)
0.36
P1NP (ng/mL) #
15.3 (7.0–33.6)
20.5 (6.6–43.6)
0.45
BsALP (µg/L) #
15.1 (11.2–18.6)
14.2 (11.3–20.9)
0.45
OPG (ng/ml) #
0.6 (0.3–0.8)
0.4 (0.3–0.8)
0.39
OC (ng/ml) #
4.8 (1.9–9.8)
5.4 (1.9–1.4)
0.25
OPN (ng/ml) #
0.8 (0.5–2.2)
0.6 (0.3–1.6)
0.06
SOST (ng/ml) #
0.7 (0.4–1.9)
0.7 (0.4–1.7)
0.54
Serum iron (µg/dL) #
180 (120–280)
180 (130–250)
0.94
Total iron binding capacity (mg/L) #
3.9 (2.8–4.3)
3.9 (3.1–4.4)
0.81
Transferrin saturation (%) #
38.3 (27.3–66.0)
44.9 (30.6–65.5)
0.41
Transferrin (ng/L)
657.2 ± 190.3
692.2 ± 243.3
0.56
The bivariate associations between serum iron and all the parameters measured are shown in table 2 for all subjects as well as after stratification to those with and without osteoporosis. In all subjects, a significant inverse association was observed with corrected calcium (r = −0.31; p = 0.02). Furthermore, a significant positive correlations between iron and OC (r = 0.19; p = 0.02) (Fig. 1), OPN (r = 0.17; p = 0.05) (Fig. 2); and transferrin saturation (%) (r = 0.80; p = 0.001) were found. The rest of the associations were not significant. Note: Data presented as coefficients (R); * denotes significance at p < 0.05; ** denotes significance at p < 0.01. Significant at p < 0.05.
Parameters
Overall
Control
Osteoporosis
Age (years)
−0.02
0.03
−0.12
BMI (kg/m2)
−0.14
−0.15
−0.14
WHR (cm)
−0.03
−0.07
0.01
Menarche (years)
−0.07
−0.01
−0.12
Menopause (years)
−0.08
−0.10
−0.11
BMD (g/cm2) (Spine)
−0.03
−0.07
−0.09
BMD (g/cm2) (Dual Femur left)
0.07
0.11
0.06
25(OH)D (nmol/L)
−0.10
−0.01
−0.24
Calcium (mmol/L)
−0.23
−0.21
−0.22
Albumin (g/L)
−0.08
0.02
−0.17
Corrected calcium (mmol/L)
−0.31*
−0.34*
−0.26
NTx (nmol/L)
0.03
−0.02
0.20
β-crosslap (ng/ml)
0.02
0.03
−0.02
P1NP (ng/mL)
−0.08
−0.13
−0.05
BsALP (µg/L)
0.11
−0.06
0.21
OPG (ng/ml)
0.13
0.10
0.14
OC (ng/ml)
0.19*
0.25*
0.10
OPN (ng/ml)
0.17*
0.21
0.08
SOST (ng/ml)
0.15
0.11
0.26
Total iron binding capacity (mg/L)
−0.13
−0.13
−0.11
Transferrin saturation (%)
0.80**
0.82**
0.73**
Transferrin (ng/L)
0.13
0.16
0.16
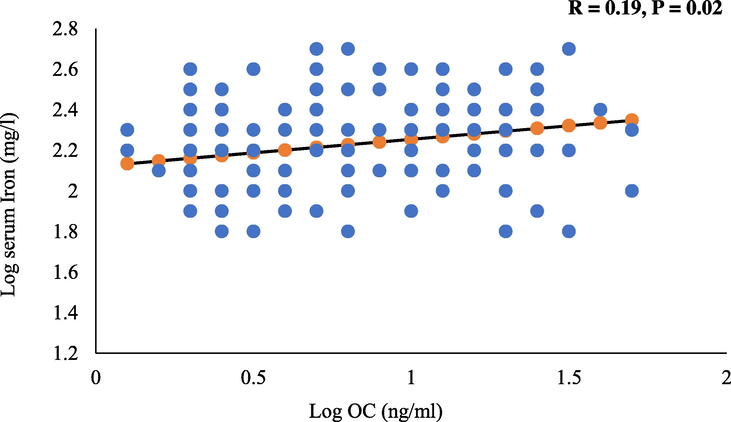
Significant positive association between log iron and log OC.
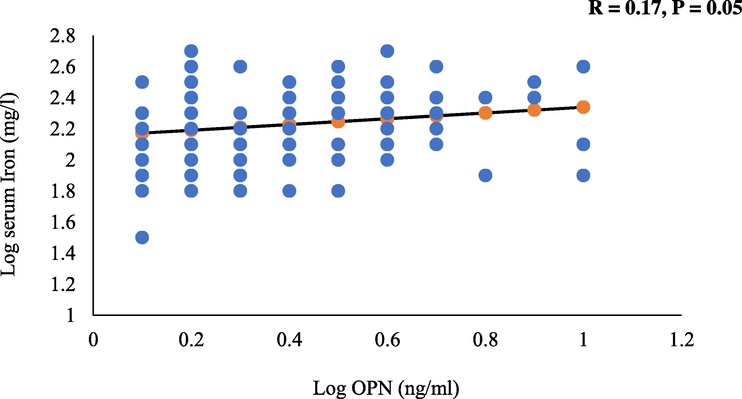
Positive and borderline significant association between log iron and log OPN.
Stratification according to the presence of osteoporosis revealed that in the control group, OPN had a borderline significant association (r = 0.21; p = 0.06) with iron. Significant positive correlations of iron were also observed with OC (r = 0.25; p = 0.02) and transferrin saturation (%) (r = 0.82; p = 0.001), while a significant inverse association was observed with corrected calcium (r = −0.34; p = 0.05). All other associations were not significant. In the osteoporosis group, SOST had a borderline significant association with iron (r = 0.26; p = 0.06). Transferrin saturation (%) was also significantly positively correlated with iron (r = 0.73; p = 0.001). All other associations were not significant.
Table 3 displays the correlations between the various demographic characteristics and biomarkers measured with circulating 25(OH)D levels in all subjects and after stratification to those with and without osteoporosis. In all subjects, OPG (r = −0.14; p = 0.06) and OPN (r = −0.15; p = 0.06) both had borderline significant inverse associations with 25(OH)D. Furthermore, there were significant positive correlations observed with age (r = 0.31; p < 0.01), years of menopause (r = 0.27; p = 0.001) and β-crosslap (r = 0.38; p = 0.01) with 25(OH)D levels. Lastly, significant inverse correlations were observed with BMI (r = −0.25; p = 0.001), BMD in spine (r = −0.21; p = 0.02), in femur (r = −0.17; p = 0.01) and BsALP (r = −0.25; p = 0.02). All other associations were not significant including the lack of association between iron indices and vitamin D. Note: Data presented as coefficients (R); * denotes significance at p < 0.05; ** denotes significance at p < 0.01. Significant at p < 0.05.
Parameters
Overall
Control
Osteoporosis
Age (years)
0.31**
0.24**
0.36**
BMI (kg/m2)
−0.25**
−0.35*
0.02
WHR (cm)
−0.09
−0.08
−0.06
Menarche (years)
0.00
0.05
−0.07
Menopause (years)
0.27**
0.24*
0.21
BMD (g/cm2) (Spine)
−0.21*
−0.12
−0.18
BMD (g/cm2) (Dual Femur left)
−0.17*
−0.19*
0.03
Calcium (mmol/L)
0.06
0.06
0.07
Albumin (g/L)
0.09
0.15
−0.09
Corrected calcium (mmol/L)
−0.02
−0.13
0.12
NTx (nmol/L)
−0.24
−0.41
−0.10
β-crosslap (ng/ml)
0.38*
0.30
0.31
P1NP (ng/mL)
0.19
0.09
0.37
BsALP (µg/L)
−0.25*
−0.20
−0.31*
OPG (ng/ml)
−0.14
−0.25*
0.02
OC (ng/ml)
−0.06
−0.04
−0.11
OPN (ng/ml)
−0.15
−0.18
−0.03
SOST (ng/ml)
−0.06
0.00
−0.13
Serum iron (mg/L)
−0.10
−0.01
−0.24
Total iron binding capacity (mg/L)
−0.10
−0.17
0.02
Transferrin saturation (%)
−0.06
0.05
−0.29
Transferrin (ng/L)
0.00
0.01
0.12
In the control group, significant positive correlations of 25(OH)D were seen with age (r = 0.24; p = 0.01) and years of menopause (r = 0.24; p = 0.01). In contrast, significant inverse correlations of 25(OH)D were observed with BMI (r = −0.35; p = 0.001), BMD in femur (r = −0.19; p = 0.05) and OPG (r = −0.25; p = 0.01). Borderline inverse correlation of 25(OH)D was also seen with OPN (r = −0.18; p = 0.06). Lastly in the osteoporosis group, 25(OH)D was positively associated with age (r = 0.36; p = 0.001) and inversely correlated with BsALP (r = −0.31; p = 0.03) with a borderline significant inverse association with iron (r = −0.24; p = 0.06) (Table 3).
Table 4 shows the risk for osteoporosis according to iron status in vitamin D deficient subjects. Iron status was divided into quartiles and tertiles and cut-offs were identified accordingly. Results showed that osteoporosis was modestly associated (p = 0.055) with iron status for vitamin D deficient subject in iron tertile 2 group (141.0–217.2 µg/dL). The rest of quartiles and tertiles were not associated with osteoporosis in all participants. Note: Data presented as odds ratio (OR) (95% confidence interval, CI), Adjusted for age and BMI. P-value < 0.05 considered significant.
Iron Quartiles (µg/dL)
OR (95% CI)
P-value
Adj. OR (95% CI)
Adj. P-value
Q1 (≤125.2)
Reference
–
Reference
–
Q2 (125.3–180.1)
4.50 (0.67–30.23)
0.12
3.66 (0.37–36.36)
0.27
Q3 (180.2–252.9)
3.38 (0.40–28.74)
0.27
2.03 (0.09–44.56)
0.65
Q4 (≥253.0)
1.39 (0.21–9.24)
0.74
0.22 (0.12–4.37)
0.32
Iron Tertiles (µg/dL)
T1 (≤140.9)
Reference
–
Reference
–
T2 (141.0–217.2)
6.00 (0.97–37.30)
0.05
6.63 (0.67–65.44)
0.10
T3 (≥217.3)
2.77 (0.47–16.45)
0.26
0.62 (0.04–8.48)
0.72
4 Discussion
The present study determined associations between circulating iron and vitamin D with bone biomarkers in postmenopausal Arab women with and without osteoporosis. Results showed a modest inverse relationship between serum iron levels and vitamin D in the osteoporosis group. This finding is similar to a previous study by Thomas et al., (2015) that aimed to determine the relationship between VDD and iron status in pregnant women. It was suggested that no significant associations exists between maternal serum 1,25(OH)2D3 and iron status (Thomas et al., 2015). Other studies indicated that among postmenopausal women, a relative ID was observed in those with osteoporosis compared to those without (D’Amelio et al., 2008), and that significantly lower levels of iron were observed in patients with osteoporosis than controls (Okyay et al., 2013). These results were in disagreement with the findings of the present study. Serum iron, total iron binding capacity and transferrin saturation (%) were within normal range, most likely because they were postmenopausal so there is absence of menstrual blood loss. Furthermore, they did not have VDD because most of them were on vitamin D supplements.
In the current study, a significant positive association was found between iron and select bone markers (OC, BsALP, and OPN). The association of the iron and OC was determined in a previous report (D’Amelio et al., 2008). In contrast, Michaelsson et al.,(1995) suggested no significant association between OC and iron in women aged 24 to 74 years (Michaelsson et al., 1995). The relationship between iron and OC may be explained by the indirect effect of iron on vitamin D. OC is a protein mainly expressed and synthesized during the bone formation phase by osteoblasts. OC undergoes the mineralization process of osteoid (Ducy et al., 1996). Expression of OC mRNA is regulated by the active form of vitamin D, 1,25(OH)2D3. Hence, the activity of this iron-dependent enzymes might be decreased resulting in bone loss in IDA. In this case decreased in serum 1,25(OH)2D3 due to ID, is possibly reflected as serum OC concentration (Katsumata et al., 2006).
Another important finding in the present study was that serum BsALP levels were significantly higher in the osteoporosis group than the control group. This result is in agreement with a recent study that showed serum alkaline phosphatase (ALP) levels were significantly upregulated in the osteoporosis group compared with normal group (Cheng et al., 2017). In contrast, ALP levels were not changed in other studies on postmenopausal women with osteoporosis (D’Amelio et al., 2008; Okyay et al., 2013). The mechanisms for the role of iron in BsALP is still undefined. However, one possible explanation is through involvement of BsALP in the regulation of hematopoietic stem cells formation in bone marrow (Hager et al., 2009; Zhang et al., 2003) which contributes to the determination in the hemoglobin level (Walkley, 2011).
The present study is the first to address the association between iron and OPN in postmenopausal women. The study showed that iron was significantly associated with OPN in all subjects. The mechanisim behind the assossiation between iron homeostasis and OPN is currently not clear. A study has been investigated Opn knockout (Opn−/−) mice concluded that deletion of Opn inhanced mobilization of proliferation pluripotent hematopoietic stem cells and iron deposition in the liver (Magdaleno et al., 2018).
There were significant associations between vitamin D and bone markers (BsALP, β-crosslap and OPG). Vitamin D was inversely assossiated with BsALP in all participants as well as in and osteoporosis group. This result is similar to the research by Park et al., (2018) where they observed an inverse association between total 25(OH)D and 25(OH)D3 with ALP. In contrast, another previous study (Lodh et al., 2015) suggested that vitamin D was positively correlated with ALP. Vitamin D was also found to be positively assossiated with β-crosslap. This result was in agreement with that reported by Park et al., (2018) while it disagreed with that reported by Lee et al., (2017), which showed an inverse assossiation between vitamin D and β-crosslap (Lee et al., 2017; Park et al., 2018). The effects of vitamin D on bone turnover markers appears to be through the vitamin D receptors (VDR) in the condition of VDD. VDR has a role in modulating of bone turnover process (Jurutka et al., 2007). VDD may be closely correlated to disrupt normal levels of calcium-phosphorus leading to decrease in collagen mineralization in bone matrix (Di Monaco et al., 2011).
The present study also showed that a significant inverse association between vitamin D and OPG. This results finds supports from previous reports (Gulseren et al., 2011; Karadag-Saygi et al., 2011) that showed significantly reduced OPG levels after treatment with calcium and vitamin D. In contrast, some studies showed a significant increase (Dundar et al., 2009; Marini et al., 2008) and others, no change (Stuss et al., 2016). The observed correlation between vitamin D and OPG might be through RANKL/OPG regulatory system to induce osteoclastogenesis in bone remodeling process. 1,25(OH)2D3 induces expression of osteoblasts which consequently enhances osteoclastogenesis (Takahashi, 2013).
This study has some limitations. The sample size maybe adequate but still relatively small compared to other studies. Furthermore, other important iron biomarkers were not measured such as ferritin, hepcidin, and iron binding proteins, amongst others. The results of the present study could also be affected by dietary iron and 25(OH)D supplementation intake among participants. In spite of its limitations, the current study adds more understanding of iron and 25(OH)D metabolism among Arab postmenopausal women as shown by the significant associations with select biomarkers. Not withstanding these limitations, this study includes several bone biomarkers not found in previous studies done in the same population. Further investigations on a larger scale are needed to confirm present findings.
5 Conclusions
In conclusion, the study found no association between vitamin D and iron in postmenopausal Arab women with osteoporosis. The significant associations between iron and select bone markers suggest that serum iron may influence bone remodeling. The significant associations between vitamin D with select bone biomarkers confirm previous observations and reinforces the role of vitamin D in bone metabolism as well as in osteoporosis.
Funding
The authors are grateful to the Researchers Supporting Project (RSP-2020/21) in King Saud University in Riyadh, Saudi Arabia for their support.
Declaration of Competing Interest
The authors declare that they have no known competing financial interests or personal relationships that could have appeared to influence the work reported in this paper.
References
- Influence of bone mineral density in circulating adipokines among postmenopausal Arab women. Saudi J. Biol. Sci.. 2020;27(1):374-379.
- [CrossRef] [Google Scholar]
- Diagnosis and management of osteoporosis in postmenopausal women in Gulf Cooperation Council (GCC) countries: consensus statement of the GCC countries' osteoporosis societies under the auspices of the European Society for Clinical and Economic Aspects of Osteoporosis and Osteoarthritis (ESCEO) Arch. Osteoporos.. 2020;15(1):109.
- [CrossRef] [Google Scholar]
- Diagnosis and management of vitamin D deficiency in the Gulf Cooperative Council (GCC) countries: an expert consensus summary statement from the GCC vitamin D advisory board. Arch. Osteoporos.. 2020;15(1):35.
- [CrossRef] [Google Scholar]
- Cheng, Q., Zhang, X., Jiang, J., Zhao, G., Wang, Y., Xu, Y., Xu, X., Ma, H., 2017. Postmenopausal Iron Overload Exacerbated Bone Loss by Promoting the Degradation of Type I Collagen. Biomed Res. Int. 2017.
- Role of iron metabolism and oxidative damage in postmenopausal bone loss. Bone. 2008;43:1010-1015.
- [CrossRef] [Google Scholar]
- Low levels of 25-hydroxyvitamin D are associated with the occurrence of concomitant upper limb fractures in older women who sustain a fall-related fracture of the hip. Maturitas. 2011;68:79-82.
- [Google Scholar]
- Increased bone formation in osteocalcin-deficient mice. Nature. 1996;382:448-452.
- [CrossRef] [Google Scholar]
- The effect of risedronate treatment on serum cytokines in postmenopausal osteoporosis: a 6-month randomized and controlled study. J. Bone Miner. Metab.. 2009;27:464-470.
- [Google Scholar]
- Use of bone turnover markers in postmenopausal osteoporosis. Lancet Diab. Endocrinol.. 2017;5(11):908-923.
- [CrossRef] [Google Scholar]
- Evaluation of weekly risedronate treatment in postmenopausal women with osteoprotegerin. Panminerva Med.. 2011;53:75-80.
- [Google Scholar]
- Up-regulation of alkaline phosphatase expression in human primary osteoblasts by cocultivation with primary endothelial cells is mediated by p38 mitogen–activated protein kinase–dependent mRNA stabilization. Tissue Eng. Part A. 2009;15:3437-3447.
- [Google Scholar]
- The prevalence of micronutrient deficiencies and inadequacies in the Middle East and Approaches to interventions. Nutrients. 2017;9(3):229.
- [CrossRef] [Google Scholar]
- Vitamin D receptor: key roles in bone mineral pathophysiology, molecular mechanism of action, and novel nutritional ligands. J. Bone Min. Res. 2007;22:V2-V10.
- [Google Scholar]
- Kanis, J. a, 2007. Assessment of osteoporosis at the primary health care level. World Health.
- The effect of risedronate treatment on serum osteoprotegerin and bone marker levels in postmenopausal women with osteoporosis. Gynecol. Endocrinol.. 2011;27:1033-1036.
- [Google Scholar]
- Dietary iron deficiency decreases serum osteocalcin concentration and bone mineral density in rats. Biosci. Biotechnol. Biochem.. 2006;70:2547-2550.
- [CrossRef] [Google Scholar]
- Serum 25-hydroxyvitamin D cutoffs for functional bone measures in postmenopausal osteoporosis. Osteoporos. Int.. 2017;28:1377-1384.
- [Google Scholar]
- Assessment of vitamin D status in patients of chronic low back pain of unknown etiology. Indian J. Clin. Biochem.. 2015;30:174-179.
- [Google Scholar]
- Osteopontin deletion drives hematopoietic stem cell mobilization to the liver and increases hepatic iron contributing to alcoholic liver disease. Hepatol. Commun.. 2018;2:84-98.
- [Google Scholar]
- OPG and sRANKL serum concentrations in osteopenic, postmenopausal women after 2-year genistein administration. J Bone Min. Res. 2008;23:715-720.
- [Google Scholar]
- Vitamin D supplementation modestly reduces serum iron indices of healthy arab adolescents. Nutrients. 2018;10(12):1870.
- [CrossRef] [Google Scholar]
- The association between iron and vitamin D status in Arab adolescents. Public Health Nutr.. 2020;23(7):1208-1213.
- [CrossRef] [Google Scholar]
- Worldwide prevalence of anaemia, WHO vitamin and mineral nutrition information system, 1993–2005. Public Health Nutr.. 2009;12:40.
- [CrossRef] [Google Scholar]
- Diet, bone mass, and osteocalcin: a cross-sectional study. Calcif. Tissue Int.. 1995;57:86-93.
- [Google Scholar]
- Comparative evaluation of serum levels of main minerals and postmenopausal osteoporosis. Maturitas. 2013;76:320-325.
- [Google Scholar]
- The level of vitamin D using the LC–MS/MS method and related factors in healthy Korean postmenopausal women. J. Obstet. Gynaecol. Res.. 2018;44:1977-1984.
- [Google Scholar]
- An epidemiological analysis of the incidence of osteoporosis and osteoporosis-related fractures among the Saudi Arabian population. Ann. Saudi Med.. 2012;32:637.
- [Google Scholar]
- Guidelines for the Use of Iron Supplements to Prevent and Treat Iron Deficiency Anemia. DC: Ilsi Press Washington; 1998.
- Assessment of OPG, RANKL, bone turnover markers serum levels and BMD after treatment with strontium ranelate and ibandronate in patients with postmenopausal osteoporosis. Endokrynol. Pol.. 2016;67:174-184.
- [Google Scholar]
- Mechanism of inhibitory action of Eldecalcitol, an active vitamin D analog, on bone resorption in vivo. J. Steroid Biochem. Mol. Biol.. 2013;136:171-174.
- [Google Scholar]
- Vitamin D status is inversely associated with anemia and serum erythropoietin during pregnancy, 2. Am. J. Clin. Nutr.. 2015;102:1088-1095.
- [Google Scholar]
- Mechanism of the prolyl hydroxylase reaction. 1. Role of co-substrates. Eur. J. Biochem.. 1977;80:341-348.
- [Google Scholar]
- Metabolic syndrome in arab adults with low bone mineral density. Nutrients. 2019;11(6):1405.
- [CrossRef] [Google Scholar]
- Erythropoiesis, anemia and the bone marrow microenvironment. Int. J. Hematol.. 2011;93:10-13.
- [Google Scholar]
- Identification of the haematopoietic stem cell niche and control of the niche size. Nature. 2003;425:836.
- [Google Scholar]


