

Translate this page into:
Serum asprosin levels are associated with obesity and insulin resistance in Arab adults
⁎Corresponding author at: Biochemistry Department, College of Science, King Saud University, PO Box, 2455, Riyadh 11451, Saudi Arabia. ndaghri@ksu.edu.sa (Nasser M. Al-Daghri)
-
Received: ,
Accepted: ,
This article was originally published by Elsevier and was migrated to Scientific Scholar after the change of Publisher.
Peer review under responsibility of King Saud University.
Abstract
Background
Asprosin, a novel adipokine, has been implicated in glucose regulation, insulin production, and appetite stimulation. Hence, the current study explores circulating asprosin levels and their associations with insulin resistance (IR) and other parameters in obese and type 2 diabetes mellitus (T2DM) Saudi subjects.
Methods
A total of N = 291 (89 control, 105 T2DM/obese and 97 obese) subjects were included in this cross-sectional study. Fasting glucose and lipid profiles were measured routinely. Adiponectin, leptin, C-reactive protein (CRP), tumor necrosis factor-alpha (TNF-α), interleukin (IL)-6, IL-1, and asprosin were measured using commercially available assays.
Results
Serum asprosin levels were found to be significantly highest in obese subjects [3.7 ng/ml (2.6–5.0)] than T2DM/obese [0.1 ng/ml (0.0–0.4)] and controls [0.2 ng/ml (0.1–0.3)] (p < 0.001). In the T2DM/obese group, users of metformin alone or in combination had significantly lower asprosin levels than those whose medication history was unknown [0.03 ng/ml (0.02–0.05) versus 0.2 ng/ml (0.1–0.4); p < 0.001]. Stepwise multiple linear regression analysis revealed that only glucose, insulin and adiponectin were the most important predictors of asprosin, explaining 61.3% (p < 0.001) of the variances perceived.
Conclusion
Asprosin levels are associated with markers of IR independent of adiposity and inflammation and are influenced by oral hypoglycemics, particularly metformin.
Keywords
Asprosin
Obesity
Insulin resistance
Biomarker
Saudi

- FBN
-
Fibrillin
- HOMA-IR
-
Homeostasis model assessment of Insulin Resistance
- BMI
-
Body Mass index
- T2DM
-
Type 2 diabetes mellitus
- ANCOVA
-
Analysis of co-variance
Abbreviations
1 Introduction
Obesity and diabetes are both multifactorial global epidemics of significant concern and are associated with several macro-and microvascular health disorders, including type 2 diabetes mellitus (T2DM), dyslipidemia, hypertension, and increased visceral adiposity (Han et al., 2017). The unhealthy changes in lifestyle patterns and dietary shifts to highly processed foods in industrialized countries have led to a significant increase in the incidence of obesity which poses a significant public health burden (Hruby and Hu, 2015). Excessive accumulation of adipose tissue in morbid obesity compromises the balance of pro-and anti-inflammatory adipokines secretion, leading to hyperinsulinemia, insulin resistance, and other obesity-related disorders (Czech, 2017).
Insulin resistance (IR) is characterized by decreased glucose absorption in the body to physiologically available insulin levels and can potentiate an array of glucose metabolic and cardiovascular disorders such as impaired glucose tolerance, impaired fasting glucose, and T2DM in both children and adults (Di Pino and Defronzo, 2019).
Asprosin is a centrally acting orexigenic novel hormone recently discovered through neonatal progeroid syndrome, commonly expressed in mature white adipose tissues (Romere et al., 2016). There is a growing interest in asprosin, as recent studies have reported the asprosin influence and regulation on the central nervous system and various other organs. It showed a significant effect on the different signaling pathways of these organs and showed an impact on glucose homeostasis, IR, satiety, and β-cells apoptosis (Duerrschmid et al., 2017; Jung et al., 2019; Lee et al., 2019; Zhang et al., 2019a; Zhang et al., 2019b).
Fibrillin 1 gene (FBN1)-encoded, fasting-induced asprosin targets the liver and facilitates the release of hepatic glucose via the G protein-cAMP-PKA pathway leads to elevated plasma glucose and insulin levels (Duerrschmid et al., 2017; Greenhill, 2016; Romere et al., 2016). During fasting, adipose tissues secrete asprosin, which is recruited to the liver and induces hepatic glucose release into the bloodstream to support and sustain the brain and other organs. Serum asprosin levels rise and decrease acutely with refeeding, indicating circadian rhythm with the dietary state (Duerrschmid et al., 2017; Romere et al., 2016). While much of the clinical and preclinical studies on asprosin revolved around obesity and obesity-related diseases, it is important to acknowledge that asprosin has multifunctional pleiotropic actions, similar to other adipokines since its receptors are located in other tissues such as hepatic, renal, muscle and reproductive tissues (Mazur-Bialy, 2020; Shabir et al., 2021). Furthermore, more studies are needed coming from understudied populations to determine whether the observed actions and associations of asprosin with cardiometabolic indices are consistent, or affected by other variables such as ethnicity.
Hence, the rationale of the current study was to assess serum circulatory asprosin levels and identify the association between serum asprosin levels with IR in addition to other serological parameters in a homogenous Arab population with varying degrees of adiposity and IR.
2 Materials and Methods
2.1 Study design
A total of 291 (89 control, 105 T2DM, 97 obese) subjects were randomly selected from the master database of the Chair for Biomarkers of Chronic Diseases (CBCD) in King Saud University (KSU), Riyadh, Saudi Arabia. In brief, this database contains clinical information with serum samples of more than 10,000 children and Saudis (Riyadh Cohort) from various primary health care clinics (PHCCs) in Riyadh, Kingdom of Saudi Arabia (KSA) (Al-Daghri et al., 2014a; Al-Daghri et al., 2014b; Al-Daghri et al., 2015), which was done in cooperation with CBCD and the Ministry of Health (MoH). Participants were asked to fill a generalized questionnaire containing information on demographics and present/past medical history. Ethical approval was granted by the Institutional Review Board (IRB) of the College of Medicine, King Saud University in Riyadh, KSA (IRB No. E-20–5410, approved last November 15, 2020). Prior to enrollment, oral and written informed consent was obtained from all participants to use their collected data and samples.
2.2 Exclusion criteria
Subjects with acute infection, other types of diabetes or with diabetic foot, pregnant women, or subjects with chronic medical illness were excluded from this study. Subjects with acute cardiovascular/cerebrovascular diseases and severely impaired liver/renal function were also excluded.
2.3 Anthropometry and blood sampling
Anthropometric information extracted from the database included weight, height, waist and hip circumference, and mean diastolic and systolic blood pressure. Body mass index (BMI) values were calculated (kg/m2). About 5 mL of fasting venous blood samples were withdrawn from each participant, and serum was isolated. The isolated serum samples were then transported to CBCD laboratory in KSU, Riyadh, KSA, in specialized containers for the serological assessment and stored at − 80 °C until further use (Al-Daghri et al., 2014; Al-Daghri et al., 2015).
2.4 Biochemical assessment
Fasting glucose levels and lipid profiles (total cholesterol, triglycerides, high-density lipoprotein (HDL), were measured by using a biochemical analyzer (Konelab, Espoo, Finland). Serum asprosin levels (ng/mL) were estimated by using commercially available enzyme-linked immune sorbent assay (Abbexa, UK, catalog: abx257694) intra- and inter-assay with co-efficient of variation was < 10% <12%, respectively; and the test range was 0.156 ng/ml-10 ng/ml. Serum insulin was measured using a 1-step chemiluminescence sandwich assay (LIAISON/DiaSorin, Saluggia, Italy), and the detection range was 0-500µIU/mL. Whereas adiponectin, resistin, leptin, TNF-α, IL-6, and IL-1β were analyzed using the Milliplex Map (Millipore, Billerica, MA, USA) in the FlexMap 3D (Luminexcorp, TX, USA) as described in our previous study (Ansari et al., 2020). Detection ranges for various biochemical parameters are as follows: (Adiponectin: 26–400,000 pg/mL, resistin 6.4–100,000 pg/mL, leptin: 38–600,000 pg/mL, TNF-α: 0.64–10,000 pg/mL, IL-6: 0.96–15,000 pg/mL, and IL-1β: 1.3–20,000 pg/mL). To minimize/avoid inter-assay variability, all parameters were measured concurrently in duplicates.
2.5 Homeostasis model assessment of insulin resistance (HOMA-IR) index
HOMA-IR index was used to assess the status of IR and calculated as HOMA-IR = fasting insulin (mU/L) × FG (mmol/L)/22.5 (Matthews et al., 1985).
2.6 Statistical analysis
Zhang et al. have reported a significant difference in asprosin levels in non-T2DM and T2DM subjects with an effect size of 0.81. Based on the significant difference in asprosin level reported by Zhang et al., the required sample size is 87 in each group with the effect size of 0.55 at a 5% level of significance and 95% power (Zhang et al., 2020). The level of significance was set at < 0.05. Post-hoc Bonferroni yielded an over-all effect size of 0.687 and a power of 0.99.
SPSS (version 22 Chicago, IL USA) software was used to do the statistical analysis. For normal variables, continuous data were presented as mean ± standard deviation (SD), whereas; the median (1st and 3rd) percentile was used to represent non-Gaussian variables. Categorical data were presented as frequencies and percentages (%). Prior to the parametric analysis, non-Gaussian variables were log-transformed. ANOVA and Kruskal-Wallis H tests were performed to compare mean differences in Gaussian and Non-Gaussian variables. Pearson’s and Spearman correlation analysis was applied to check the correlations between variables. Analysis of co-variance was used (ANCOVA) to adjust for age. Difference in asprosin levels of those on metformin versus non-metformin users were plotted as means and standard error (SE).
3 Results
General clinical and anthropometric characteristics of the participant were illustrated in Table 1. The T2DM/obese group was significantly older than the control and obese groups (p < 0.001). The mean BMI of the control group was significantly lower than that of the T2DM/obese and obese groups (p < 0.001). As expected, the metabolic profile of the T2DM/obese group was significantly worse as compared to the controls and the obese group (Table 1). In the T2DM/obese group, medications were recorded only in 48 (46%) participants, the majority of whom were either on metformin alone or in combination with other T2DM meds. Note: Data presented as mean ± SD for normal variables while the median (1st quartile – 3rd quartile) for non-normal variables; # indicates non-normal variables, *p-values adjusted for age; Superscripts A & B indicate significance from control and T2DM/Obese. Significant at p < 0.05. BP: blood pressure, T.chol: Total cholesterol, HDL: High-density lipoprotein, LDL: Low-density lipoprotein, TG: Triglycerides, IL: Interleukin, TNF-α: Tumor necrosis factor-alpha.
Parameters
Control
T2DM/Obese
Obese
P-values
P-values*
N
89
105
97
Age (years)
38.7 ± 13.9
49.3 ± 10.9A
39.8 ± 10.7B
<0.001
Female/Male
44/45
59/46
53/44
0.62
0.62
T2DM Meds
Metformin
--
34 (32.4)
--
Metformin + Others
--
14 (13.3)
--
BMI (kg/m2)
21.9 ± 2.5
34.6 ± 3.6 A
35.8 ± 4.2 A
<0.001
<0.01
Waist (cm)
81.5 ± 9.7
104.3 ± 14.4A
103.8 ± 14.3A
<0.001
<0.01
WHR
0.89 ± 0.11
0.95 ± 0.10A
0.90 ± 0.11B
<0.001
0.01
Systolic BP (mmHg)
113.6 ± 12.8
129.3 ± 12.3A
121.4 ± 11.1AB
<0.001
<0.01
Diastolic BP (mmHg)
74.0 ± 6.5
82.2 ± 7.1 A
78.3 ± 6.2AB
<0.001
<0.01
T.Chol (mmol/l)
4.6 ± 1.0
5.5 ± 1.6 A
5.0 ± 1.1B
<0.001
0.01
HDL-Chol (mmol/l)
1.1 ± 0.30
0.96 ± 0.34A
1.0 ± 0.26
0.004
0.02
LDL-Chol (mmol/l)
2.9 ± 0.9
3.3 ± 1.3 A
3.1 ± 0.9
0.027
0.03
Triglycerides (mmol/l) #
1.2 (0.8–1.7)
2.1 (1.6–3.4) A
1.5 (1.0–2.4) AB
<0.001
<0.01
Adiponectin (ug/ml) #
104.4 (28.6–160.0)
22.8 (8.1–51.0) A
38.2 (25.2–119.5)
<0.001
<0.01
Resistin (ng/ml) #
61.9 (38.3–116.9)
62.5 (32.2–97.3)
94.8 (66.1–167.4)
0.142
0.07
IL-6 (pg/ml) #
1.64 (0.82–2.0)
1.92 (1.90–1.94)
1.05 (0.82–1.92)
0.561
1.00
Leptin (ng/ml) #
51.9 (44.8–86.5)
66.4 (47.0–90.8)
53.5 (44.7–80.9)
0.715
0.78
TNF-α (pg/ml) #
482 (269–501)
432 (291–546)
451 (275–517)
0.717
0.69
IL-1β (pg/ml) #
714 (598–1144)
845 (611–1057)
777 (601–1115)
0.872
0.61
Glucose (mmol/l) #
4.8 (4.4–5.1)
10.5 (8.1–14.0) A
5.0 (4.6–5.3) B
<0.001
<0.01
Insulin (µIUmL) #
3.7 (1.8–6.6)
13.5 (6.0–31.5) A
9.1 (4.1–14.5) AB
<0.001
<0.01
HOMA-IR #
0.8 (0.4–1.6)
6.7 (2.6–14.6) A
2.0 (1.0–3.5) AB
<0.001
<0.01
Asprosin (ng/mL) #
0.3 (0.1–0.3)
0.2 (0.01–0.4)
3.7 (2.6–5.0) AB
<0.001
<0.01
Table 2 shows the bivariate associations of asprosin with other serological parameters. In all subjects, serum asprosin levels showed a significant positive correlation with BMI (r = 0.22, p < 0.01), whereas with glucose it was inversely associated (r = -0.37, p < 0.01). Furthermore, it was positively associated with adiponectin and resistin in control and T2DM/obese groups (r = 0.33, p < 0.01 and r = 0.56, p < 0.01), (r = 0.46, p < 0.01, r = 0.42, p < 0.01). Serum asprosin levels in obese subjects did not correlate with TG, adiponectin, resistin, IL6, leptin, TNF-α, glucose-insulin, and HOMA-IR. In contrast, a positive correlation was observed between control and T2DM/obese groups (r = -0.37, p < 0.01, r = -0.18, p < 0.01 and r = -0.25, p < 0.01). Note: Data presented as Spearman correlation coefficient (R), * & ** indicates significance at 0.05 and 0.01 level. BMI: Body Mass Index, WHR: Waist Hip Ratio, BP: T.chol: Total cholesterol, HDL: High-density lipoprotein, LDL: Low-density lipoprotein, TG: Triglycerides, IL: Interleukin, TNF-α: Tumor necrosis factor-alpha.
Parameters
All
Control
T2DM/Obese
Obese
Age (years)
−0.08
0.14
0.1
0.14
BMI (kg/m2)
0.22**
−0.11
−0.17
0.02
Waist
0.05
0.05
−0.15
−0.12
WHR
−0.18**
0.13
−0.2
−0.06
Systolic BP (mmHg)
−0.1
0.05
−0.05
0.28*
Diastolic PB (mmHg)
−0.1
−0.07
−0.01
0.22
T.Chol (mmol/l)
−0.01
−0.03
0.01
0.14
HDL-Chol (mmol/l)
0.08
0.08
0.04
−0.27*
LDL-Chol (mmol/l)
0.04
0
0.03
0.14
Triglycerides (mmol/l) #
−0.13*
−0.07
−0.06
0.13
Adiponectin (ug/ml) #
0.44**
0.33**
0.56**
−0.23
Resistin (ng/ml) #
0.44**
0.46**
0.42**
−0.19
IL-6 (ng/ml) #
−0.13
0.11
−0.15
−0.11
Leptin (ng/ml) #
0.05
0.07
0.01
0.08
TNF-α (pg/ml) #
0.08
0.09
0.13
0
IL-1β (pg/ml) #
−0.06
−0.07
−0.06
0.11
Glucose (mmol/l) #
−0.37**
−0.22*
−0.32**
0.13
Insulin (µIUmL) #
−0.18**
−0.26*
−0.32**
0.21
HOMA-IR #
−0.25**
−0.32**
−0.31**
0.23
As shown in Table 3, the serum levels of asprosin were positively correlated with BMI, adiponectin, and resistin in females (r = 0.23, p < 0.01). A significant inverse correlation between glucose (r = -0.40, p < 0.001), insulin (r = -0.22, p < 0.01) and HOMA-IR (r = -0.28, p < 0.01) were observed. The rest of the parameters were not associated with asprosin. In males, there was a significant positive correlation between adiponectin and resistin with levels of asprosin (r = 0.39, p < 0.01), (r = 0.46, p < 0.01). Both glucose and HOMA-IR showed a significant inverse correlation with asprosin concentrations and no significant correlation with BMI, lipid profile, and leptin. Note: Data presented as coefficient (R), * & ** indicates significance at 0.05 and 0.01 level, respectively. BMI: Body Mass Index, WHR: Waist Hip Ratio, SBP: Systolic blood pressure, DBP: Diastolic blood pressure, T.Chol: Total cholesterol, HDL: High-density lipoprotein, LDL: Low-density lipoprotein, TG: Triglycerides, Adipo: Adiponectin, IL: Interleukin, TNF-α: Tumor necrosis factor-alpha.
Parameters
All
Control
T2DM
Obese
F
M
F
M
F
M
F
M
N
156
135
44
45
59
46
53
44
Age (Years)
−0.16
0.02
0.28
0.05
−0.12
0.27
0.14
0.02
BMI (kg/m2)
0.23**
0.18
−0.14
−0.09
−0.21
−0.09
0.00
0.22
Waist
0.08
0.05
0.10
−0.01
−0.14
−0.05
−0.21
−0.01
WHR
−0.15
−0.06
0.27
0.10
−0.26
0.10
−0.14
−0.17
SBP (mmHg)
−0.05
−0.09
0.16
−0.15
−0.09
0.01
0.31*
0.09
DBP (mmHg)
−0.04
−0.07
0.11
−0.22
−0.10
0.13
0.17
0.34
T.Chol (mmol/l)
−0.03
0.05
−0.16
0.12
0.08
−0.08
0.13
0.16
HDL (mmol/l)
0.08
0.01
0.20
−0.02
0.17
−0.09
−0.21
−0.09
LDL (mmol/l)
0.02
0.07
−0.20
0.18
0.13
−0.14
0.14
0.14
TG (mmol/l)
−0.11
−0.08
−0.13
−0.04
−0.11
0.01
−0.02
0.34
Adipo (pg/ml)
0.46**
0.39**
0.50**
0.15
0.51**
0.65**
−0.03
−0.13
Resistin (pg/ml)
0.41**
0.46**
0.43*
0.45*
0.33*
0.54**
−0.13
−0.11
IL6 (pg/ml)
−0.15
−0.11
0.12
0.09
−0.16
−0.11
−0.12
−0.08
Leptin (pg/ml)
0.06
0.04
0.07
0.06
0.02
0.01
0.09
0.06
TNF-α (pg/ml)
0.09
0.06
0.10
0.07
0.14
0.07
0.01
0.01
IL-1β (pg/ml)
−0.08
−0.04
−0.09
−0.05
−0.07
−0.03
0.12
0.06
Glucose (mmol/l)
−0.40**
−0.29**
−0.23
−0.21
−0.42**
−0.12
0.15
0.02
Insulin (µU/ml)
−0.22*
−0.11
−0.38*
−0.19
−0.34*
−0.28
0.06
0.24
HOMAIR
−0.28**
−0.21*
−0.40*
−0.29
−0.34*
−0.28
0.10
0.20
As intake of oral hypoglycemics was available in 46% of participants in the T2DM/obese group, differences in circulating asprosin levels among those on metformin and those whose medications were unknown were compared in a sub-analysis (Fig. 1). Confirmed metformin users, whether as a monotherapy or in combination, had significantly lower asprosin levels than non-metformin users but on other T2Dm medications (p < 0.001). Adjustments for age and BMI were not done since no differences were seen in the stratified groups.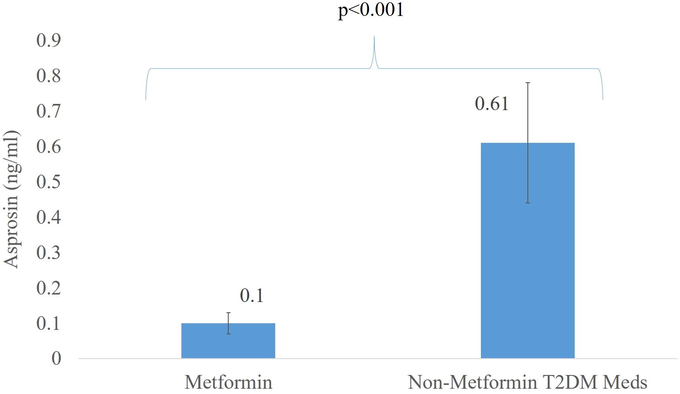
Significant difference in Asprosin levels of age- and BMI-matched T2DM/obese participants on metformin versus other T2DM medications.
Lastly, Table 4 shows the multiple linear regression analysis using asprosin as a dependent variable as age, BMI, systolic BP, HDL, adiponectin, resistin, glucose, and insulin as independent variables in the T2DM and obese group. Results indicated that 60.5% variation in log asprosin could be explained by this set of independent variables. Furthermore, glucose and insulin were independently and inversely associated with asprosin, while adiponectin was independently and positively associated with asprosin. Backward stepwise regression was also conducted with the same set of variables, which resulted in the inclusion of only glucose, insulin, and adiponectin as the most important predictors of asprosin with an adjusted R-square of 61.3%.
Parameters
MLR
Stepwise-MLR
B ± SE
P-value
B ± SE
P-value
Age (years)
0.0 ± 0.0
0.29
BMI (kg/m2)
0.0 ± 0.0
0.96
Systolic BP (mmHg)
0.0 ± 0.0
0.24
HDL cholesterol (mmol/l)
−0.04 ± 0.06
0.45
Adiponectin
0.10 ± 0.04
0.02
0.11 ± 0.03
0.001
Resistin
0.02 ± 0.07
0.80
Glucose
−0.83 ± 0.10
0
−0.87 ± 0.10
<0.001
Insulin
−0.16 ± 0.05
0.001
−0.15 ± 0.04
0.001
Adjusted R2
60.50%
61.30%
P-value
<0.001
<0.001
4 Discussion
The current study assessed for the first time the differences and associations of circulating asprosin levels in a homogenous Arab population with varying degrees of obesity and IR. Numerous studies have linked asprosin with different health issues such as polycystic ovarian syndrome (PCOS) (Alan et al., 2019), childhood obesity (Wang et al., 2020), angina pectoris (Acara et al., 2018), glucose dysregulation Wang et al., 2018), and malignancy (Kocaman and Artaş, 2020). Asprosin has also been shown to favorably increase/decrease after exercise (Ko et al., 2019).
Our study found significantly higher serum asprosin levels in obese subjects than controls and T2DM/obese subjects. Yet, BMI was not a significant predictor of asprosin. The pathophysiological function of increased asprosin in obesity remains unclear (Duerrschmid et al., 2017), and findings from other studies are inconsistent. A previous study reported by Wang et al. observed that obese subjects had increased asprosin levels, and these levels significantly decreased after bariatric surgery (Wang et al., 2019). They also speculated that asprosin could have more complex roles than mere modulation of appetite and glucose regulation (Wang et al., 2019). Studies on obese children also showed that asprosin positively correlates with obesity (Sünnetçi Silistre and Hatipoğl, 2020; Wang et al., 2020).
In contrast, Long et al. (Long et al., 2019) reported that asprosin levels were inversely related to BMI and children. The inconsistencies in outcome may be partially due to differences in assays used since the lack of standardization remains a major issue in replicating studies of new biomarkers, or that asprosin’s role is complex and unknown factors need to be accounted for added clarity and reliability (Long et al., 2019). Ugur and Aydin suggested that asprosin could be a novel biomarker for obesity, at least for adults, as their study outcomes showed a parallel increase in asprosin levels with BMI among the underweight, normal, overweight, and obese individuals (Ugur and Aydin, 2019). Another recent study also demonstrated a significant association between BMI and asprosin among newly diagnosed subjects with diabetes (Naiemian et al., 2020). The association of BMI with asprosin, maybe indirect, since BMI’s effects are more apparent in adipokines which can either enhance (e.g., adiponectin) or impair (e.g., resistin, IL-1β and TNF) insulin sensitivity (Andrade-Oliveira et al., 2015; Booth et al., 2016), which, in turn, may influence asprosin levels (Romere et al., 2016).
Correlation analysis in the current study revealed a significant inverse association between circulatory asprosin and fasting glucose, insulin, HOMA-IR, and a positive association with adiponectin and resistin in all except obese subjects. Several adipokines such as adiponectin, resistin, hepcidin, and other inflammatory cytokines, etc., are secreted by adipose tissue that functions systematically (endocrine) and acts locally (autocrine/paracrine) to regulate insulin sensitivity, immune response, cardiovascular function, and many other physiological processes (Andrade-Oliveira et al., 2015). Although numerous studies have reported elevated asprosin levels in T2DM subjects (Wang et al., 2018; Zhang et al., 2019a; Zhang et al., 2019b; Zhang et al., 2020), the present study showed an inverse association with glycemic parameters in T2DM subjects. In contrast, Zhang et al. reported no association between the asprosin levels and parameters of glucose metabolism in participants of both the T2DM and normal glucose tolerance groups (Zhang et al., 2020). The contradictory findings may be attributed to the duration of T2DM as well as medications, as dysregulation of asprosin secretion might be affected by these factors (Zhang et al., 2019a; Zhang et al., 2019b). Another study speculated that, at the onset of T2DM, this dysregulation might intensify and even influence the asprosin response to variation in glucose levels contributing to the compromised relationship in previously diagnosed T2DM subjects between circulatory asprosin levels and glucose metabolism parameters (Zhang et al., 2020).
It has been demonstrated that the effects of asprosin on glucose homeostasis are confined to hepatic production with no significant influence on insulin levels or sensitivity (Hoffmann et al., 2020). In two hyperinsulinemic-euglycemic clamp studies focused on loss and gain of asprosin function, Romere et al. reported no insulin sensitivity change. Moreover, immunologic (anti-asprosin antibody) or genetic loss (NPS mice and patients) of asprosin function was correlated with reduced glucose and insulin (Duerrschmid et al., 2017; Romere et al., 2016).
Adiponectin is the most abundant adipokine that plays a crucial role in obesity- and age-related diseases, with high concentrations being protective against T2DM, insulin resistance, atherosclerosis (Liu et al, 2019). In contrast, its low concentration raises the likelihood of insulin-resistance disorders (Al-Attas et al., 2012; Sabico et al., 2019). In contrast, elevated resistin levels are associated with IR, initiation, and development of T2DM (Emamalipour et al., 2019). Besides, it also shows a connecting link between IR and obesity (Chen et al., 2002). Our results revealed a positive correlation between asprosin levels and adiponectin in T2DM and control subjects, which was consistent with the previous results reported by Weicek et al. (Wiecek et al., 2018). Releasing inflammatory adipokines is associated with the activation of inflammatory pathways that induce insulin action impairment by interfering with insulin signaling, leading to IR (Emamalipour et al., 2019). However, an inverse association was found between asprosin and adiponectin in the subjects diagnosed with non-alcoholic fatty liver disease (Ke et al., 2020). Susceptibility to diabetes is influenced by ethnicity so findings from other studies using other ethnic groups may not necessarily be true for this group.
Lastly, the significantly lower asprosin levels in the T2DM/obese group as compared to the nonT2DM/obese group demonstrated that asprosin is more sensitive to changes in insulin resistance rather than adiposity. This is further confirmed in the stepwise linear regression analysis revealing that the significant predictors of asprosin are known markers of glycemia independent of all parameters, including anthropometry. The non-significant difference in asprosin levels of controls and T2DM/obese can be partially explained by the use of metformin and other oral hypoglycemics, which in the present study showed significantly lower asprosin levels than other T2DM/obese subjects with unknown history of oral hypoglycemic intake. In a recent study by Gozel and Kilinc (Gozel and Kilinc, 2020), newly diagnosed T2DM subjects had significantly higher plasma asprosin levels than controls at baseline independent of BMI. However, a significant decrease in asprosin was observed and levels became immediately comparable to controls within 3 months of metformin treatment. Metformin’s action is primarily to decrease hepatic glucose production, while asprosin promotes it (Gozel and Kilinc, 2020). Orexigenic asprosin exerts its inhibitory effects in proopiomelanocortin- (POMC) (Duerrschmid et al., 2017), while anorexigenic metformin inhibits neuropeptide Y (NPY)/agouti-related protein (AgRP) (Kalsbeek et al., 2020). Both POMC and NPY/AgRP neurons regulate the feeding control center in the hypothalamus (Kalsbeek et al., 2020). The different pathways of metformin and asprosin in the regulation of appetite suggest that metformin use may be inhibitory to asprosin but that the metformin-induced asprosin suppression alone may not affect BMI, given that the functionality of POMC and NPY/AgRP neurons are known to be defective in T2DM (Kalsbeek et al., 2020).
The authors acknowledge certain limitations. The cross-sectional study design cannot prove causality. While the incomplete data on medications in the T2DM/obese group may partially explain the difference between its levels versus the obese group, other factors that affect asprosin such as physical activity, diet and body fat mass which affects asprosin production were missing. Lastly, only a few participants diligently filled out the medications portion of the questionnaire, hence the small sample size in the sub-analysis on metformin These limitations should be strongly considered can in future investigations on asprosin.
5 Conclusions
In conclusion, our findings collectively suggest that asprosin may have a complex function in metabolism but may act as a biomarker in insulin-resistance-related diseases, with particular promise for monitoring response to treatment. The lack of significant associations with inflammatory markers needs further exploration. Further studies are also needed to explore the therapeutic role of asprosin in insulin-resistance-related disorders as well as the effects of different anti-T2DM medications on circulating asprosin levels.
Acknowledgement
The authors are thankful to Mohammad S. Masoud for his technical assistance. The authors would also like to thank the research team from different primary care centers for the recruitment of subjects.
Funding
The authors thank the support of the Researchers Supporting Project (RSP-2021/21) King Saud University, Riyadh, Saudi Arabia.
Declaration of Competing Interest
The authors declare that they have no known competing financial interests or personal relationships that could have appeared to influence the work reported in this paper.
References
- A novel biochemical marker for predicting the severity of ACS with unstable angina pectoris: Asprosin. Am. J. Emerg. Med.. 2018;36(8):1504-1505.
- [CrossRef] [Google Scholar]
- Urinary iodine is associated with insulin resistance in subjects with diabetes mellitus type 2. Exp. Clin. Endocrinol. Diabetes. 2012;120(10):618-622.
- [CrossRef] [Google Scholar]
- Habitual physical activity is associated with circulating irisin in healthy controls but not in subjects with diabetes mellitus type 2. Eur. J. Clin. Invest.. 2015;45(8):775-781.
- [CrossRef] [Google Scholar]
- Assessing the contribution of 38 genetic loci to the risk of type 2 diabetes in the Saudi Arabian Population. Clin Endocrinol (Oxf).. 2014;80(4):532-537.
- [CrossRef] [Google Scholar]
- Asprosin: a novel peptide hormone related to insulin resistance in women with polycystic ovary syndrome. Gynecol. Endocrinol.. 2019;35(3):220-223.
- [CrossRef] [Google Scholar]
- Andrade-Oliveira, V., Câmara, N.O.S., Moraes-Vieira, P.M., 2015. Adipokines as Drug Targets in Diabetes and Underlying Disturbances. https://doi.org/10.1155/2015/681612.
- Influence of bone mineral density in circulating adipokines among postmenopausal Arab women. Saudi J. Biol. Sci.. 2020;27(1):374-379.
- [CrossRef] [Google Scholar]
- Adipose tissue: An endocrine organ playing a role in metabolic regulation. Horm. Mol. Biol. Clin. Investig.. 2016;26:25-42.
- [CrossRef] [Google Scholar]
- Differential dimerization and association among resistin family proteins with implications for functional specificity. J. Endocrinol.. 2002;175:499-504.
- [CrossRef] [Google Scholar]
- Insulin action and resistance in obesity and type 2 diabetes. Nat. Med.. 2017;23(7):804-814.
- [CrossRef] [Google Scholar]
- Insulin resistance and atherosclerosis: implications for insulin-sensitizing agents. Endocr. Rev.. 2019;40:1447-1467.
- [CrossRef] [Google Scholar]
- Asprosin is a centrally acting orexigenic hormone. Nat. Med.. 2017;23(12):1444-1453.
- [CrossRef] [Google Scholar]
- Implications of resistin in type 2 diabetes mellitus and coronary artery disease: Impairing insulin function and inducing pro-inflammatory cytokines. J. Cell. Physiol.. 2019;234(12):21758-21769.
- [CrossRef] [Google Scholar]
- Gozel, N., Kilinc, F., 2020. Original paper Investigation of plasma asprosin and saliva levels in newly diagnosed type 2 diabetes mellitus patients treated with metformin. https://doi.org/10.5603/EP.a2020.0059.
- Greenhill, C., 2016. Liver: Asprosin — new hormone involved in hepatic glucose release. https://doi.org/10.1016/j.cell.2016.02.063.
- Han, C., Liu, Y., Sun, X., Luo, X., Zhang, L., Wang, B., Ren, Y., Zhou, J., Zhao, Y., Zhang, D., Liu, X., Zhang, M., Hu, D., 2017. Prediction of a new body shape index and body adiposity estimator for development of type 2 diabetes mellitus: The Rural Chinese Cohort Study. https://doi.org/10.1017/S0007114517002859.
- Energy regulation mechanism and therapeutic potential of asprosin. Diabetes. 2020;69(4):559-566.
- [CrossRef] [Google Scholar]
- Hruby, A., Hu, F.B., n.d. The Epidemiology of Obesity: A Big Picture. https://doi.org/10.1007/s40273-014-0243-x.
- Asprosin attenuates insulin signaling pathway through PKCδ-activated ER stress and inflammation in skeletal muscle. J. Cell. Physiol.. 2019;234(11):20888-20899.
- [CrossRef] [Google Scholar]
- The impact of antidiabetic treatment on human hypothalamic infundibular neurons and microglia. JCI Insight. 2020;5:1-13.
- [CrossRef] [Google Scholar]
- Combination of asprosin and adiponectin as a novel marker for diagnosing non-alcoholic fatty liver disease. Cytokine. 2020;134:155184.
- [CrossRef] [Google Scholar]
- Aerobic exercise training decreases hepatic asprosin in diabetic rats. J. Clin. Med.. 2019;8:666.
- [CrossRef] [Google Scholar]
- Can novel adipokines, asprosin and meteorin-like, be biomarkers for malignant mesothelioma? Biotech. Histochem.. 2020;95(3):171-175.
- [CrossRef] [Google Scholar]
- Asprosin impairs insulin secretion in response to glucose and viability through TLR4/JNK-mediated inflammation. Mol. Cell. Endocrinol.. 2019;486:96-104.
- [CrossRef] [Google Scholar]
- Examining the potential of developing and implementing use of adiponectin-targeted therapeutics for metabolic and cardiovascular diseases. Front. Endocrinol (Lausanne).. 2019;10:842.
- [CrossRef] [Google Scholar]
- Decreased circulating levels of asprosin in obese children. Horm. Res. Paediatr.. 2019;91(4):271-277.
- [CrossRef] [Google Scholar]
- Homeostasis model assessment: insulin resistance and fl-cell function from fasting plasma glucose and insulin concentrations in man. Diabetologia 1985
- [Google Scholar]
- Asprosin-A fasting-induced glucogenic, and orexigenic adipokine as a new promising player. Will it be a new factor in the treatment of obesity, diabetes, or infertility? A review of the literature. Nutrients. 2021;13(2):620.
- [CrossRef] [Google Scholar]
- Serum concentration of asprosin in new-onset type 2 diabetes. Diabetol. Metab. Syndr.. 2020;12:1-8.
- [CrossRef] [Google Scholar]
- Asprosin, a fasting-induced glucogenic protein hormone. Cell. 2016;165(3):566-579.
- [CrossRef] [Google Scholar]
- Effects of a 6-month multi-strain probiotics supplementation in endotoxemic, inflammatory and cardiometabolic status of T2DM patients: A randomized, double-blind, placebo-controlled trial. Clin. Nutr.. 2019;38(4):1561-1569.
- [CrossRef] [Google Scholar]
- Asprosin, a novel pleiotropic adipokine implicated in fasting and obesity-related cardio-metabolic disease: Comprehensive review of preclinical and clinical evidence. Cytokine Growth Factor Rev.. 2021;60:120-132.
- [CrossRef] [Google Scholar]
- Increased serum circulating asprosin levels in children with obesity. Pediatr. Int.. 2020;62(4):467-476.
- [CrossRef] [Google Scholar]
- Saliva and blood asprosin hormone concentration associated with obesity. Int. J. Endocrinol.. 2019;2019:1-8.
- [CrossRef] [Google Scholar]
- Serum asprosin levels and bariatric surgery outcomes in obese adults. Int. J. Obes.. 2019;43(5):1019-1025.
- [CrossRef] [Google Scholar]
- Serum asprosin concentrations are increased and associated with insulin resistance in children with obesity. Ann. Nutr. Metab.. 2020;75(4):205-212.
- [CrossRef] [Google Scholar]
- Plasma asprosin concentrations are increased in individuals with glucose dysregulation and correlated with insulin resistance and first-phase insulin secretion. Mediators Inflamm.. 2018;2018:1-7.
- [CrossRef] [Google Scholar]
- Acute anaerobic exercise affects the secretion of asprosin, irisin, and other cytokines - A comparison between sexes. Front. Physiol.. 2018;9:1-12.
- [CrossRef] [Google Scholar]
- Circulating asprosin concentrations are increased in type 2 diabetes mellitus and independently associated with fasting glucose and triglyceride. Clin. Chim. Acta. 2019;489:183-188.
- [CrossRef] [Google Scholar]
- Increased serum level and impaired response to glucose fluctuation of asprosin is associated with type 2 diabetes mellitus. J. Diabetes Investig.. 2020;11(2):349-355.
- [CrossRef] [Google Scholar]
- Asprosin improves the survival of mesenchymal stromal cells in myocardial infarction by inhibiting apoptosis via the activated ERK1/2-SOD2 pathway. Life Sci.. 2019;231:116554.
- [CrossRef] [Google Scholar]


