

Translate this page into:
Seismicity of the Neom megaproject area, Northwestern Saudi Arabia
⁎Corresponding author. hsan@KSU.EDU.SA (Hassan Alzahrani)
-
Received: ,
Accepted: ,
This article was originally published by Elsevier and was migrated to Scientific Scholar after the change of Publisher.
Peer review under responsibility of King Saud University.
Abstract
A new seismicity map has been developed for Neom megaproject in the north-western zone of Saudi Arabia which has experienced considerable earthquake activity in the historical and recent times. The data used an up-to-date earthquake (Mw ≥ 3.0) catalog, major structures and tectonic trends. The majority of earthquake epicenters along the Red Sea rift are clustered in an axial trough, as well as on or nearby the active transform faults within the Red Sea basin. These earthquake activities are produced due to to the geodynamic processes such as continental rift and seafloor spreading prevailing in the area. Ten seismotectonic source zones have been identified in the area under investigation. It is indicated that the Gulf of Aqaba and southern end of the Gulf of Suez seismotectonic source zones are the most hazardous zone for Neom megaproject according to the maximum expected magnitudes where Mw are 7.7 and 6.7 respectively. Based on the magnitude-frequency relationship, the b-value varies from 0.41 to 0.934. The highest b values are related to the northwestern coast of the Red Sea, whereas the lowest b-value are related to the Duba source zone. Consequently, damaging earthquakes could affect Neom megaproject, so earthquake hazard assessment is highly recommended for the minimization and mitigation of earthquake losses in this area.
Keywords
Seismicity
Tectonics
Seismotectonic source
Neom megaproject
Saudi Arabia

1 Introduction
Neom megaproject area (Fig. 1) is distinguished by its unique location at the confluence of the continents of Asia and Africa. The region is blessed with a picturesque environment, and biological, topographical and geological diversity, which make it a destination for tourists, whether from inside or outside Saudi Arabia. In that context, the government of Saudi Arabia has initiated a major project to develop a cross-border smart city in Neom, with the project representing a huge cultural, architectural and technological leap towards a bright future for Saudi Arabia. The Neom megaproject has, however, been affected by several earthquakes either, historically (before 1900) and/or instrumentally (from 1900 till Dec. 2020).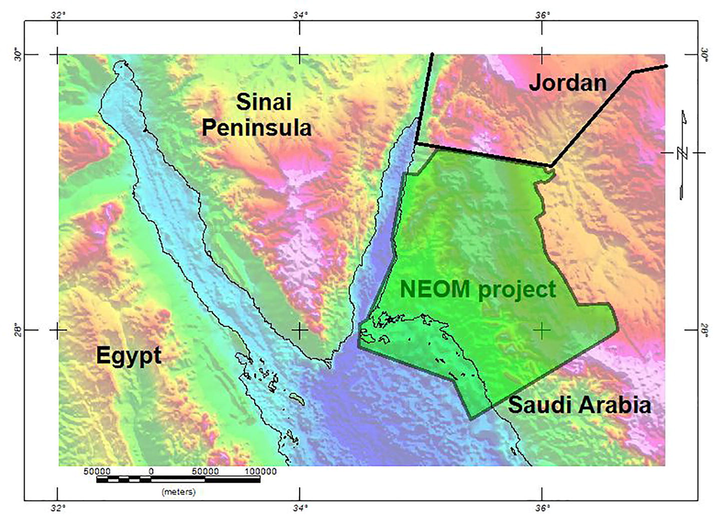
Location Map of Neom study area (modified after Aboud et al., 2019).
Previous earthquake studies for the northern Red Sea have shown high seismicity which is mainly attributed to the presence of the Sinai triple junction (Korrat et al., 2006; Badawy et al., 2008; Al-Amri, 2013; Zahran et al., 2016). Also, rift extensional faults in the southern Gulf of Suez and the juncture with the Gulf of Aqaba have been active from the Quaternary to the present. This is evidenced by continued seismic activity (Daggett et al., 1986; Jackson et al., 1988; Fnais et al., 2015). Furthermore, the northern Red Sea has been studied through analysis of gravity and magnetic data (Saleh and Păsteka, 2012), revealing both the continental-oceanic crust boundary and several shallow listric normal faults spreading on the Red Sea margins in a NW–SE direction, suggesting a NE–SW extension in these regions.
Based on the above-mentioned, and given also the strategic and economic importance of the Neom megaproject of Saudi Arabia, it is important for scholars to understand the tectonic framework so as to be able to assess the potential for earthquake events affecting Neom. This paper contributes to that goal developing a new seismicity map for the Neom megaproject using reviewed and processed earthquake data sets from local, regional and global sources. It is envisaged that this will greatly support the earthquake hazard assessment studies of the area.
2 Geological and tectonic setting
The Red Sea is an NNW–SSE-trending depression about 2000 km long between the Arabian and African plates. An axial trough varying from 30 km in width near 20°N and narrowing southward where it may be 5 to 14 km wide cuts the main trough. The northern end of the Red Sea bifurcates into the Gulf of Suez and the Gulf of Aqaba. The Gulf of Suez is controlled primarily by normal faulting, but the Gulf of Aqaba is controlled by wrench faults. The narrow coastal plains here climb directly into fault-bounded blocks of basement rocks less than 5 to 10 km from the shoreline.
Structurally, three sets of faults seem to have controlled the development of the Red Sea. These were the NW–SE trending main line of faults, which are associated with step faulting and the WNW–ESE major fault trend in the Precambrian basement, which caused many irregularities in the coastline. Besides, there are many NE trending transform faults along the Red Sea rift system (Whiteman, 1971). The NW faults are responsible for the rifting and opening of the Red Sea. They form the structural basins along the coastal zones (Almadani et al., 2015). The occurrence of earthquakes and active volcanisms with the axial trough indicates the present-day rifting (El-Isa and Al Shanti, 1989; Fairhead and Girdler, 1970; Al-Amri, 1995).
At the northern end of the Red Sea (Fig. 2), the active extensional features produced the strike-slip motion along the Gulf of Suez in addition to the sinistral shear along the Gulf of Aqaba–Dead Sea rift system (Ben-Menahem et al., 1976). It is postulated that the depressions were formed by the anticlockwise rotation of Saudi Arabia away from Africa about a pole of rotation in the central or south-central Mediterranean Sea (36.5 N, 18.0 E) (Le Pichon and Gaulier, 1988), and that the Sinai sub-plate has moved relative to both Africa and Arabia. The Suez rift is a slightly arcuate depression extending generally NW (30–40 NW), parallel to the major normal faults. It is 69–80 km wide, and about 500 km long (Steckler et al., 1988).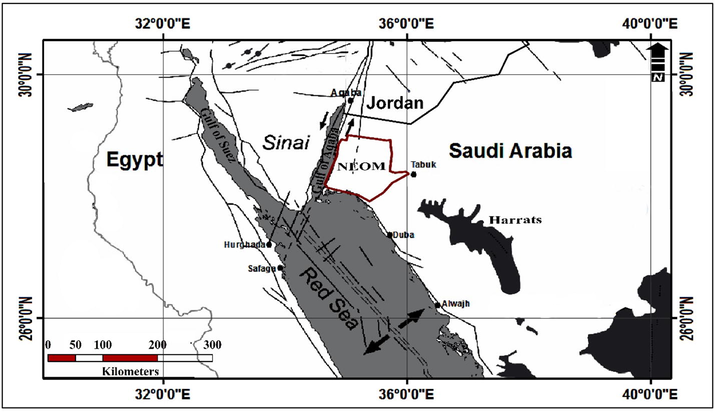
The major structural and tectonic trends affecting Neom megaproject.
3 Seismicity assessment
3.1 Earthquake dataset collection
Earthquake dataset in and around the Neom megaproject has been collected from local, regional and international sources; the Saudi National Seismic Network of the Saudi Geological Survey (SGS); the Seismic Studies Center (SSC) of King Saud University and King Abdul-Aziz City of Science and Technology (KACST); the International Seismological Center (ISC) and the European Mediterranean Seismological Center (EMSC). In addition, regional catalogue of Ambraseys et al. (1994) has been integrated in this study. The collated seismological catalog of earthquake datasets covered the period from January 1900 until December 2020 and served to give an overview of earthquake activities in the study area between longitude 34° to 38° East and latitude 25° to 29° North. These data were then merged and the duplicated events were removed and then carefully reviewed and analyzed.
3.2 Data analysis and results
The catalog analysis was the principal step after collecting all the data from the different seismic networks. A number of programs, including Excel, Grapher, Spread Sheet Compare and ArcGIS, were used to analyze the raw datasets. The initial stage of analysis involved unifying the different magnitudes (MS, MB, ML, MD) into moment magnitude (MW). The trend line fitting approach was used to calculate the inter-relationships and the following conversion equations proposed by Scordilis (2006) were used to modify the different magnitude scales into MW:
Mw = 0.85 Mb + 1.03, 3.5_mb _6.2 σ = 0:29
Mw = 0.67 Ms + 2.07, 3.0_Ms _6.1 σ = 0:17
Mw = 0.99 Ms + 0.08, 6.2_Ms _8.2 σ = 0:20
Where local magnitude (ML) and duration magnitude (MD) were reported, the following conversion equations by Al Kathery (2010) were adopted:
Mw = 0.742 ML + 0.754, σ = 0.042
Mw = 0.843 MD + 0.281, σ = 0.092
Finally, the spatial distribution of the compiled seismicity catalogue was plotted into seismicity maps for the study area (Fig. 3).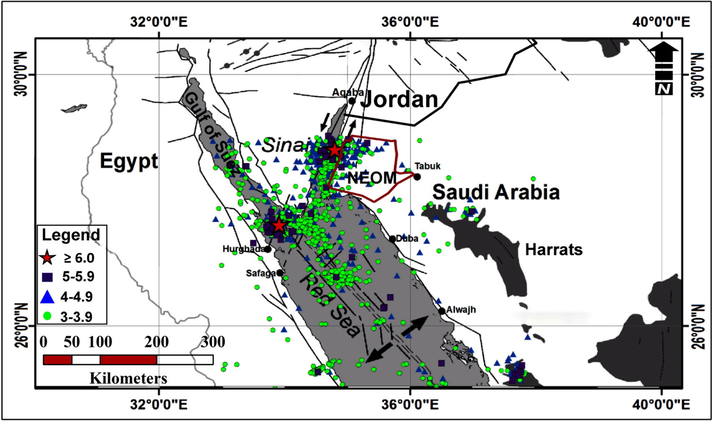
The seismicty map affecting Neom megaproject.
4 Seismotectonic source zones
Seismic hazard analysis depends on the ability to identify and characterize seismic source zones. Seismotectonic zones (Fig. 4) can give good idea about the association between the faults in a specific area and the locations of earthquakes. The earthquakes identified from the datasets collated in this research were therefore plotted against the structural trends using GIS. This allowed the identification of ten seismic source zones in the northern Red Sea area related to recognizable faults and seismically active geologic structures. The Gutenberg-Richter (G-R) relationship was used to describe the regional seismicity for each identified zone. The general G-R relationship between earthquake magnitude and frequency is as follows:
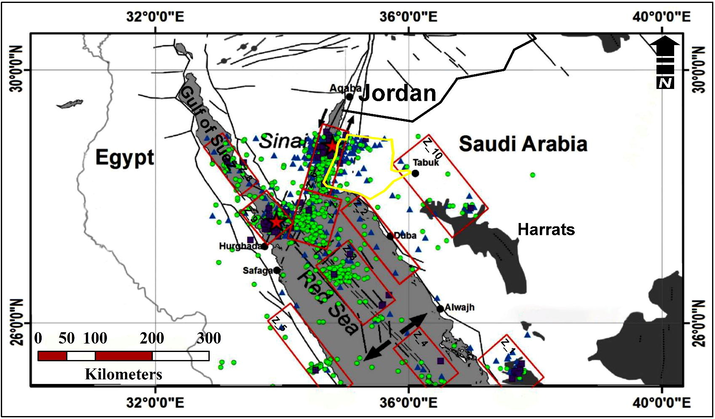
The identified seismotectonc source zones affecting Neom megaproject.
or where N is the number of earthquakes of magnitude ≥ M, a and b are constants, and the logarithms are taken to the base 10; “a” represents the total seismicity rate, while “b” represents the magnitude-frequency distribution. The value of “a” depends on the period of observation, the size of the region considered and the level of seismic activity. Whereas that of “b” depends on the ratio of the number of earthquakes in low – to high magnitude groups. The values of “b” have been reported to range from approximately 0.5 to 1.5, but mostly between 0.7 and 1.0 (Isacks and Oliver, 1968). Nevertheless, many researchers believe that “b” varies from region to region according to the focal depth. In addition, its value depends on the stress conditions and on the heterogeneity of the rock volume generating the earthquakes, (Mogi, 1962).
The relationship between reputed surface length and magnitude was used to calculate the expected magnitude. (L) can be used to estimate the most likely magnitude for a given maximum rupture, but it must be stressed that such an estimate is not maximum magnitude, but rather the magnitude that could be expected to be exceeded in 50% of the earthquakes associated with that rupture length.
M = 5.08 + 1.16·log (L)
Wells and Coppersmith (1994) obtained relationships of average surface displacement and rupture length to magnitude from published reports of documented historical and recent surface ruptures. They found magnitude M and surface rupture length L using data from all types of faults. The maximum magnitude was obtained by adding 0.5 units to the maximum observed magnitude (Kijko, 2004). The resulting seismotectonic zones that may affect the Neom-project area, and their seismicity parameters, are tabularized in Fig. (5a & b) and Table 1. These zones are described below: *Added 0.5 for the maximum observed magnitude (Kijko, 2004).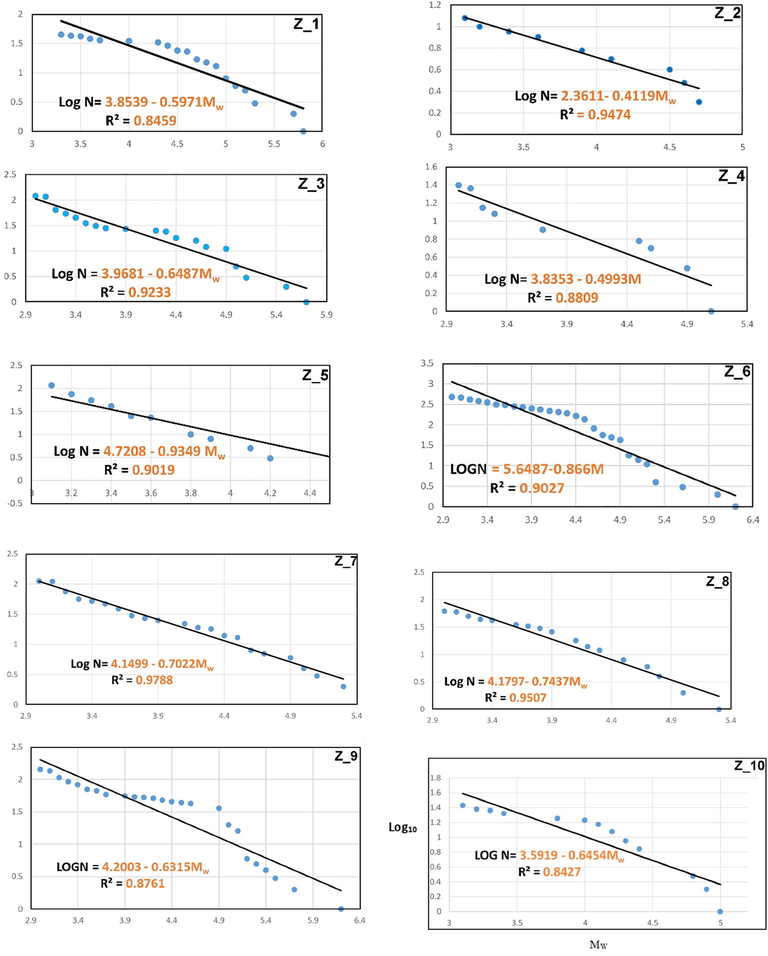
The G-R relationships showing the seismicity parameters a and b values for the identified source zones.
Seismogenic Source Area
Source Zone
Earth. No.
Observed magnitude range
G-R parameters
Mexp.
Mmin
Mmax
a
b
North western Saudi Arabia
Al-Ays
45
3.3
5.8
3.8539
0.5971
6.3
Duba
12
3.1
4.7
2.3611
0.4119
5.2
Tabuk
27
3.1
5.1
3.5919
0.6454
5.6*
Northern Red Sea axial trough
Northern Zone
120
3.0
5.7
3.9681
0.6487
6.2
Northern Zone
25
3.0
5.1
3.8353
0.4993
5.6
North Western coast of Red Sea
Northwestern coast of the Red Sea
116
3.1
5.4
4.7208
0.9349
5.9
Gulf of Aqaba
Gulf of Aqaba
477
3.0
7.2
5.6487
0.866
7.7
Southern end Gulf of Aqaba
112
3.0
5.3
4.1499
0.7022
5.8
Gulf of Suez
Central Gulf of Suez
62
3.0
5.3
4.1797
0.7437
5.8
Southern end Gulf of Suez
143
3.0
6.2
4.2003
0.6315
6.7
4.1 Northwestern Saudi Arabia
On May 19th, 2009 an earthquake with moment magnitude (Mw) of 5.4 earthquake struck the area nearby Al-Ays City in the northwestern Saudi Arabia. This earthquake followed by 19 earthquakes with magnitude higher than M4.0. Besides, more than 34,000 earthquakes were recorded in the northern part of the volcanic sheets of Harrat Lunayyir between April 18th and July 10th, 2009. Some of these earthquakes were felt in areas located more than 200 km away from Harrat Lunayyir. The earthquake swarm has resulted in an 8 km-long surface fault rupture trending NNW-SSE. The origin of the earthquake swarm was caused by magma rising and emplacement of a shallow subsurface dyke (Pallister et al., 2010). In this study, the datasets of Al-Ays zone revealed 45 earthquakes in this source zone with magnitude ranges between 3.3 and 5.8. After applying G-R relationship to deduce the link between earthquake magnitude and frequency, the a-value of was found to be 3.8539 while b-value was 0.5971.
Duba seismotectonic zone occupies the northeastern coastal strip of the Red Sea, where a considerable number of earthquakes occurred parallel to the coast of the Red Sea, which confirms the presence of faults extending along the coastal strip of the Red Sea. Despite the low-moderate magnitudes of these earthquakes, it should be considered during seismicity evaluation of the northwestern Saudi Arabia and especially Neom megaproject. Duba seismotectonic zone includes 12 earthquakes with magnitude ranges between 3.1 and 4.7. After applying G-R and deducing the earthquake relationship which join cumulative earthquake with the magnitude, the a-value was found to be 2.3611 while b-value was 0.4119.
In Tabuk seismotectonic zone, there are number of earthquakes took place in June 2004 approximately 60 km southeast of Tabuk city, Saudi Arabia (Aldamegh et al., 2009). The first felt event (MW = 3.9) occurred on June 9, 2004 and caused minor damage in the epicentral area according to the National Earthquake Information Center (NEIC, USGS) and the local reports. Another moderate size event occurred on June 22 (MW = 5.1) and was followed by a few felt aftershocks without any reported damage. This earthquake sequence caused considerable alarm at Tabuk and highlights the fact that damaging earthquakes can occur in this region away from the major plate boundary in the Red Sea. Focal mechanisms indicate normal faulting mechanisms with two nodal planes-oriented NW–SE in parallel to the faults bounding the Tabuk graben and the Red Sea rift axis (Aldamegh et al., 2009; Xu et al., 2015). These events originated at shallow focal depths of 4–5 km, possibly contributing to the widely felt ground motions.
In this study, the dataset of Tabuk zone includes 27 earthquakes with magnitude ranges between 3.1 and 5.1 After applying G-R and deducing the earthquake relationship which join cumulative earthquake with the magnitude, the a-value was found to be 3.5919 while b-value was 0.6454. This zone follows NW-trending faults that represent the northern extension of the Najd Fault System (NFS). The seismicity of the zone is attributed to the reactivation movement of the preexisting faults. It is characterized by low seismic activity concentrated along Tabuk graben.
4.2 Northern Red Sea axial trough
The seismic activity in the northern Red Sea tends to follow the two different structural trends and the shear zones of the Aqaba-Levant trend and the Gulf of Suez zone (Maamoun et al., 1984). The historical earthquakes that have been felt in the northern Red Sea (2200 BCE to 1899 CE) were compiled by Badawy and Horváth (1999) from the Arabic documents and earlier catalogue. The seismicity of Red Sea axial trough clustered on or near the transform faults of the deep axial trough in consistent with Al-Amri (1994) and supports the interpretation of the magnetic anomalies in terms of seafloor spreading.
In this study, the data for northern Red Sea axial trough zone (1) included 120 earthquakes with magnitude ranges between 3.0 and 5.7. After applying G-R and deducing the earthquake relationship which join cumulative earthquake with the magnitude, the a -value was found to be 3.9681 while b-value was 0.6487. While the northern zone (2) comprises 25 earthquakes with magnitude ranges from 3.0 to 5.1. After applying G-R and deducing the earthquake relationship which join cumulative earthquake with the magnitude, the a -value was found to be 3.8353 while b-value was 0.4993.
4.3 Northwestern coast of the Red Sea
Structurally, northwestern coast of the Red Sea was subjected to different tectonic movements, leading to a complex series of normal faults with different trends, half-grabens, and folds. Khalil and McClay (2002) described extensional fault-related folding in the northwestern Red Sea. The main faults and folds are trending NNW-SSE and NW-SE. Younes and McClay (2002) indicated that the study area is characterized by Precambrian structural features of the Arabo-Nubian shield, which is a system of linear, deep-seated shear zones which were considered left lateral northwest oriented faults and shear zones (Abuzeid, 1988). In this study, total of 116 earthquakes with magnitude ranges between 3.1 and 5.4 have been selected. After applying G-R and deducing the earthquake relationship which connect cumulative earthquake with the magnitude, the a-value was found to be 4.7208 while b –values was 0.9349.
4.4 Gulf of Aqaba
The Aqaba Gulf is considered as an active seismic trend where many destructive earthquakes have been occurred (Maamoun et al., 1984; Salamon et al., 1996; Al-Arifi et al., 2013). This zone encompasses the Gulf of Aqaba and Southern end of Gulf of Aqaba where it extends between 28° and 30.9° N. The earthquakes sequences of this zone mainly characterized by left-lateral strike-slip faulting mechanism along the main axis of the gulf and normal slip along transverse faults. In May 1212, the largest historical earthquake (Mw = 6.7) occurred while the largest instrumental one happened on the November 22, 1995 (Mw = 7.2). Earthquake larger than 6.0 is predictable with an average return period 1000–3000 years according to the paleoseismicity (Shapira and Jarradat, 1995). In this study, the earthquake dataset for Gulf of Aqaba zone comprised 477 earthquakes with magnitude ranges between 3.0 and 6.2. After applying G-R and deducing the earthquake relationship which link cumulative earthquake number with the magnitude, the a -value was found to be 5.6487 while b-value was 0.866. While the southern end of Gulf of Aqaba zone has 112 earthquakes with magnitude ranges between 3.0 and 5.3. After applying G-R and deducing the earthquake relationship which intersect the cumulative earthquakes with the magnitude, the a-value was found to be 4.1499 while b- value was 0.7022.
4.5 Gulf of Suez
The central Gulf of Suez zone includes 62 earthquakes with magnitude ranges between 3.0 and 5.3. After applying G-R and deducing the earthquake relationship which join cumulative earthquake with the magnitude, the value of a –value was 4.1797 while b -value was 0.7437. Recent seismic activity has been proved along the Gulf of Suez (Salamon et al., 1996). The epicentral distribution of the micro-earthquakes shows clustering beneath Gobal Island, southern Gulf of Suez, while the scattered activities are located beneath the southern borders of the gulf (Daggett et al., 1986). The focal mechanism solutions of March 31, 1969 earthquake revealed the continuous activity. In addition, the data for southern end Gulf of Suez zone are represented by 143 earthquakes with magnitude ranges between 3.0 and 6.2. Through applying G-R and deducing the earthquake relationship which join cumulative earthquake with the magnitude, the a- value was found to be 4.2003 while b-value was 0.6315. High rate of seismicity at the southern end of the Gulf of Suez is attributed to the crustal movements among the Arabian plate, African plate, and the Sinai sub-plate (Al-Arifi et al., 2013). The activity along the Suez Gulf is supported by the recent earthquake activity observed by the National Research Institute of Astronomy and Geophysics (NRIAG-Bulletins, 1994–2012).
5 Discussion and conclusion
The level of seismic activity in the study area is high indicating complex tectonic setting that could affect the stability of this area (Merghelani, 1979). The earthquakes may be related to transform faults detected in the Red Sea magnetic anomalies or they might be related to the continuing uplift of the continental crust (Fnais et al., 2014). It is also possible that the earthquakes are caused by the relative movement of Arabian, African plates and Sinai sub-plate. Moreover, they demonstrate a significant rate of tectonic deformation far from the Red Sea spreading center in the center of the Red Sea, as Tabuk inland sesimogenic source zone, and along the Red Sea coastal strip, as Duba source. These results indicate the need for a more careful analysis of earthquake risk along the coast particularly at sites where major new construction is proposed.
Neom megaproject could be affected by earthquakes from ten seismotectonic zones. The expected magnitudes of seismic events were estimated for each zone related to the faulting activity in that zone. Overall, Neom megaproject affected by earthquakes with magnitude ranges between 3.0 and 7.2. Based on the estimated maximum expected magnitudes, it is revealed that the Gulf of Aqaba and southern end of the Gulf of Suez are the most hazardous seismotectonic source zones affecting Neom megaproject area. Consequently, the seismic hazard of the Neom megaproject must be assessed urgently for earthquake risk mitigation. This will help the decision and policy makers to improve land-use planning and designing earthquake-resistant structures throughout this very important and promising area in Saudi Arabia.
According to the magnitude-frequency relationship, the estimated a and b values vary through the study area which not only reflect the geodynamics processes such as continental rift and seafloor spreading but also to assess the seismic hazard that threatens Saudi Arabia’s megaprojects such as Neom and the Red Sea Development. The highest b values were defined in northwestern coast of the Red Sea source zone (b = 0.934), while the lowest b -value were recorded in Duba source zone (b = 0.41). Since b value is inversely related to stress (Urbancic et al., 1992; Ali, 2016; Ali and shanker, 2016) so northwestern coast of the Red Sea is associated with low stress regime. This indicates the faults of this source zone are capable to generate numerous smaller magnitude earthquakes of short return periods. In contrast, the Duba region indicate high stress regime may have high hazard of large magnitude earthquakes of large return periods.
Acknowledgements
Deep thanks and gratitude to the Researchers Supporting Project number (RSP-2021/351), King Saud University, Riyadh, Saudi Arabia for funding this research article.
Declaration of Competing Interest
The authors declare that they have no known competing financial interests or personal relationships that could have appeared to influence the work reported in this paper.
References
- Aboud, E., Ismail, A., Alqahtani, F., 2019, Surface and subsurface imaging of the Saudi cross-border city of NEOM deduced from remote sensing and geophysical data. in: Procedings of 2nd Conference of the Arabian Journal of Geosciences (CAJG), 25-29 Nov., Tunisia.
- The youngest Precambrian volcanic succession of Wadi Hamrawein, Eastern desert, Egypt. South Carolina, Columbia, USA: Earth Sc. And Res. Inst; 1988. PhD. Thesis
- Seismicity of the south-western region of the Arabian Shield and southern Red Sea. J. Afr. Earth Sc.. 1994;19(1-2):17-25.
- [Google Scholar]
- Seismotectonics and seismogenic source zones of the Arabian Platform. In: Al Hosani K., ed. Lithosphere Dynamics and Sedimentary Basins: The Arabian Plate and Analogues, Frontiers in Earth Sciences. 2013.
- [CrossRef] [Google Scholar]
- A new evaluation of seismic hazard for the northwestern part of Saudi Arabia. Nat. Hazards. 2013;69(3):1435-1457.
- [CrossRef] [Google Scholar]
- Source mechanisms of the June 2004 Tabuk earthquake sequence, Eastern Red Sea margin, Kingdom of Saudi Arabia. J. Seismol. 2009
- [CrossRef] [Google Scholar]
- Statistical analysis of seismicity in Egypt and its surroundings. Arabian J. Geosci.. 2016;9:52.
- [CrossRef] [Google Scholar]
- Ali M.S., Shanker, D., 2016, Study of seismicity in the NWHimalaya and adjoining regions using IMS network. J Seismol. DOI 10.1007/s10950-016-9603-7.
- AlKathery, A.M., 2010, Short-term and long-term seismic hazard assessment, NW Arabian Peninsula. MSc thesis, Geology Department, College of science, King Saud University, p 179.
- Seismic Hazard Assessment for Yanbu Metropolitan Area, Western Saudi Arabia. Arabian J. Geosci.. 2015;8(11):9945-9958.
- [CrossRef] [Google Scholar]
- The Seismicity of Egypt. Arabia and Red Sea: Cambridge University Press, Cambridge; 1994.
- The Sinai subplate and tectonic evolution of the northern Red Sea region. Geodynamics. 1999;27(4-5):433-450.
- [Google Scholar]
- Seismological and GPS constraints on Sinai sub-plate motion along the Suez rift. Studia Geod. Geophys.. 2008;52(3):397-412.
- [Google Scholar]
- Tectonics, seismicity and structure of the Afro-Eurasian junction and the breaking of an incoherent plate. Phys. Earth Planet. Inter.. 1976;12:1-50.
- [Google Scholar]
- Seismicity and active tectonics of the Egyptian Red Sea margin and the northern Red Sea. Tectonophysics. 1986;125:313-324.
- [Google Scholar]
- Seismicity and Tectonics of the Red Sea and Western Arabia. Geophys. J. Int.. 1989;97(3):449-457.
- [Google Scholar]
- The Seismicity of the Red Sea, Gulf of Aden and Afar Triangle. Philos. Trans. R. Society of London A: Mathematical, Phys. Eng. Sci.. 1970;267(1181):49-74.
- [Google Scholar]
- Seismicity and seismotectonics of the Jeddah area, Saudi Arabia. WIT Trans. State Art Sci. Eng.. 2014;79
- [CrossRef] [Google Scholar]
- Seismicity and Seismotectonics of Jeddah-Makkah Region, West-Central Saudi Arabia. J. Earth Sci.. 2015;26(5):746-754.
- [CrossRef] [Google Scholar]
- Relations between normal fault geometry, tilting and vertical motions in extensional terrains: an example from the southern Gulf of Suez. J. Struct. Geol.. 1988;10(2):155-170.
- [Google Scholar]
- Extensional fault-related folding, northwestern Red Sea, Egypt. J. Struct. Geol.. 2002;24(4):743-762.
- [Google Scholar]
- Estimation of the maximum earthquake magnitude, Mmax. Pure Appl. Geophys.. 2004;161(8):1655-1681.
- [Google Scholar]
- Korrat, I., Hussein, H., Marzouk, I., Ibrahim, E., Abdel-Fattah, R., Hurukawa, N., 2006, Seismicity of the northernmost part of the Red Sea (1995-1999) Acta Geophysica, 54, 1, 33–49, doi: 10.2478/s11600-006-0004-0.
- the rotation of Arabia and the Levant fault system. Tectonophysics. 1988;153(1-4):271-294.
- [Google Scholar]
- Maamoun, M., Allam, A., Megahed, A., 1984, Seismicity of Egypt. Bull HIAG, Vol. IV, Ser B:109–160.
- Merghelani, H. M., 1979, Seismicity of the Tihamat-Asir Region, Kingdom of Saudi Arabia. Saudi Arabian project report 261, directorate general of mineral resources ministry of petroleum and mineral resources, Jeddah, Saudi Arabia, 28p.
- Magnitude-frequency relation for elastic shocks accompanying fractures of various materials and some related problems in earthquakes (2nd paper) Bull Earthquake Res Inst., Univ. Tokyo. 1962;40:831-853.
- [Google Scholar]
- Egyptian National Research Institute of Astronomy and Geophysics (NRIAG) (1994-2012) Seismological Bulletins.
- Broad accommodation of riftrelated extension recorded by dyke intrusion in Saudi Arabia. Nat. Geosci.. 2010;3(10):705-712.
- [CrossRef] [Google Scholar]
- Seismicity of the eastern Mediterranean region: perspective from the Sinai subplate. Tectonophysics. 1996;263(1-4):293-305.
- [Google Scholar]
- Saleh, S. and Paˇsteka R., 2012, Applying the regularized derivatives approach in Euler deconvolution and modeling geophysical data to estimate the deep active structures for the northern Red Sea Rift region, Egypt. Contributions to Geophysics and Geodesy, 42(1) 2012 pp.25–61.
- Empirical global relations converting Ms and mb to moment magnitude. J. Seismol.. 2006;10(2):225-236.
- [Google Scholar]
- Shapira, A., Jarradat, M., 1995, Earthquake risk and loss assessment in Aqaba and Eilat regions. Submitted to the US Aid-Merc Program.
- Subsidence in the Gulf of Suez: implications for rifting and plate kinematics. Tectonophysics. 1988;153(1-4):249-270.
- [Google Scholar]
- Space time correlations of b values with stress release. Pure Appl. Geophys. 1992;139(3-4):449-462.
- [Google Scholar]
- New empirical relationships among magnitude, rupture length, rupture width, rupture area, and surface displacement. Bull. Seism. Soc. Am.. 1994;84:974-1002.
- [Google Scholar]
- The Geology of the Sudan Republic. Oxford: Clarendon Press; 1971.
- (2015): Identifying Active Faults by Improving Earthquake Locations with InSAR Data and Bayesian Estimation: The 2004 Tabuk (Saudi Arabia) Earthquake Sequence. Bull. Seismol. Soc. Am.. 2015;105(2a):765-775.
- [CrossRef] [Google Scholar]
- Development of accommodation zones in the Gulf of Suez-Red Sea Rift, Egypt. AAPG Bull.. 2002;86(6):1003-1026.
- [Google Scholar]
- On the development of a seismic source zonation model for seismic hazard assessment in western Saudi Arabia. J. Seismol.. 2016;20(3):747-769.
- [CrossRef] [Google Scholar]
Appendix A
Supplementary data
Supplementary data to this article can be found online at https://doi.org/10.1016/j.jksus.2021.101659.
Appendix A
Supplementary data
The following are the Supplementary data to this article:


