

Translate this page into:
Seismicity characteristics of the Gulf of Aqaba seismogenic zone and their hazard implications in northwestern Saudi Arabia
⁎Corresponding author. aabdelfattah@ksu.edu.sa (Ali Abdelfattah)
-
Received: ,
Accepted: ,
This article was originally published by Elsevier and was migrated to Scientific Scholar after the change of Publisher.
Peer review under responsibility of King Saud University.
Abstract
The seismogenic characteristics of the Gulf of Aqaba zone have been assessed using the maximum likelihood method to estimate various earthquake recurrence parameters. These parameters encompass the β-value, annual recurrence rate (λ), and maximum probable magnitude (Mmax). This assessment has identified three sub-seismogenic zones, each corresponding to specific structural faults within the Gulf. These zones are associated with the Aragonese, Arnona and Aqaba faults, delineating pull-apart basin structures in the Gulf of Aqaba. An updated earthquake catalogue has been compiled using a unified moment magnitude (Mw) scale to improve the analysis, established by developing two empirical relationships. According to the findings of this study, there is a possibility that the Aragonese seismogenic zone could experience an earthquake with a maximum magnitude of 7.7, highlighting a significant seismic hazard in the region. While acknowledging the inherent uncertainties in this assessment, a probabilistic seismic hazard was calculated for hard rock conditions within a spatial area divided into elementary cells, each measuring 0.1°×0.1°. The highest peak ground acceleration (PGA) is associated with a spectral frequency of 5.0 to 10.0 Hz and could significantly impact building codes in the region. The spatial distribution variations of seismic hazard corresponding to the proposed sub-seismogenic zones indicate a high degree of crustal heterogeneity and seismotectonic complexity. This comprehensive assessment contributes to understanding seismic hazards that may import from the Gulf of Aqaba seismogenic zone.
Keywords
Gulf of Aqaba
Earthquake recurrence characteristics
Seismic hazard
Seismicity

1 Introduction
Saudi Arabia’s vision for 2030 includes significant development projects in the northwest region, such as constructing an international bridge connecting Saudi Arabia and Egypt. Given the scale of critical infrastructure development in the region, understanding, estimating, and mitigating earthquake hazards is paramount.
The extent of damage caused by earthquakes to structures depends on various factors, including peak ground acceleration (PGA), ground motion intensity, structural design and foundation, soil rigidity, liquefaction potential, site geology, and the structure’s location relative to the earthquake epicenter (Sengezer et al., 2008). Seismic hazard assessments are vital for accurately estimating potential property and life losses in risk analyses. These assessments determine site-specific expected ground motions near critical infrastructure like railways, highways, bridges, and dams. A crucial aspect of a comprehensive seismic hazard analysis is defining seismogenic zones and characterizing seismic hazards, which involves understanding the spatial distribution of peak ground accelerations (PGAs), response spectra, exceedance probabilities, and return periods.
From the perspective of Saudi Arabia, the Gulf of Aqaba seismogenic zone is a significant concern as it is considered the most earthquake-prone area in the Red Sea region. The region experienced two significant earthquakes in August 1993 and November 1995. The 1993 earthquake with a local magnitude of 5.8 (Abdel Fattah et al., 1997) occurred near the western coastline of the Gulf along the Aragonese/Arnona fault and likely contributed to the 1995 earthquake with a moment magnitude of 7.2 (Hofstetter et al., 2003). The 1995 earthquake caused extensive damage in northwest Saudi Arabia, followed by intense aftershocks. This seismic event significantly impacted and destroyed the coastlines of nations adjacent to the Gulf. Severe destruction was witnessed in Nuweiba, Egypt, the city nearest the epicenter, with most buildings suffering extensive or complete destruction (Klinger et al., 1999). It is essential to highlight that the Gulf of Aqaba earthquake source zone poses a potential seismic threat to neighboring regions, including Saudi Arabia, Egypt, Jordan, and Palestine. The rapid development of megacities near this seismogenic zone, like Neom in Saudi Arabia, may raise concerns about potential hazards.
Seismogenic models describing the spatial and temporal distribution of potential seismic sources are crucial to seismic hazard assessment. In the Gulf of Aqaba, the tectonics are influenced by three major strike-slip faults: the Aqaba Fault, the Aragonese Fault, and the Arnona Fault, which generate pull-apart basin structures. The presence of these sub-seismogenic zones was not thoroughly considered in previous assessments but has been incorporated into the seismic source modeling in this study. It is important to note that earlier studies have indicated that the highest PGAs in the Gulf of Aqaba seismogenic zone tend to align parallel to the coast and decrease in magnitude as one moves away from the coast.
This study generated hazard spectra on a hard rock site in Neom, Saudi Arabia, for various return periods based on the characteristics of earthquakes in the Gulf of Aqaba seismogenic zone. Earthquake data from 1964 to 2023 was collected and analyzed to update probabilistic seismic hazard maps on both sides of the Gulf. The methodology used is based on established techniques for estimating fundamental earthquake hazard parameters, including maximum regional magnitude (Mmax), magnitude-frequency relationship (β value), and mean seismic activity rate (λ). These parameters help enhance our understanding of seismic hazards, aid earthquake preparedness and mitigation and are calculated using the maximum likelihood estimation method. We used the method introduced by Kijko and Sellevoll (1989, 1992) and Kijko (2004) to estimate the maximum regional magnitude Mmax and other related earthquake hazard parameters.
2 Tectonics and seismicity
The Gulf of Aqaba seismogenic zone is situated near the transform fault that connects the Red Sea rifting system with the Dead Sea transform fault system, as previously reported by Mechie and El-Isa (1988). However, the current tectonic dynamics in this seismogenic zone are primarily influenced by the ongoing separation of the Arabian and African plates. This separation significantly affects the rotational movement of the Sinai sub-plate, as Salamon et al. (2003) discussed. Fig. 1 visually represents the ongoing tectonic processes and the spatial distribution of epicenters in the northern Red Sea region from 750BCE to 2020 CE Additionally, Fig. 1 presents the spatial distribution of focal mechanism solutions for the earthquakes listed in Table 1. The arrangement of hypocenters in terms of latitude and longitude indicates that the Gulf of Aqaba seismogenic zone spans approximately 120 km in length and 15 km in width. Most of the seismic events within this zone occur at depths ranging from 5 to 20 km. According to the International Seismological Centre, the mainshock of the 1995 earthquake sequence, with a moment magnitude (Mw) of 7.2, is the most significant known earthquake in the region. However, the Gulf of Aqaba seismogenic zone experiences relatively infrequent earthquakes with magnitudes exceeding 6.5, as noted by Klinger et al. (1999).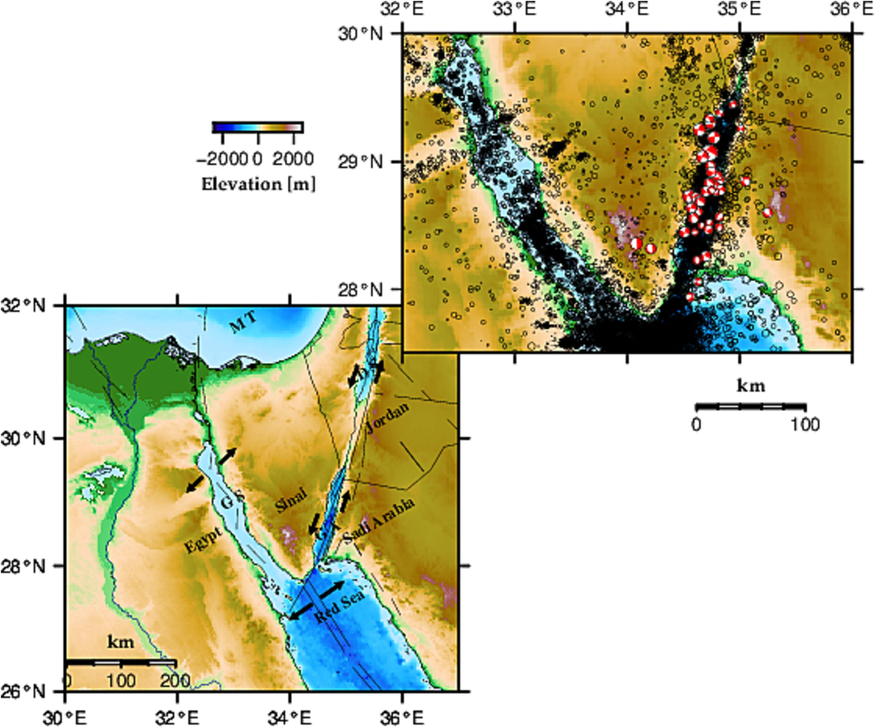
Tectonic settings and seismicity distribution in the Gulf of Aqaba and its vicinity region.
ID
Date
To
Lat [°]
Long [°]
d [km]
M
Strike [°]
Dip [°]
Rake [°]
Mo
Mw
1
19820323
104800
27.90
34.30
10
4.7ML
220
65
−040
4.42E+22
4.4
2
19830203
134604
29.19
34.77
24
5.3Mw
360
80
014
2.31E+23
5.3
3
19851231
194241
28.85
35.05
09
4.8ML
155
60
−030
6.03E+22
4.5
4
19890909
---------
28.57
34.82
10
4.1ML
205
50
−110
6.84E+21
3.8
5
19930703
233410
28.86
34.82
18
4.7ML
114
88.69
149
4.42E+22
4.4
6
19930803
4305
28.73
34.55
17
6.0Mw
007
62
−117
2.63E+24
6.0
7
19930803
124305
28.73
34.55
17
6.0ML
294
87.27
−157
2.51E+24
5.6
8
19930803
163323
28.36
34.08
15
5.7ML
356
79.41
−083
9.89E+23
5.7
9
19930807
45540
28.61
34.63
10
4.2ML
217
50.19
−042
9.33E+21
3.9
10
19930820
230959
28.72
34.61
02
4.6ML
116
79.84
140
3.24E+22
4.3
11
19931103
183932
28.7
34.65
07
4.9ML
086
76.13
−148
8.22E+22
4.5
12
19931108
10602
28.69
34.65
08
4.7ML
303
80.49
−120
4.42E+22
4.4
13
19931204
233411
28.89
34.8
10
4.6ML
093
68.07
−148
3.24E+22
4.3
14
19951122
1526
29.07
34.73
18
7.2Mw
196
59
−015
1.71E+26
7.2
15
19951122
124704
29.3
34.74
15
5.0ML
074
80.04
−150
1.12E+23
4.6
16
19951122
221657
28.32
34.21
15
5.2ML
357
60.54
−069
2.09E+23
4.8
17
19951123
717
29.25
34.64
10
5.7Mw
199
77
007
9.27E+23
5.7
18
19951124
164345
28.97
34.74
10
4.9ML
165
54.28
−068
8.22E+22
4.5
19
19951211
13208
28.92
34.75
19
5.0ML
302
84
147
1.12E+23
4.6
20
19960103
100526
28.6
35.25
10
4.8ML
113
59.77
−138
6.03E+22
4.5
21
19960108
1318
29.38
34.82
06
3.8ML
340
78.86
164
2.69E+21
3.6
22
19960116
61700
29.34
34.73
06
4.3ML
159
82.79
149
1.27E+22
4.0
23
19960204
72300
29.45
34.94
06
3.6ML
294
77.43
−149
1.45E+21
3.4
24
19960221
5951
28.8
34.78
10
5.3Mw
132
30
−104
2.31E+23
5.3
25
19970510
147
28.26
34.7
10
4.6Mw
114
89
150
2.02E+22
4.6
26
20000308
142226
28.83
34.73
15
4.9Mw
182
48
−048
5.74E+22
4.9
27
20000308
122229
28.64
34.57
10
4.8Mw
198
31
−018
4.06E+22
4.8
28
20000308
142225
28.77
34.7
07
4.9ML
135
85.1
−169
8.22E+22
4.5
29
20000406
63734
28.78
34.83
12
4.8ML
0209
85.1
−012
6.03E+22
4.5
30
20000803
142225
28.64
34.57
10
4.8ML
108
82.31
167
6.03E+22
4.5
31
20010207
33900
29.26
35.01
21
3.6Mw
044
80
−005
6.25E+20
3.6
32
20021110
5945
28.23
34.62
16
3.9ML
180
47.3
−084
3.67E+21
3.6
33
20040922
120023
28.45
34.6
10
3.2ML
270
64.05
−076
4.17E+20
3.0
34
20050120
134100
28.5
34.66
19
3.2ML
041
43
−056
4.17E+20
3.0
35
20080302
170600
28.76
34.79
14
3.2ML
058
75
−029
4.17E+20
3.0
36
20080404
140500
28.78
34.75
07
3. ML
145
46
−067
1.97E+21
3.5
37
20111021
123700
28.52
34.73
09
3.7ML
148
49
−147
1.97E+21
3.5
38
20130610
84400
28.06
34.63
06
3.9ML
142
73
−015
3.67E+21
3.6
39
20150627
53404
29.04
34.67
22
5.6Mw
200
82
002
6.55E+23
5.6
40
20160516
14200
28.47
34.72
07
4.3ML
157
52
−173
1.27E+22
4.0
41
20160516
4559
28.45
34.51
18
5.2ML
019
88
−003
1.63E+23
4.7
42
20160813
30600
28.49
34.82
19
3.9ML
332
47
−153
3.67E+21
3.6
43
20161129
113
28.56
34.59
18
4.7Mw
188
59
−044
2.86E+22
4.7
44
20170519
141600
27.94
34.56
04
4.1ML
304
50
−027
6.84E+21
3.8
Seismic activity in the Gulf of Aqaba seismogenic zone is characterized by isolated seismic sequences occurring spatially and temporally, as described by Abdel-Fattah et al. (2006). Notable earthquake sequences have occurred in various years, including 1983, 1990, 1993, 1995, 2015, and 2016, as documented by Almadani (2020). The distribution of fault plane solutions across the Gulf of Aqaba has revealed different earthquake faulting mechanisms. Normal earthquake faulting mechanisms are observed in the southernmost parts of the Gulf of Aqaba and the northern region of the Red Sea. In contrast, earthquake activity is primarily associated with strike-slip faulting mechanisms in the central and northernmost regions of the Gulf of Aqaba, highlighting the significant role of strike-slip faulting in this area. This transition in fault mechanism styles from south to north suggests that faulting processes in the northern Red Sea do not directly extend into the Gulf. Seismic tomography analysis conducted by El Khrepy (2016) did not uncover evidence of oceanic crust development within the Gulf.
3 Earthquake catalogue
An earthquake catalogue from 750BCE to 2020 CE was compiled for the study area. Data sources include historical earthquake records reported by Ambraseys et al. (2005) and instrumental earthquake data from various sources, including Maamoun et al. (1984), the International Seismological Center (ISC) data file, Harvard Seismology, the USGS/NEIC catalogue, ISC Bulletin, and catalogue, Preliminary Determination of Epicenters (PDE) from the National Earthquake Information Centre (NEIC), Bulletins of the Egyptian National Seismic Network, and the Saudi Geological Survey (SGS). The distribution of earthquakes was assumed to follow a Poisson distribution, as Cornell (1968) described. In order to maintain the accuracy and reliability of the seismic activity rate, dependent events like foreshocks and aftershocks were excluded from the catalogue to avoid short-term anomalies. The algorithm proposed by Reasenberg (1985) was employed to remove the effects of non-background earthquakes.
Primary magnitude data in terms of body wave magnitude (Mb) and local magnitude (ML) were obtained from the ISC to calibrate moment magnitude (Mw). The ML values were calculated using the empirical relation by Shapira (1988), which was initially associated with sample ML values derived from short-period amplitude measurements on seismograms simulated to a Wood-Anderson instrument. Data for mL and mb were collected from the ISC and the National Earthquake Information Centre (NEIC), while corresponding Mw data were sourced from various providers, including CMT Harvard (Ekström et al., 2012), the Regional Centroid Moment Tensor catalogue (RCMT), and the Relative Moment Tensor catalogue (RMT).
In order to mitigate discrepancies resulting from the utilization of various instrument types, seismic wave measurements, and methods for calculating magnitude, earthquake magnitudes were standardized by their conversion to moment magnitude (Mw). Empirical relationships were developed to relate different magnitude scales (ML and mb) provided by various agencies (Fig. 2a and b), and these empirical relationships are expressed as follows:
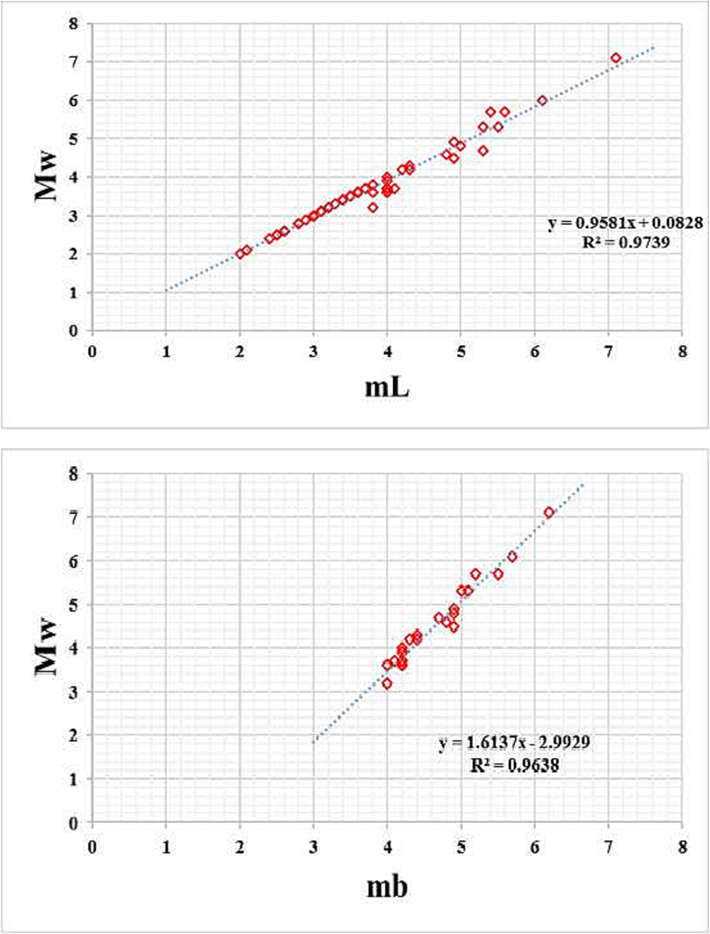
Displayed the magnitude conversion relationships derived in this study.
The method described by Stepp (1972), which relies on analyzing how the cumulative seismic activity’s slope changes over time, was employed to determine the completeness magnitude levels of the earthquake catalogue (Mc). Following this technique, the earthquake catalogue was considered comprehensive for magnitudes above Mw 3.0 since 1984, Mw 4.5 since 1965, and Mw 5.0 since 1900. Fig. 3 shows the spatial distribution of epicenters for the earthquake catalogue compiled in this study.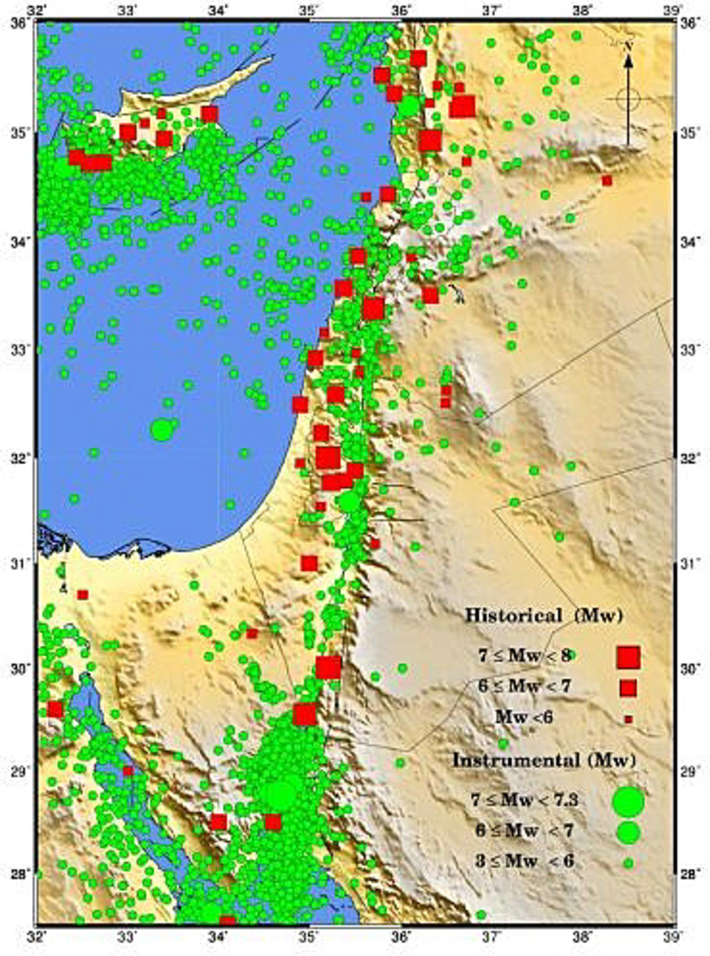
The complied earthquake catalogue for the Gulf of Aqaba and its surroundings.
4 Seismicity model
An essential aspect of assessing seismic hazards involves constructing seismogenic models that detail seismic sources’ spatial and temporal distribution. These models encompass critical parameters, such as seismicity rate, maximum earthquake magnitude, earthquake depth distribution, and the spatial arrangement of seismic sources. These parameters are estimated by leveraging diverse data sources, including historical earthquake records, geological mapping, and geophysical investigations. In the Gulf of Aqaba, the tectonics are influenced by three major strike-slip faults, each exhibiting a minor component of normal motion alongside their primary strike-slip movement. In this study, the seismic source modeling takes these faults into account.
A combination of extensional and shear deformations appears to govern the current tectonic processes in the Gulf, resulting in the development of a Neogene structure consisting of a series of pull-apart basins that make up the Gulf of Aqaba (Ben-Avraham et al., 1979; Tibor et al., 2010; Abdel-Fattah et al., 2016). These basins include the Eilat Deep, Aragonese Deep, Arnona Deep, and Dakar Deep, from north to south. These basins have varying thicknesses and are bounded by three major strike-slip faults: the Aqaba fault, the Aragonese fault, and the Arnona fault. The spatial extension of the Gulf of Aqaba Fault model and area seismic model is depicted in Fig. 4a and b.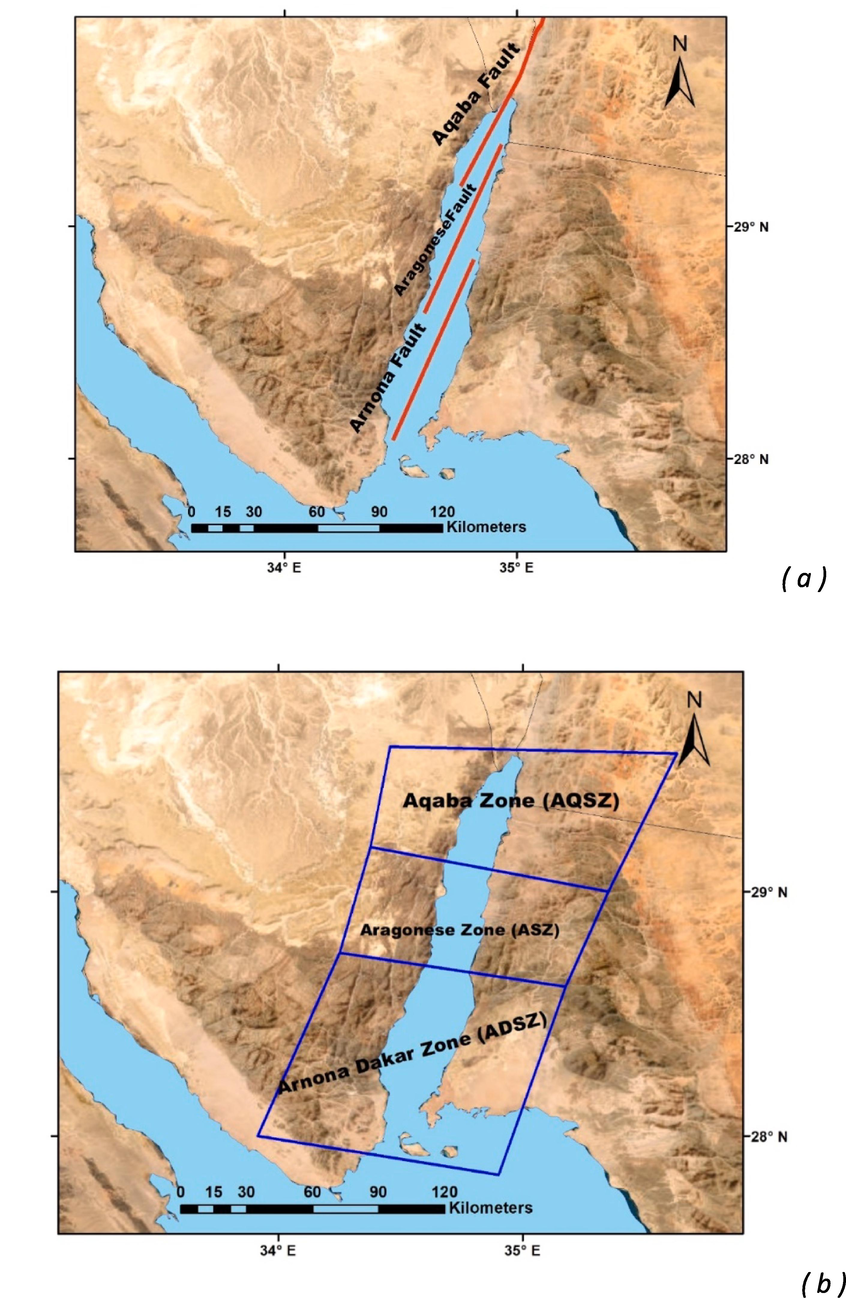
Maps show the spatial extension of the Gulf of Aqaba (a) Fault model and (b) Area seismic model.
According to Ribot et al. (2021), the Aragonese fault spans approximately 53 km, the Arnona fault covers around 83 km, and the Aqaba fault extends over 160 km. The slip rates for these faults were determined by Bungum (2007) using GPS data from stations around the Gulf of Aqaba, revealing slip rates of 4.5 mm per year for the Aragonese fault, 4.5 mm per year for the Arnona fault, and 4.7 mm per year for the Aqaba fault. In order to determine the highest anticipated magnitude (Mamx) along each fault, recent scaling relationships from Thingbaijam et al. (2017) were employed. The seismicity parameters for these three faults are summarized in Table 2. These faults are incorporated into the first seismogenic model (Fig. 4a), which was developed to depict potential earthquake activity in the Gulf of Aqaba. The second model, the Aqaba Area seismic model (Fig. 4b), was created to account for seismicity associated with these faults using area-based seismogenic models. The seismicity parameters for these sub-seismogenic zones describe the likelihood of various magnitude earthquakes projected to occur in the region, with the distribution of earthquake magnitudes assumed to follow the Gutenberg and Richter (1954) relationship, as per Cornell (1968):
Fault Segment
Length (Km)
Mmax
Slip rate (mm/y)
M0 (pa)
a value
Arnona
83
7.1
4.5
2.64E + 17
4.43
Aragonese
53
6.9
4.5
1.68E + 17
4.34
Aqaba
160
7.6
4.7
3.01E + 18
4.30
where ‘n’ represents the cumulative number of earthquakes with a magnitude greater than or equal to ‘m,’ ‘a’ stands for the seismicity rate, and ‘b’ denotes the potential seismicity encompassing small and large earthquakes. The relationship expression is limited to the range between the lower threshold magnitude (Mmin) and the maximum expected magnitude (Mmax), with earthquakes more minor than Mmin excluded from consideration. The mean annual rate of exceedance (represented as λM) is calculated using a doubly truncated exponential relationship,
where and
The activity parameters (β and λ) in the previous relationship were determined through the maximum likelihood estimation method developed by Weichert (1980), while Mmax was derived using the statistical approach described by Kijko (2004). The seismicity parameters for the seismic models we proposed are provided in Table 3.
Zone No.:
Name of Zone
Mmin.
β
σ β
λ
Mmax
σ Mmax
1
Arnona Dakar Zone (ADSZ)
3.5
2.1
0.16
0.49
6.1
6.7
0.20
2
Aragonese Zone (ASZ)
3.0
2.05
0.15
0.75
7.2
7.7
0.50
3
Aqaba Zone (AQSZ)
3.0
2.07
0.07
0.45
5.1
5.6
0.50
5 Ground-motion models
Ground motion prediction equations (GMPEs), commonly called ground motion models, were employed to estimate the magnitude of ground motion resulting from the seismic source characteristics. These models are developed based on data from strong-motion recordings of previous earthquakes. However, due to the limited availability of such records in Saudi Arabia, creating region-specific ground motion models presented a challenge. Consequently, ground motion models from areas with similar tectonic characteristics were used to predict the expected ground motion in the study area.
Following the recommendations provided by Cotton et al. (2006) and Boomer et al. (2010), four Ground Motion Prediction Equations (GMPEs) were selected to model ground motion in the current study, utilizing the logic tree approach. This approach considers epistemic uncertainty by accounting for variations in GMPEs. The chosen models include those proposed by Abrahamson et al. (2014), Akkar and Boomer (2010), Chiou-Youngs (2014), and Zhao et al. (2006).
6 Probabilistic seismic hazard calculations
The traditional approach to conducting a probabilistic seismic hazard analysis (PSHA) was initially introduced by Cornell (1968) and has subsequently been expanded upon and widely adopted by several researchers (e.g., Bender and Perkins, 1987). The likelihood of earthquake events, as modeled by the Poisson distribution, can be mathematically expressed as follows:
In the context of seismic hazard analysis, Pn [m, M, t] denotes the probability of experiencing ‘n’ earthquakes with magnitudes greater than ‘M’ within a specified area over a period ‘t’ while ‘λ’ represents the expected number of earthquake occurrences per unit of time in that area. The Poisson model assumes that earthquakes are spatially and temporally independent, that earthquake occurrences are consistent within a short time, and that two earthquakes will not happen simultaneously. The anticipated number of earthquake occurrences within a particular area can be estimated using statistical data from the site, based on the frequency-magnitude relationship initially defined by Gutenberg and Richter (1954). By taking the inverse logarithm of equation (4) and substituting it into the Poisson model, we get:
From the above expression, we can find the probability of having no earthquake with a magnitude greater than M over a while t in each area as
The probability of having at least one earthquake with a magnitude greater than M in time t as
The return period of an earthquake with a magnitude greater than M is
7 Logic tree
A logic tree approach addressed the inherent epistemic uncertainty in quantifying PSHA. This approach involved considering alternatives for seismic source models, standard deviations of model values describing maximum expected magnitudes for each seismic source, and ground motion attenuation relationships. The logic tree assigns weights to various branches to account for the likelihood of each of the three alternatives.
The logic tree comprises three components in the present analysis, as illustrated in Fig. 5. The first component deals with the uncertainty in seismic source models and has two branches. The first branch pertains to the Aqaba fault-source model, while the second is for the area seismic source model. The assessment of this component concludes that while it is plausible to evaluate hazards for individual faults, the resulting hazards are highly influenced by variations in fault seismic characteristics due to uncertainties. These uncertainties could lead to overestimating the hazard, particularly in the near-source region. Therefore, an equal weight is assigned to the fault-source and area seismic source models in the developed logic tree in this study. The second component addresses the uncertainty in estimating the maximum expected magnitude, where the expected mean maximum magnitude carries a weight of 0.75, while a weight of 0.25 accounts for deviations from the mean maximum magnitude (Mmax + σ). The third component deals with alternative equations for modeling the expected ground motion. Four Ground Motion Prediction Equations (GMPEs) are adapted and assigned equal weighting.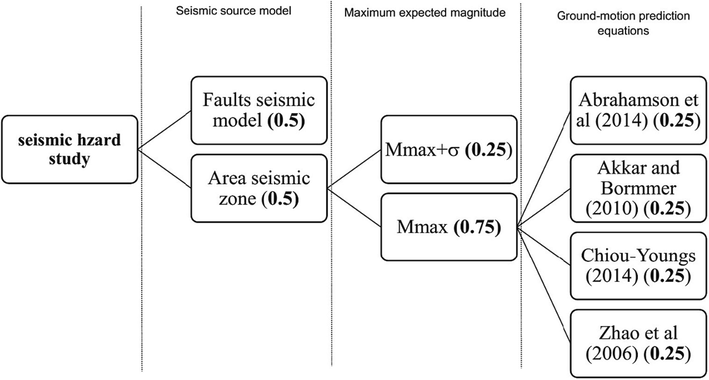
The logic tree approach used in the current study. A bold number between brackets is the weight.
The widely accepted software code EZ-FRISK performs calculations according to the logic tree. Computations are implemented using a grid resolution of 0.1°×0.1°, covering the northwestern part of Saudi Arabia and the Sinai Peninsula. The calculations generated seismic hazard curves, uniform hazard spectra (UHS), and hazard maps illustrating PGA. The current analysis considers various spectral periods (0.5, 0.1, 0.2, 0.3, 1.0, 2.0, 3.0, and 4.0 s) along with three levels of ground shaking (with probabilities of exceedance of 10 %, 5 %, and 2 % over 50 years). These spectral periods and different levels of ground shaking are commonly used in building codes.
8 Results and discussions
The PSHA is the likelihood of ground motion exceeding a specific level at a given location within a designated return period (Bommer and Pinho, 2006). In this study, within the framework of the logic tree approach, ground motion acceleration was computed in the vicinity of the Gulf of Aqaba under bedrock conditions. The outcomes created seismic hazard curves for each point in the predefined grid of 0.1°×0.1° that covers the northwestern part of Saudi Arabia and the Sinai Peninsula. Uniform hazard spectra (UHS) and seismic hazard maps were then developed using these curves. For Neom City, UHS was generated for return periods of 475, 975, and 2475 years, corresponding to probabilities of ground motion exceeding 10 %, 5 %, and 2 % over 50 years, as depicted in Fig. 6. The results indicated that the expected PGA values at Neom City are approximately 55 cm/s2, 71 cm/s2, and 95 cm/s2 for return periods of 475, 975, and 2475 years, respectively. The highest values are observed at a spectral period of 0.1 s, with values of 124 cm/s2, 161 cm/s2, and 234 cm/s2 for the same order of return periods. Fig. 7a-c illustrate the spatial distribution of expected PGA originating from the Gulf of Aqaba earthquake source zone. The highest value is around 385 cm/s2 for a return period of 475 years, reaching about 577 cm/s2.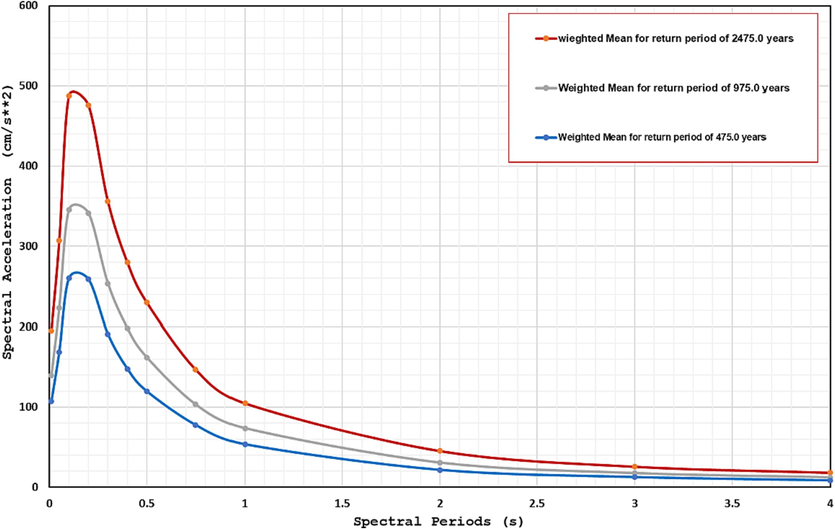
Uniform hazard spectra at the rock site in Neom City for return periods of 475, 975 and 2475 years.
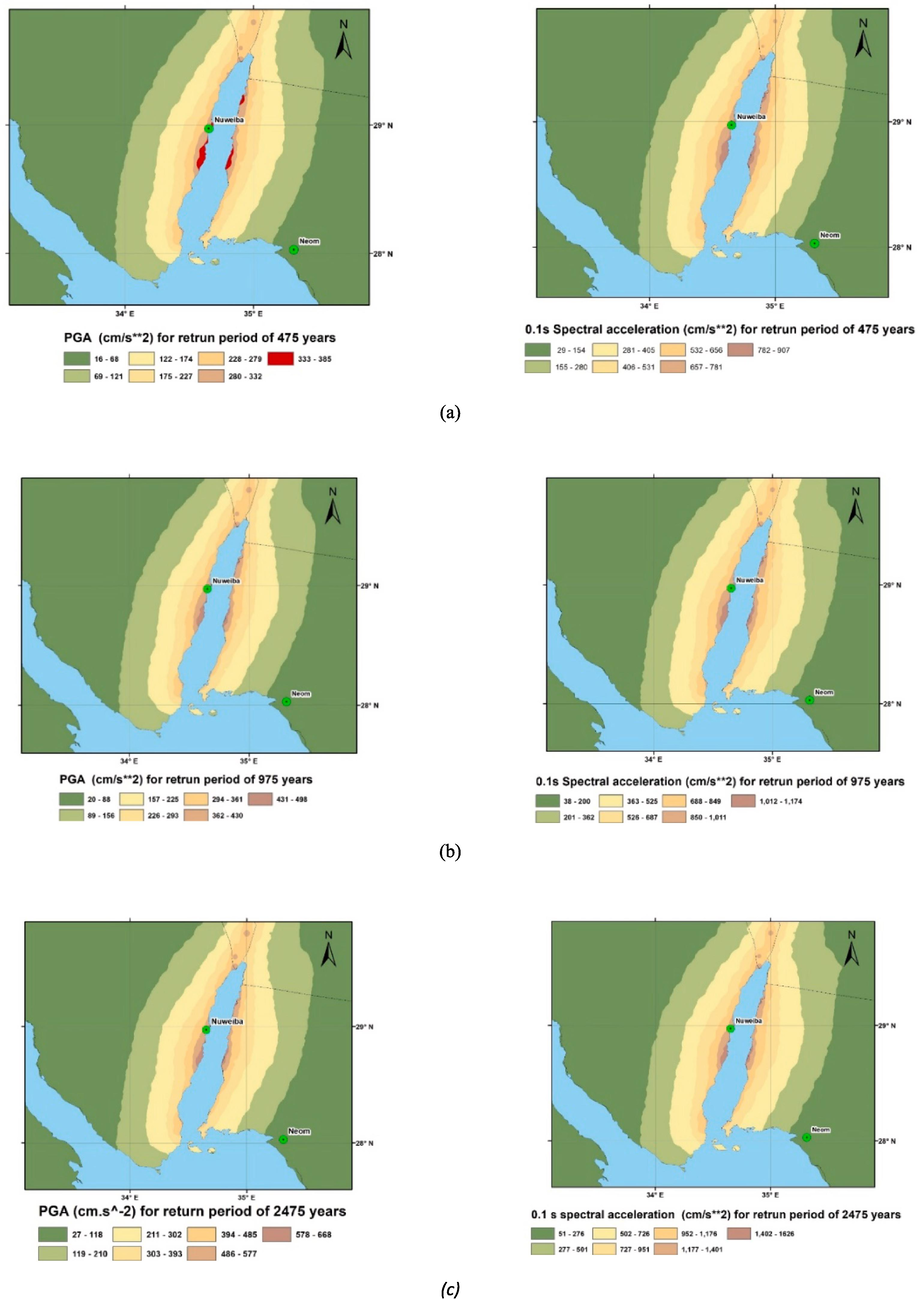
Mean peak ground acceleration (cm/s2) on the rock sites, (a) with a 10 % probability of exceedance in 50 years (475-year return period), (b) with a 5 % probability of exceedance in 50 years (975 year return period), and (c) with 2 % probability of being exceeded in 50 years (2475 years return period).
Comparisons with previous studies in the area, such as El-Eraki et al. (2015), Mostafa et al. (2018), and Abdelwahed et al. (2020), show that the estimates of PGAs are comparable. In contrast, the results of Al-Arifi et al. (2013) and Gorshkov et al. (2019) reported relatively lower PGA values, ranging from 100 to 325 cm/s2, for a return period of 475 years. Additionally, Mostafa et al. (2018) observed PGAs at 0.2 s and 0.3 s, while in this study, the PGAs are in the range of 0.1–0.2 s, respectively. These results suggest that the Gulf of Aqaba plays a dominant role in controlling seismic hazards in the region, particularly in comparison to studies that considered multiple earthquake source zones.
9 Conclusions
This study explores the seismic characteristics of the Gulf of Aqaba seismogenic zone and assesses the potential seismic hazard that could affect the northwestern region of Saudi Arabia. Using an updated earthquake catalogue developed in this study, employing a unified moment-magnitude scale, the maximum likelihood method was applied to estimate critical seismic activity parameters representing the seismogenic zone of the Gulf of Aqaba. These parameters include the maximum expected magnitude (Mmax), seismic hazard parameters that describe the magnitude-frequency relationship (β-value), and the mean seismic activity rate (λ). The seismicity model proposed in this study accounts for three seismogenic zones corresponding to the Aqaba fault, the Aragonese fault, and the Arnona fault.
The current findings reveal that the maximum PGA values reach approximately 385 cm/s2 for an event expected every 475 years with a 10 % chance of occurrence, 498 cm/s2 for an event anticipated every 975 years with a 5 % likelihood, and 688 cm/s2 for an event projected every 2475 years with a 2 % chance. The response spectrum demonstrates that PGA energies exhibit high-frequency characteristics in the range of 5.0 Hz to 10.0 Hz, which raises concerns about soil response at sites near the Gulf. It is essential to avoid resonant vibrations that may coincide with the natural periods of structures.
The PSHA results indicate that the Gulf of Aqaba is a significant seismic hazard zone, particularly the Aragonese sub-seismogenic zone, where an earthquake with a moment magnitude of 7.7 is considered a realistic possibility, implying that decision-makers and policymakers in the region should consider seismic risk factors when making land use and building code decisions, especially in mega-project cities.
Credit authorship contribution statement
AA and ME participated in the conceptualization, analysis, calculation of seismic hazards, and writing. HB paticipated in the compilation of earthquake cataloque. HA participated in funding acquisition, data curation, and writing. SQ participated validation and methodology. NA participated in review and improve langustic writing of the article.
Acknowledgments
This research was supported by Researchers Supporting Project number (RSP2024R425), King Saud University, Riyadh, Saudi Arabia.
Declaration of Competing Interest
The authors declare that they have no known competing financial interests or personal relationships that could have appeared to influence the work reported in this paper.
References
- Fault plane solutions of the 1993 and 1995 Gulf of Aqaba earthquakes and their tectonic implications. Ann. Geofis.. 1997;40:1555-1564.
- [Google Scholar]
- Another look at the 1993 and 1995 Gulf of Aqaba earthquakes from the analysis of teleseismic waveforms. Acta Geophys.. 2006;54:260-279.
- [Google Scholar]
- Seismicity constraints on stress regimes along Sinai subplate boundaries. Stud. Geophys. Geod.. 2016;60:268-279.
- [Google Scholar]
- Spatial distribution of the empirical peak ground motion in Western Saudi Arabia and its implication on Al-Madinah city. Arab. J. Geosci.. 2020;13:22-32.
- [Google Scholar]
- Summary of the ASK14 ground-motion relation for active crustal regions. Earthq. Spectra. 2014;30:1025-1055.
- [Google Scholar]
- Empirical equations for the prediction of PGA, PGV and spectral accelerations in Europe, the Mediterranean and the Middle East. Seismological Research Letters. 2010;81:195-206.
- [Google Scholar]
- A new evaluation of seismic hazard for the northwestern part of Saudi Arabia. Nat. Hazards. 2013;69:1435-1457.
- [Google Scholar]
- Rate of seismic deformation in the Gulf of Aqaba inferred from moment-tensor summation. Studia Geophysica Et Geodaetica. 2020;64:504-519.
- [Google Scholar]
- The Seismicity of Egypt, Arabia and the Red Sea: a historical review. Cambridge University Press; 2005. p. :204.
- Sediments and structure of the Gulf of Elat (Aqaba) - northern Red Sea. Sed. Geol.. 1979;23(1):239-267.
- [Google Scholar]
- A note on the selection of minimum magnitude for use in seismic hazard analysis. Bull. Seismol. Soc. Am.. 1987;79:199-204.
- [Google Scholar]
- Adapting earthquake actions in Eurocode 8 for performance-based seismic design. Earthquake Engineering and Structural Dynamics. 2006;35:39-55.
- [Google Scholar]
- A model for assessing the effect of epistemic uncertainty on probabilistic seismic hazard analyses. Bull. Seismol. Soc. Am.. 2010;100(5):1669-1682.
- [Google Scholar]
- An attenuation model for estimating average horizontal spectral accelerations in the far field from shallow crustal earthquakes. Earthq. Eng. Struct. Dyn.. 2014;43(1):1-30.
- [Google Scholar]
- Criteria for selecting and adapting ground-motion models for specific target regions Application to Central Europe and rock sites. J Seismol. 2006;10:137-156.
- [Google Scholar]
- The global CMT project 2004–2010: centroid-moment tensors for 13,017 earthquakes. Phys Earth Planet Inter. 2012;200–201:1-9.
- [Google Scholar]
- Seismic structure beneath the Gulf of Aqaba and adjacent areas based on the tomographic inversion of regional earthquake data. Solid Earth. 2016;7:965-978.
- [Google Scholar]
- Multiseismotectonic models, presentday Seismicity and seismic hazard assessment for Suez Canal and its surrounding area, Egypt. Bulletin Eng. Geology Environ.. 2015;75:503-517.
- [Google Scholar]
- Seismogenic nodes (M C 5.0) in Northeast Egypt and implications for seismic hazard assessment. Pure Appl. Geophys.. 2019;176:593-610.
- [Google Scholar]
- Seismicity of the Earth and Related Phenomena. Phys. Earth Planet. In.. 1954;7(5–6):273-287.
- [Google Scholar]
- Source mechanism the 22/11/1995 Gulf of Aqaba earthquake and its aftershock sequence. J. Seismol.. 2003;7:99-114.
- [Google Scholar]
- Estimation of the maximum earthquake magnitude, Mmax. Pure Appl. Geophys.. 2004;161:1655-1681.
- [Google Scholar]
- Estimation of earthquake hazard parameters from incomplete data files. Part I. Utilization of extreme and complete catalogs with different threshold magnitudes. Bull. Seismol. Soc. Am.. 1989;79:645-654.
- [Google Scholar]
- Estimation of earthquake hazard parameters from incomplete data files. Part II. Incorporation of magnitude heterogeneity. Bull. Seismol. Soc. Am.. 1992;82(1):120-134.
- [Google Scholar]
- Active faulting in the Gulf of Aqaba. new knowledge from the Mw 7.3 Earthquake of 22 November 1995. Bull. Seismol. Soc. Am.. 1999;89:1025-1036.
- [Google Scholar]
- Seismicity of Egypt. Bulletin of National Research Institute of Astronomy and Geophysics. 1984;4:109-160.
- [Google Scholar]
- Upper lithospheric deformations in the Jordan-Dead Sea transform regime. Tectonophysics. 1988;153:153-159.
- [Google Scholar]
- Mostafa, Sh.I., Abd el-aal, A.Kh., and El-Eraki, M.A., 2018. Multi scenario seismic hazard assessment for Egypt. Journal of Seismology, 22, 669–696.
- Second-order moment of central California seismicity, 1969–82. J. Geophysical Res.. 1985;90:5479-5495.
- [Google Scholar]
- Ribot, M., Klinger, Y., Jónsson, S., Avsar, U., Pons-Branchu, E., Matrau, R., Mallon, F. L., 2021. Active Faults’ geometry in the Gulf of Aqaba, Southern Dead Sea Fault, illuminated by multibeam bathymetric data. Tectonics, 40(4), e2020TC006443.
- Seismotectonics of the Sinai subplate – the eastern Mediterranean region. Geophys. J. Int.. 2003;155:149-173.
- [Google Scholar]
- Evaluation of parameters affecting earthquake damage by decision tree techniques. Nat Hazards. 2008;47:547-568.
- [Google Scholar]
- A simple method for estimating local magnitude (ML) from body-wave magnitude (mb) Bull. Seismol. Soc. Am.. 1988;78(5):1388-1393.
- [Google Scholar]
- Stepp, J.C., 1972. Analysis of Completeness of Earthquake Sample in the Pugest Sound Area and Its Effect on Statistical Estimates of Earthquake Hazard. National Oceanic and Atmospheric Administration Environmental Research Laboratories, Boulder Colorado, 80302.
- New empirical earthquake-source scaling laws. Bull. Seismol. Soc. Am.. 2017;107(5):2225-2246.
- [Google Scholar]
- Active tectonic morphology and submarine deformation of the northern Gulf of Eilat/Aqaba from analyses of multibeam data. Geo-Mar. Lett.. 2010;30(6):561-573.
- [Google Scholar]
- Estimation of the earthquake recurrence parameters for unequal observation periods for different magnitudes. Bull. Seismol. Soc. Am.. 1980;70(4):1337-1346.
- [Google Scholar]
- Magnitude saturation of strong ground motion parameters in the near fault region. Bull. Seismol. Soc. Am.. 2006;96(6):1778-1805.
- [Google Scholar]
Appendix A
Supplementary data
Supplementary data to this article can be found online at https://doi.org/10.1016/j.jksus.2024.103114.
Appendix A
Supplementary data
The following are the Supplementary data to this article:


