

Translate this page into:
Seasonal pattern of vitamin D hydroxyl metabolite concentrations and their association with cardiac medications – An observational study
⁎Corresponding author at: at: Department of Physical Pharmacy and Pharmacokinetics, Poznan University of Medical Sciences, 3 Rokietnicka Street, 60-806 Poznan, Poland. mkaraz@ump.edu.pl (Marta Karaźniewicz-Łada)
-
Received: ,
Accepted: ,
This article was originally published by Elsevier and was migrated to Scientific Scholar after the change of Publisher.
Peer review under responsibility of King Saud University.
Abstract
Objectives
The sun is the primary source of vitamin D production, and seasonal changes can substantially influence vitamin D levels, which hardly any study has examined in cardiac patients. This research aims to measure 25(OH)D3 and 25(OH)D2 concentrations and assess their relation to the seasons and medications given to cardiac patients.
Methods
We collected 116 blood samples from 58 patients in autumn-winter and spring-summer seasons. Ultra-high-performance liquid chromatography-tandem mass spectrometry method was applied to determine 25(OH)D3 and 25(OH)D2 concentrations. The statistical assessment was performed using Statistica 13.3 with Plus Kit 3.0.
Results
Only 9% of patients had 25(OH)D3 concentrations in the recommended range of 30–50 ng/mL. We found significantly higher 25(OH)D3 average levels in spring-summer period compared with autumn-winter period (P = 0.001). Older patients had a higher risk of vitamin D deficiency in autumn-winter (OR = 1.08; P = 0.011, OR = 0.32; P = 0.015, respectively). Average 25(OH)D2 concentrations between seasons were insignificant (Z = 1.04; P = 0.3). Vitamin D deficiency was significantly correlated with administration of angiotensin-II receptor blocker (OR = 7.49; P = 0.025), steroidal antiandrogen*age (OR = 1.039; P = 0.022). Other medications did not correlate with vitamin D deficiency, 9%NaCl (OR = 0.2; P = 0.04) and thiazide (0.076; P = 0.015).
Conclusion
The prevalence of vitamin D deficiency and therapeutic drug monitoring are substantial in the observed group of cardiovascular patients, considering those with higher risk factors. Cardiac patients may benefit from vitamin D supplementation or dietary intervention to correct vitamin D levels. Further studies on more patients are required to confirm our results and identify other factors influencing 25(OH)D concentrations in cardiac patients.
Keywords
Cardiovascular disease
Vitamin D deficiency
25-hydroxyvitamin D
Seasonal variation
Vitamin D

1 Introduction
Vitamin D is a fat-soluble vitamin that functions and chemically resembles steroid hormones. It has two functionally inactive prohormones (vitamin D2 or ergocalciferol) and (vitamin D3 or cholecalciferol) (Bikle, 2014). Vitamin D2 is obtained from the diet after synthesis in the plants and fungi via ultraviolet-B (UVB) irradiation of ergosterol (Anderson, 1999). Besides, vitamin D3 can be found in dietary sources; however, it is mainly produced in the skin by 7-dehydrocholesterol stimulation in the keratinocytes by UVB irradiation from sunlight at the wavelength (230–313 nm) (Nussey and Whitehead, 2001).
The hydroxylation of vitamin D2 and D3 occurs in the liver by vitamin D 25-hydroxylase and yields the prohormones 25-hydroxyvitamin D2 (25(OH)D2) and 25-hydroxyvitamin D3 (25(OH)D3 or calcidiol). In the kidney, 1α-hydroxylase converts the prohormones into active hormones 1,25-dihydroxy vitamin D2 (1,25(OH)2D2) and 1,25-dihydroxy vitamin D3 (1,25(OH)2D3 or calcitriol). 25-hydroxyvitamin D (25(OH)D) conversion to 1,25(OH)2D (the active form of vitamin D) is being regulated by serum calcium and phosphate, plus parathyroid hormone (PTH). The serum concentrations of 25(OH)D3 are used to indicate vitamin D stores in the body (Thacher and Clarke, 2011).
There are many available sources of vitamins D2 and D3, including UVB irradiation (vitamin D3), usual dietary intakes of vitamin D3 rich foods (mainly oily fish and egg yolks), fortified foods (some dairy products, soy milk, breakfast cereals, and margarine, which generally have vitamin D2 fortification), and vitamin D2 and D3 supplements (Ross et al., 2011). It is advised to achieve 25(OH)D serum concentrations levels above 20 ng/mL (50 nmol/l) (Ross et al., 2011). Thus, to meet the vitamin D requirements of at least 97.5% of the population, Food and Nutrition Board has set Recommended Dietary Allowances for vitamin D to be 600 IU/day for ages 1–70 years and 800 IU/day for ages 71 years and older (Ross et al., 2011).
It is commonly known that the main physiologic function of vitamin D is to enhance calcium absorption to preserve sufficient calcium concentrations, which support proper bone mineralization (Khazai et al., 2008). However, the response of the body to vitamin D relies on two pathways: genomic and non-genomic. The former mechanism involves binding 1,25(OH)2D to the vitamin D receptor (VDR), which is responsible for regulating gene transcription (Berridge, 2015). VDR is omnipresent in various cells such as cardiomyocytes (Condoleo et al., 2021), vascular smooth muscle (Wu-Wong et al., 2006), and endothelium (Jamali et al., 2018). The interaction between VDR and retinoid X receptor (RXR) creates a heterodimer that attaches to the vitamin D response element (VDRE) responsible for the transcription of vitamin D-sensitive target genes (Carlberg and Molnár, 2015). Also, since VDR was found at the cellular membrane level, it might trigger rapid modifications by epigenetic mechanisms such as DNA methylation or histone modification (Saccone et al., 2015). The non-genomic mechanism can be facilitated by protein disulfide-isomerase A3 (PDIA3), VDR, or both. Vitamin D activates protein kinases such as phosphoinositide 3-kinase, calmodulin-kinase II, and protein-kinase A to mediate calcium influx via L-type voltage-gated calcium channel. The intracellular calcium activates p38 mitogen-activated protein kinases for further downstream signaling without altering gene transcription (Cui et al., 2017).
Due to the complex nature of the mechanisms mentioned above, studies investigating VDR have been trending in the previous 30 years (Abouzid et al., 2021a), and the mechanisms describing its association with various diseases are not entirely justified yet (Abouzid et al., 2018). For cardiovascular diseases (CVD), VDR can hinder endoplasmic reticulum stress and mitochondrial-dysfunction-dependent apoptosis, which lead to preventing myocardial reperfusion (Yao et al., 2015). Moreover, administering vitamin D decreases myocardial hypertrophy in streptozotocin-induced diabetic rats (Wei et al., 2017). Vitamin D inhibits β-catenin/TCF4/GSK-3β and mTOR signaling in cardiomyocytes – at the molecular level (Wei et al., 2017). The clinical evidences have shown a relationship between CVD, such as left ventricular hypertrophy (Quyyumi and Patel, 2010) and arterial stiffening (Patel et al., 2011). Additionally, vitamin D deficiency (VitDd) is correlated with increased CVD morbidity and mortality (Al Mheid and Quyyumi, 2017). A recent cohort study involving hospitalized patients with heart failure (N = 10,974) showed that vitamin D supplementation reduced in-hospital mortality rates (Kusunose et al., 2021). VitDd was also common in patients discharged to non-home facilities after admission to the hospital due to coronary heart failure, ischemic heart disease, myocardial infarction, atrial fibrillation, and transient ischemic attack (Patel et al., 2020).
2 Materials and methods
2.1 Hypothesis formulation
Many investigations focus only on measuring plasma levels of 25(OH)D as an indicator for vitamin D status assessment in individuals and its association with clinical disorders and medications (Lertratanakul et al., 2014; Nguyen et al., 2014; Shah et al., 2017; Tandeter et al., 2009). Thus, it is beneficial to quantify vitamin D metabolites to provide us with profound insights toward understanding the correlation between vitamin D and medications, especially those with the same metabolic pathway, particularly in CVD patients (Al Mheid and Quyyumi, 2017; Danik and Manson, 2012; Verdoia et al., 2015; Wang et al., 2017). Moreover, Robien et al. (2013), van Orten-Luiten et al. (2014), and Sohl et al. (2012) have identified several CVD medications that can interact with vitamin D (i.e., atorvastatin, calcium channel blockers, angiotensin-converting enzyme (ACE) inhibitors, thiazide diuretics, angiotensin-II receptor blocker (ARB), platelet aggregation inhibitors, loop diuretics, beta-blockers). Also, as sunlight at the wavelength (230–313 nm) is considered a principal source to synthesize vitamin D, we expect different seasons to considerably affect the plasma level of 25(OH)D. Consequently, this experiment aims to:
-
(1)
Identify the impact of the seasonal changes on 25(OH)D3 and 25(OH)D2 levels in CVD patients.
-
(2)
Identify the interactions of 25(OH)D3 and 25(OH)D2 with CVD medication.
2.2 Study population
Fifty-eight patients (forty-nine male and nine female, 62.9 ± 8.2 years) participated in the study. We excluded patients with malignant tumors, impaired kidney function, acute myocardial infarction, or administering vitamin D supplements.
Various lab reports were used to identify the health status of the enrolled patients, including complete blood count, lipid panel, liver panel, prothrombin time, and hemoglobin A1C. Patients' clinical conditions and medications are presented in Table 1 and Supportive/Supplementary Material (Table S1). Abbreviations: ARB - angiotensin II receptor blockers; ACE - angiotensin-converting enzyme; NSAID - non-steroidal anti-inflammatory drugs; PPI – proton pump inhibitor.
Characteristic
N (%)
Sex & demographic data
Male
49 (84)
Female
9 (16)
Age [years]
62.91 ± 8.21
Weight [kg]
83.82 ± 14.80
Height [m]
1.71 ± 0.08
BMI [kg/m2]
28.66 ± 3.83
Diagnosis
Hypertension
41 (71)
Hypercholesterolemia
34 (58)
Diabetes
21 (36)
Heart failure
6 (10)
Hyperlipidemia
4 (9)
Kidney disease
4 (7)
Medication
Antiplatelet medication
58 (100)
NSAID
58 (100)
Beta-blocker
30 (52)
Atorvastatin
20 (35)
ACE inhibitor
19 (32)
PPI
19 (32)
Rosuvastatin
15 (26)
NaCl
13 (22)
Thiazide diuretic
12 (21)
Ca Channel blocker
11 (19)
Biguanides
7 (12)
ARB
6 (10)
Ezetimibe
5 (8)
Steroidal antiandrogen
4 (7)
Cytoprotective anti-ischemic agent
4 (7)
Insulin
4 (7)
2.3 Sample collection
The blood samples (N = 116) were collected in two different seasons, autumn-winter or spring-summer. Seasonal analysis of the metabolites was performed with reference to the seasons observed in Poland (Radomski, n.d.). During the morning hours, 7:30 to 8:30, and under standard conditions, we obtained an aliquot of 5 mL of blood into ethylenediaminetetraacetic acid (EDTA) tube. Samples were centrifugated for 10 min at a speed of 1620×g for proper separation of plasma and stored at −176 °Fahrenheit (°F) until the UPLC assessment.
2.4 Determination of 25(OH)D2 and 25(OH)D3 concentrations
Vitamin D2 and vitamin D3 levels were assessed by measuring the concentration of 25(OH)D2 and 25(OH)D3, respectively, using the validated UPLC-MS/MS method developed based on our previous published assay (Abouzid et al., 2020). In brief, we mixed 200 μL of the patients' plasma with 20 μL of methanol, followed by adding 20 μL of D6-25-hydroxyvitamin D3 (internal standard) and 200 μL LC/MS grade water. After vortexing for 10 s, we added 400 μL of methanol-isopropanol solution (80:20, v/v). The solution was vortexed for 15 s to allow the complete protein precipitation. Liquid-liquid extraction was performed twice using hexane – each time, 1000 μL of hexane was followed by 3 min of mixing, then centrifugated for 10 min (3000 g, 68 °F). The organic layer was separated into clean glass vials. It was evaporated at 113 °F under vacuum, and the remaining residue was dissolved in 200 μL of methanol–water (80:20, v/v) solution. We injected only 10 μL of this final solution directly into the UPLC Nexera coupled to a triple quadrupole mass spectrometer LCMS-8030. Kinetex 2.6 μm F5 analytical column (50 mm × 2.1 mm) was used to separate the analytes. This method prevents the overestimation of 25(OH)D2 and 25(OH)D3 by separating 3-epi-25(OH)D3 – en epimeric form (Abouzid et al., 2020).
2.5 Statistical analysis
Statistica 13.3 with Plus Kit 3.0 were used to carry out the statistical assessment (TIBCO Software Inc., Tulsa, OK, USA). Shapiro-Wilk test was used as a plot option to test the normality of vitamin D levels, demographic data, and biochemical profiles. Continuous variables were summarized using descriptive statistics; normal variables were represented as mean and standard deviation (SD) and non-normal variables as the median and interquartile range (IQR). Student's t-test (paired) or Mann-Whitney U test was applied to compare the differences between two related groups such as patients administered vs. not administered drugs and plasma levels of 25(OH)D3 and 25(OH)D2 in autumn-winter vs. spring-summer periods. Kruskal Wallis test supplied with Bonferroni adjustment used for multi-group (inter-seasonal) comparison. Correlation between normally distributed continuous variables was expressed as Pearson's correlation coefficient. Otherwise, the correlation was presented as a non-parametric Spearman's rank correlation coefficient. The logistic regression and multi-factorial results were described as odds ratios (ORs) and 95% confidence interval (95% CI). A P-value < 0.05 was considered statistically significant for all tests.
The sample size for analysis of a significant difference in mean plasma 25(OH)D2 and 25(OH)D3 levels between the two seasons was calculated based on the formula:
25(OH)D3
25(OH)D2
With SD values of 7.84 ng/ml and 4.03 for 25(OH)D3 and 25(OH)D2, respectively, taken from a previous study (Karaźniewicz-Łada et al., 2018), a sample size of at least 38 and 10 participants per season were required for detecting a difference of 5 ng/mL among the two seasons (confidence level = 95%, α = 0.05; statistical power = 80%, β = 0.20).
3 Results
3.1 Vitamin D3
Vitamin D status was determined based on vitamin D3 levels; deficiency (<12 ng/mL), insufficiency (12–20 ng/mL), sufficient (>20 ng/mL) and recommended (30–50 ng/mL) (Ross et al., 2011).
25(OH)D3 average levels were significantly higher in the spring-summer than autumn-winter (14.96 (10.98–25.74) ng/mL vs. 9.12 (3.22–21.48) ng/mL, Z = 3.21; P = 0.001)). Besides, in-depth seasonal analysis shows that vitamin D3 average levels vary between the four seasons (P = 0.007). The concentrations in summer were significantly higher than in autumn and winter (P = 0.042, P = 0.029, respectively) (Fig. 1).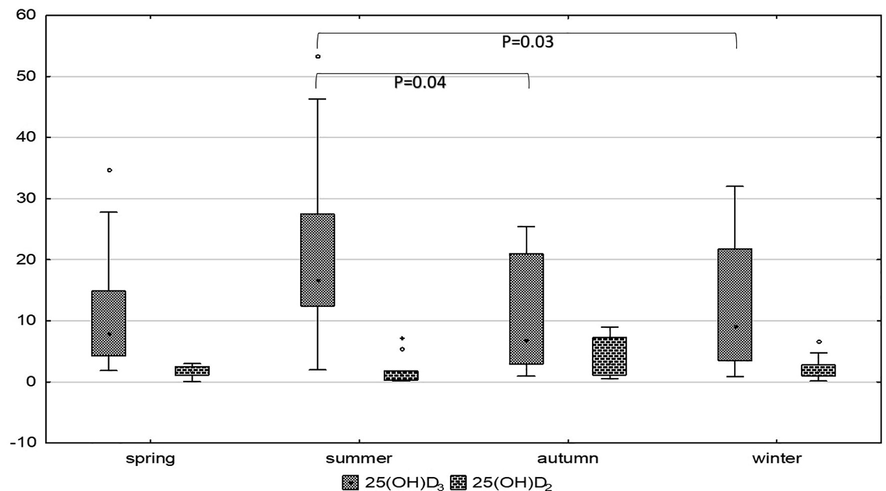
Vitamin D3 and vitamin D2 concentrations - represented by 25(OH)D3 and 25(OH)D2, respectively - among different seasons. Kruskal Wallis test supplied with Bonferroni adjustment and showed significantly high 25(OH)D3 levels in summer compared to winter (P = 0.03) and autumn (P = 0.04). 25(OH)D2 levels are numerically high in autumn without significance.
Moreover, VitDd was three times more to occur in autumn-winter (OR = 3.2; P = 0.01), and the concentrations of vitamin D were 3.5 times increased from deficient to insufficient levels in the spring-summer period (OR = 3.52; P = 0.015) (Table 2). §- Simple Logistic regression.
Intercept
Standard error
Wald chi-square
Sig.
Exp(B)
95% C.I.for EXP(B)
Lower
Upper
Heart Failure
Age
0.356
0.156
5.180
0.023
1.427
0.049
0.662
Weight*BMI
−0.080
0.038
4.582
0.032
0.923
−0.154
−0.007
Hypercholesterolemia*BMI
1.237
0.557
4.939
0.026
3.445
0.146
2.328
Weight
2.424
1.152
4.427
0.035
11.291
0.166
4.682
Hypertension
Obesity*Hypercholesterolemia
3.094
1.570
3.881
0.049
22.057
0.016
6.172
Overweight*smoking
4.511
1.324
11.605
0.001
91.004
1.916
7.106
BMI
−1.318
0.409
10.368
0.001
0.268
−2.120
−0.516
Overweight*diabetes
0.014
0.758
0.000
0.985
1.014
−1.471
1.500
Hypercholesterolemia
−2.434
0.921
6.979
0.008
0.088
−4.240
−0.628
Weight
0.138
0.067
4.317
0.038
1.148
0.008
0.269
Vitamin D insufficiency
TMX*HDL
1.689
0.698
5.865
0.015
5.417
0.322
3.057
Vitamin D deficiency
Spring-summer
−1.148
0.472
5.916
0.015
0.317
−2.072
−0.223
Age
0.072
0.031
5.271
0.022
1.075
0.011
0.134
Vitamin D deficiency & medication
NaCl
−1.609
0.778
4.278
0.039
0.2
−3.133
−0.084
Steroidal antiandrogen*Age
0.039
0.017
5.255
0.022
1.039
0.006
0.072
ARB
2.014
0.895
5.057
0.025
7.491
0.259
3.769
Thiazide diuretic
−2.575
1.054
5.972
0.015
0.076
−4.64
−0.51
Vitamin D levels in spring-summer§
Deficiency [<12 ng/mL]
−1.164
0.457
6.494
0.0108
0.312
−2.059
−0.269
Insufficiency [12–20 ng/mL]
1.257
0.518
5.882
0.0153
3.516
0.241
2.274
Sufficient [>20 ng/mL]
0.138
0.450
0.094
0.7589
1.148
−0.744
1.020
Vitamin D levels in autumn-winter§
Deficiency [<12 ng/mL]
1.164
0.457
6.494
0.0108
3.202
0.269
2.059
Insufficiency [12–20 ng/mL]
−1.257
0.518
5.882
0.0153
0.284
−2.274
−0.241
Sufficient [>20 ng/mL]
−0.138
0.450
0.094
0.7589
0.871
−1.020
0.744
3.2 Vitamin D2
25(OH)D2 average concentrations were numerically lower in spring-summer than autumn-winter, but with no significant difference (1.34 (0.45–1.81) ng/mL vs. 1.887 (1.07–3.05) ng/mL; Z = 1.04; P = 0.3). Besides, 25(OH)D2 average concentrations were comparable across the four-season analysis (Fig. 1).
3.3 Demographic
Overall, males and females had comparable 25(OH)D3 and 25(OH)D2 concentrations. Even though males had numerically higher 25(OH)D3 and 25(OH)D2 levels in autumn-winter, but the differences were not significant. Gender seasonal analysis is shown in Supportive/Supplementary Material, Table S2.
Moreover, older patients had lower 25(OH)D3 levels and this correlation was significant (R = -0.232; P = 0.03). Multi-factorial logistic regression shows that increasing age predisposes to develop VitDd in autumn-winter [OR = 1.08; 95%CI = 0.01–0.13; P = 0.011) and (OR = 0.32; 95%CI = -2.07-(-0.22); P = 0.015] respectively (Table 2).
3.4 Medications
The relationship between administered medications (Table 1) and 25(OH)D3 and 25(OH)D2 concentrations was studied. Several drugs show interaction with 25(OH)D3 levels: insulin, spironolactone, thiazide diuretics, ARB, 0.9% sodium chloride (saline or NaCl), and cytoprotective anti-ischemic agent (Trimetazidine (TMX)).
Diabetic patients (type 1) on insulin treatment seem to have lower 25(OH)D3 levels (Z = 2.57; P = 0.01). Moreover, patients administered spironolactone had lower 25(OH)D3 levels (Z = 2.37; P = 0.02). Thiazide diuretics were associated with higher 25(OH)D3 levels (Z = 2.25; P = 0.02). Finally, patients administered saline had higher 25(OH)D3 levels (Z = 2.73; P = 0.006) (Table 3). N1 – Number of patients who did not administer the medication. N2 – Number of patients administered the medication. σ – Differences were calculated using Mann-Whitney U test and data associated are described as median (IQR) and. β – Differences were calculated using independent t-test, and the associated data are described as mean ± SD.
Medications
25(OH)D3σ
25(OH)D2σ
N1
Concentrations (ng/mL)
P-value
N1
Concentrations (ng/mL)
P-value
N2
N2
Antiplatelet
5
9.43 (6.52–21.49)
0.871
2
3.29 (3.05–3.52)
0.099
71
13.33 (4.75–21.78)
46
1.37 (0.84–2.51)
NSAID
5
9.43 (6.52–21.49)
0.871
2
3.29 (3.05–3.52)
0.099
71
13.33 (4.75–21.78)
46
1.37 (0.84–2.51)
Steroidal antiandrogen
68
14.75 (6.59–22.22)
0.015
45
1.38 (0.85–2.64)
0.779
8
3.54 (2.44–9.71)
3
1.67 (0.54–1.78)
ACE inhibitor
45
14.49 ± 10.87
0.764β
30
1.65 (0.85–2.51)
0.792
31
15.25 ± 10.57
18
1.29 (0.84–2.79)
ARB
65
15.33 ± 10.21
0.207β
40
1.35 (0.7–2.63)
0.193
11
11.7 ± 13.26
8
1.76 (1.52–4.6)
Beta-blocker
21
15.19 (9.43–21.57)
0.282
12
1.85 (1.04–2.92)
0.533
55
12.47 (3.46–21.78)
36
1.5 (0.7–2.29)
Biguanides
65
12.43 (5.08–21.49)
0.521
42
1.65 (0.85–2.62)
0.891
11
16.59 (2.92–25.03)
6
1.28 (0.84–3.36)
Ca Channel blocker
58
14.27 ± 9.77
0.437β
36
1.5 (0.7–2.71)
0.897
18
16.53 ± 13.39
12
1.51 (1.15–2.22)
Cytoprotective anti-ischemic agent
69
13.33 (4.29–22.67)
0.792
44
1.5 (0.92–2.63)
0.928
7
12.78 (11.86–17.3)
4
1.15 (0.41–4.51)
Insulin
69
15.83 ± 10.62
0.007β
45
1.38 (0.85–2.62)
0.657
7
4.66 ± 3.91
3
1.78 (0.54–6.69)
NaCl
54
12 (3.46–21.15)
0.005
37
1.67 (1.07–2.64)
0.106
22
14.92 (12.15–34.81)
11
1.21 (0.17–1.74)
PPI
43
15.28 ± 10.7
0.657β
32
1.37 (0.98–2.63)
0.991
33
14.17 ± 10.79
16
1.71 (0.55–2.94)
Atorvastatin
26
13.78 ± 9.23
0.335β
18
1.69 (0.85–2.51)
0.819
35
16.6 ± 12.44
22
1.35 (0.99–2.64)
Rosuvastatin
32
17.52 ± 12.47
0.12β
19
1.35 (0.99–2.98)
0.936
29
13.05 ± 9.22
21
1.67 (0.85–2.06)
Thiazide diuretic
57
11.85 (3.63–20.85)
0.023
35
1.38 (0.85–2.64)
0.693
19
15.19 (12.44–27.49)
13
1.7 (0.55–1.81)
Ezetimibe
32
7.87 (3.47–20.45)
0.778
22
1.69 (1.07–2.64)
0.595
8
14.6 (2.65–21.67)
6
2.2 (0.56–6.69)
Besides, simple logistic regression shows that VitDd was associated with the administration of steroidal antiandrogen (OR = 5.63; P = 0.043), ARB (OR = 3.9; P = 0.041), insulin (OR = 11.5; P = 0.027). Thiazide diuretics and saline were not frequently administered in the case of vitDd (OR = 0.22; P = 0.02) and (OR = 0.25; P = 0.023), respectively. Moreover, a multi-factorial model (Table 2) was built for VitDd and previously mentioned medications and confirmed such association, especially with increased age (OR = 1.04; 95%CI = 0.006–0.072; P = 0.02). Finally, TMX*HDL (high-density lipoprotein) was (OR = 5.4; 95%CI = 0.332–3.057). Full single factor logistic regression between vitamin D levels and medication is shown in (Fig. 2). We did not observe any significant relationship between 25(OH)D2 and administered medications.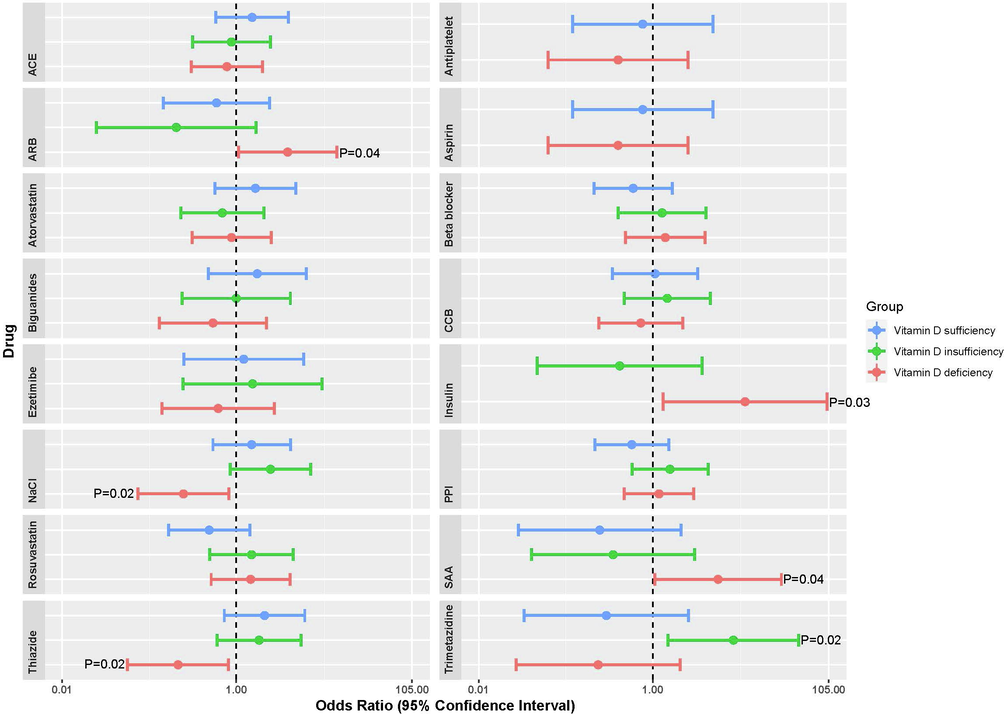
Single-factor logistic regression between 25(OH)D3 levels and medication in three groups according to 25(OH)D3 levels: deficiency (<12 ng/mL), insufficiency (12–20 ng/mL), sufficiency (>20 ng/mL). Data is presented in a forest plot showing the odds ratio (log scale) (circle) and 95% CI (horizontal line). Abbreviations: ACE - angiotensin-converting enzyme inhibitors; ARB - angiotensin II receptor blockers; CCB - calcium channel blocker; PPI -proton pump inhibitor; SAA - steroidal antiandrogen. Raw data is available at Supportive/Supplementary Material, Table S3.
4 Discussion
The study aimed to measure 25(OH)D2 and 25(OH)D3 concentrations in blood plasma and to assess their relation to the season and applied treatment of CVD patients. Despite the international guidelines suggesting a minimum vitamin D level of 20 ng/mL (Ross et al., 2011), European guidelines advise maintaining vitamin D levels between 30 and 50 ng/mL for adults and children (Płudowski et al., 2013). Thus, in our study, over half of the enrolled patients (66%) had 25(OH)D3 levels below 20 ng/mL, which indicates vitamin D insufficiency. Almost 25% of patients were in the suboptimal status as 25(OH)D3 levels were between 20 and 30 ng/mL. Only 9% of patients had optimal 25(OH)D3 levels between 30 and 50 ng/mL.
4.1 25(OH)D3 and 25(OH)D2 seasonal analysis
Our results are similar to those reported by other authors who investigated vitamin D status in different seasons despite the variation in the samples (Costanzo et al., 2011; González-Parra et al., 2012; Kashi et al., 2011; Rockell et al., 2008; Shoben et al., 2011). In this study, in the spring-summer period, 25(OH)D3 average levels were significantly higher than in autumn-winter.
In an assessment performed in Hungary on elderly patients (N = 1307) by Vásárhelyi et al. (2011), seasonal 25(OH)D levels were age-dependent; higher age group was associated with fewer differences. The elderly from 50 to 69 years have 10 ng/mL higher 25(OH)D levels in summer. Those from 70 to 89 years recorded an increase by 5 to 6 ng/mL, suggesting moderate to severe VitDd in the evaluated patients. Płudowski et al. (Płudowski et al., 2016) have investigated vitamin D status in Polish adults (N = 5775). Seasonal analysis revealed that VitDd was common among young adults, men, and participants with higher BMI during winter and spring. Similarly, the British cohort study by Hyppönen and Power (Hyppönen and Power, 2007) (N = 7437) highlighted that for 45-year adults, winter and spring seasons had the highest hypovitaminosis incidents [ 25(OH)D < 10 ng/mL (15.5%); < 16 ng/mL (46.6%); < 30 ng/mL (87.1%)]. An additional Swedish cohort study by Klingberg et al. (2015) (N = 540) declared that in the spring-summer period, the population with an average age of 41 ± 13 years had the highest 25(OH)D levels. Interestingly, they highlighted the weaker impact of vitamin D supplements on 25(OH)D levels compared to sun exposure.
Even though the above studies declared the prevalence of VitDd in the winter-spring period, results from other studies represented stable vitamin D status throughout different seasons, even in a sunny climate (Costanzo et al., 2011; González-Parra et al., 2012; Heidari et al., 2010; Kashi et al., 2011; Rajakumar et al., 2011; Rockell et al., 2008). These observational studies highlight the fact that seasonal changes are not the only factor that alters vitamin D status and extends the research scope to study other reasons contributing to altering vitamin D status, such as demographic data or socioeconomic status (Carnevale et al., 2001; Farrar et al., 2011; Macdonald et al., 2008; Shea et al., 2011). According to Hughes et al. (2011), the concentration of UVB is affected by geographic location and latitude. UVB has inadequate strength for synthesizing sufficient vitamin D in places with maximum latitude during autumn and winter, which may explain vitDd in higher latitudes regions in different seasons (Hughes et al., 2011). Moreover, during winter, people spend more time inside their houses; even if they go outside, they usually wear more clothes which may reduce the ability to synthesize vitamin D3, hence, influencing 25(OH)D concentrations over the time (Jääskeläinen et al., 2013). Vitamin D seasonal changes could also be associated with single nucleotide polymorphisms of VDR gene: ApaI (rs7975232), FokI (rs2228570) and BsmI (rs1544410) (Abouzid et al., 2021b).
In contrast to 25(OH)D3, 25(OH)D2 average levels were numerically lower in the spring-summer period than in the autumn-winter period without significant difference (Fig. 1). Thus, these results would imply that the nutritional intake of vitamin D2 varies by season in a population with measurable levels of 25(OH)D2. To our knowledge, there are no available literature records on the seasonal change of the plasma 25(OH)D2 concentrations.
4.2 Demographics
In this study, the patients aged 40–80 years with a mean of 62.91 ± 8.21 years. The higher age was significantly related to low 25(OH)D3, which may be caused by a low ability of the skin to synthesize 25(OH)D in the elderly population (Heidari et al., 2010; Shea et al., 2011). Moreover, numerically higher 25(OH)D3 and 25(OH)D2 levels were noticed in males than in females, but the differences were insignificant. Other studies with a higher number of females have confirmed that females had lower 25(OH)D concentrations which can be linked to higher bone turnover markers in winter than in summer in postmenopausal women (Carnevale et al., 2001; Levis et al., 2005; Macdonald et al., 2008; Wang et al., 2017).
4.3 Medications
Several impacts of the medications used by patients that could alter 25(OH)D levels were observed.
4.3.1 Steroidal antiandrogen
The significant relationship between 25(OH)D3 levels with steroidal antiandrogen may be explained by the drug's induction of CYP3A4-mediated metabolism of vitamin D. On the other hand, 25(OH)D3 was reported to blunt the systemic renin-angiotensin-aldosterone system (RAAS) (Carrara et al., 2014). Moreover, calcitriol in vitro directly impacts adrenal cortical NCI-H295R cells via enzymes down-regulating in the steroidogenesis pathway. 25(OH)D3 with a reduction in parathyroid hormone (PTH) could reduce the serum aldosterone in patients with heart failure regardless of significant clinical benefits (Lundqvist et al., 2010).
4.3.2 ARB
Short-term (i.e. two weeks) ARB co-treatment shows no interaction between ARB and PTH (Bislev et al., 2018). Furthermore, 12 weeks of treatment with telmisartan did not alter 25(OH)D levels in patients with hypertension (N = 31) (Pérez-Castrillón et al., 2012). However, the prolonged use of ARB was shown to significantly reduces PTH levels (Brown et al., 2014; Koiwa et al., 2012; Rossi et al., 1995). Since PTH being a primary stimulator in vitamin D synthesis (Khundmiri et al., 2016), and our patients were on ARB for more than at least 6 months, we noticed a decline in 25(OH)D3 levels in patients with ARB, and this could be due to ARB inhibitory effect on PTH levels. Current research performed by Turin et al. (Turin et al., 2018) reported that ARB benefit was attenuated in VitDd since both are involved in RAAS inhibition. This can explain such a relationship between co-treatment of ARB with VitDd (Turin et al., 2018).
4.3.3 Insulin
Insulin impact on vitamin D is not well defined. However, VitDd could contribute to developing type 1 diabetes and type 2 diabetes (Johnson et al., 1994). Vitamin D directly stimulates insulin secretion through VDR presence in β-cells of the pancreas (Bland et al., 2004) and their expression of the 1-α-hydroxylase enzyme (Johnson et al., 1994). Besides, 1,25(OH)2D3 is capable of transcriptional activation of the human insulin receptor gene; hence, it has a vital role in insulin secretion (Maestro et al., 2002). Chiu et al. (2004) and Scragg et al. (2004) noticed a correlation between insulin insensitivity and vitamin D.
4.3.4 Saline
The observed significant association between saline and 25(OH)D3 was confirmed by Cervellin et al. (2015). They observed lower vitamin D levels in clinical cases of hyponatremia. It is known that saline solution is prescribed for fluid loss treatment and restoration of sodium chloride balance (Li et al., 2016). In our study, all the patients (N = 22) who received saline had normal sodium levels (135 to 145 mmol/L) due to frequent monitoring. Moreover, according to Vaidya and Forman (2010), a loading dose of table salt was linked to increased 1,25(OH)D concentrations.
4.3.5 Thiazides
Thiazides increase calcium absorption from the luminal membrane into the interstitial in exchange for sodium (Akbari and Khorasani-Zadeh, 2020). This results in inhibition of parathyroid hormone, which decreases 1,25(OH)2D3 levels (Khundmiri et al., 2016). Thiazide impact on the renal tubules is being followed by a secondary alteration in vitamin D metabolism, hence, there is a rise in both 25(OH)D3 and 24,25-dihydroxycholecalciferol (24,25(OH)2D). Therefore, as a result of thiazide administration, overall 25(OH)D remains unchanged despite higher 25(OH)D3 (Akbari and Khorasani-Zadeh, 2020).
4.3.6 TMX
According to Sentex et al. (1998), TMX could interfere with phospholipids metabolism in the cardiac myocytes to increase phosphatidylinositol turnover and redirect cytidine triphosphate. These changes boost phospholipid levels and shift fatty acids utilization in the heart in exchange for its availability for energy production. Tuunanen et al. (2008) mentioned that treatment with TMX increased circulating lipid profile by increasing HDL cholesterol levels by 11% in CVD patients. In our study, there was a 23% increase in HDL (P = 0.024) in the group administered TMX (data not presented). Administration of TMX did not show any significant changes in 25(OH)D3 levels. Besides, no significant correlation was confirmed between HDL levels and 25(OH)D3 in this group of patients. Besides, in multi-factorial models, only the TMX*HDL relationship was confirmed (Table 2). Therefore, in our results, we cannot relate 25(OH)D3 levels to TMX co-treatment due to the low sample size.
4.4 Strength and limitations
This is the first study to report seasonal variation of 25(OH)D3 and 25(OH)D2 in cardiovascular patients, revealing a higher prevalence of vitDd during autumn-winter and highlighting the importance of vitamin D supplementation in these groups of patients. Still, there are also limitations. First, the majority of the patients were males. Second, even though the number of patients in this study has exceeded the minimum sample size, future studies should have higher numbers. Third, information on the patients' lifestyle, including physical activities, diet, or socioeconomic status, were not gathered.
5 Conclusion
Vitamin D deficiency was common in the studied CVD patients. We statistically highlighted the influence of seasonal patterns and age on 25(OH)D3 levels. Smoking, overweight, and combined diagnosis of obesity and hypercholesterolemia were primary risk factors for hypertension, whereas weight and hypercholesterolemia alongside higher BMI were the major risk factors for heart failure. Patients treated with steroidal antiandrogen and insulin had 76% and 67% lower 25(OH)D3 levels than patients who did not receive the medications, whereas those treated with saline and thiazide had higher analyte concentrations by 24% and 58%, respectively. Further experiments should be performed on a larger number of patients to confirm the results of our study and to identify other factors influencing 25(OH)D concentrations in this group of patients.
6 Data availability
The data used to support the findings of this study are included in the article.
Ethical approval
Written consent was obtained from the patients; the study was conducted according to the guidelines of the Declaration of Helsinki. The ethical approval was granted by the Bioethics Committee of Poznan University of Medical Sciences (protocol no. 273/15, date of approval: 5 March 2015 and protocol no. 58/20, date of approval 16 January 2020).
CRediT authorship contribution statement
Mohamed Abouzid: Validation, Investigation, Data curation, Writing – original draft, Writing – review & editing, Visualization, Project administration. Franciszek Główka: Writing – review & editing. Marta Karaźniewicz-Łada: Conceptualization, Methodology, Validation, Formal analysis, Investigation, Data curation, Writing – original draft, Writing – review & editing, Supervision, Project administration, Funding acquisition.
Acknowledgements
We would like to thank the anonymous editor and reviewers for their valuable feedback, which encouraged us to revamp the design of our paper.
Mr. Mohamed Abouzid is a participant of STER Internationalization of Doctoral Schools Programme from NAWA Polish National Agency for Academic Exchange No. PPI/STE/2020/1/00014/DEC/02.
The abstract of this study was presented at the 16th Warsaw International Medical Congress in the Pharmacy session and was awarded second place.
Conflict of interest
The authors declare that they have no competing interests.
Sources of funding
We are grateful to Poznan University of Medical Sciences for funding this research.
Declaration of Competing Interest
The authors declare that they have no known competing financial interests or personal relationships that could have appeared to influence the work reported in this paper.
References
- Trend research of vitamin D receptor: bibliometric analysis. Health Informatics J.. 2021;27
- [CrossRef] [Google Scholar]
- Genetic determinants of vitamin D-related disorders; focus on vitamin D receptor. Curr. Drug Metab.. 2018;19:1042-1052.
- [CrossRef] [Google Scholar]
- Measurement of plasma 25-hydroxyvitamin D2, 25-hydroxyvitamin D3 and 3-epi-25-hydroxyvitamin D3 in population of patients with cardiovascular disease by UPLC-MS/MS method. J. Chromatogr. B. 2020;1159:122350
- [CrossRef] [Google Scholar]
- Vitamin D receptor gene polymorphism and vitamin D status in population of patients with cardiovascular disease—a preliminary study. Nutrients. 2021;13:3117.
- [CrossRef] [Google Scholar]
- Akbari, P., Khorasani-Zadeh, A., 2020. Thiazide Diuretics, in: StatPearls. StatPearls Publishing, Treasure Island (FL).
- Vitamin D and cardiovascular disease. J. Am. Coll. Cardiol.. 2017;70:89-100.
- [CrossRef] [Google Scholar]
- Nutrition and bone health, with particular reference to calcium and vitamin D. J. Hum. Nutr. Diet.. 1999;12:469-470.
- [CrossRef] [Google Scholar]
- Vitamin D cell signalling in health and disease. Biochem. Biophys. Res. Commun., Ca and Metabolism- A Tribute to Dr. Ernesto Carafoli. 2015;460:53-71.
- [CrossRef] [Google Scholar]
- Vitamin D metabolism, mechanism of action, and clinical applications. Chem. Biol.. 2014;21:319-329.
- [CrossRef] [Google Scholar]
- Effects of treatment with an angiotensin 2 receptor blocker and/or vitamin D3 on parathyroid hormone and aldosterone: a randomized, placebo-controlled trial. Clin. Endocrinol. (Oxf.). 2018;89:656-666.
- [CrossRef] [Google Scholar]
- Expression of 25-hydroxyvitamin D3–1α-hydroxylase in pancreatic islets. J. Steroid Biochem. Mol. Biol.. 2004;89–90:121-125.
- [CrossRef] [Google Scholar]
- Human interventions to characterize novel relationships between the renin-angiotensin-aldosterone system and parathyroid hormone. Hypertens. Dallas Tex. 2014;1979:273-280.
- [CrossRef] [Google Scholar]
- Vitamin D receptor signaling and its therapeutic implications: Genome-wide and structural view. Can. J. Physiol. Pharmacol.. 2015;93:311-318.
- [CrossRef] [Google Scholar]
- Longitudinal evaluation of vitamin D status in healthy subjects from southern Italy: seasonal and gender differences. Osteoporos. Int.. 2001;12:1026-1030.
- [CrossRef] [Google Scholar]
- Cholecalciferol administration blunts the systemic renin–angiotensin system in essential hypertensives with hypovitaminosis D. J. Renin Angiotensin Aldosterone Syst.. 2014;15:82-87.
- [CrossRef] [Google Scholar]
- Association of hyponatremia and hypovitaminosis D in ambulatory adults. J. Med. Biochem.. 2015;34:450-454.
- [CrossRef] [Google Scholar]
- Hypovitaminosis D is associated with insulin resistance and β cell dysfunction. Am. J. Clin. Nutr.. 2004;79:820-825.
- [CrossRef] [Google Scholar]
- Role of Vitamin D in cardiovascular diseases. Endocrines. 2021;2:417-426.
- [CrossRef] [Google Scholar]
- Ultraviolet radiation impact on seasonal variations of serum 25-hydroxy-vitamin D in healthy young adults in Buenos Aires. Medicina (Mex.). 2011;71:336-342.
- [Google Scholar]
- Vitamin D and the brain: Genomic and non-genomic actions. Mol. Cell. Endocrinol., Endocrine functions of Vitamin D. 2017;453:131-143.
- [CrossRef] [Google Scholar]
- Vitamin d and cardiovascular disease. Curr. Treat. Options Cardiovasc. Med.. 2012;14:414-424.
- [CrossRef] [Google Scholar]
- Recommended summer sunlight exposure amounts fail to produce sufficient vitamin D status in UK adults of South Asian origin. Am. J. Clin. Nutr.. 2011;94:1219-1224.
- [CrossRef] [Google Scholar]
- High prevalence of winter 25-hydroxyvitamin D deficiency despite supplementation according to guidelines for hemodialysis patients. Clin. Exp. Nephrol.. 2012;16:945-951.
- [CrossRef] [Google Scholar]
- Association between nonspecific skeletal pain and vitamin D deficiency. Int. J. Rheum. Dis.. 2010;13:340-346.
- [CrossRef] [Google Scholar]
- The role of latitude, ultraviolet radiation exposure and vitamin D in childhood asthma and hayfever: an Australian multicenter study. Pediatr. Allergy Immunol.. 2011;22:327-333.
- [CrossRef] [Google Scholar]
- Hypovitaminosis D in British adults at age 45 y: nationwide cohort study of dietary and lifestyle predictors. Am. J. Clin. Nutr.. 2007;85:860-868.
- [CrossRef] [Google Scholar]
- Vitamin D status is associated with sociodemographic factors, lifestyle and metabolic health. Eur. J. Nutr.. 2013;52:513-525.
- [CrossRef] [Google Scholar]
- Vitamin D and regulation of vascular cell function. Am. J. Physiol.-Heart Circ. Physiol.. 2018;314:H753-H765.
- [CrossRef] [Google Scholar]
- Immunohistochemical localization of the 1,25(OH)2D3 receptor and calbindin D28k in human and rat pancreas. Am. J. Physiol.-Endocrinol. Metab.. 1994;267:E356-E360.
- [CrossRef] [Google Scholar]
- Karaźniewicz-Łada, M., Główka, A., Komosa, A., Kruszyna, Ł., Graczyk-Szuster, A., Lesiak, M., Sowińska, D., Przysławski, J., 2018. Analysis of retinol, α -tocopherol, 25-hydroxyvitamin D2 and 25-hydroxyvitamin D3 in plasma of patients with cardiovascular disease by HPLC-MS/MS method. Biomed. Chromatogr. 32, e4278. https://doi.org/10.1002/bmc.4278.
- Kashi, Z., Saeedian, F. sima, Akha, O., Gorgi, M. ali H., Emadi, S. fatemeh, Zakeri, H., 2011. Vitamin D deficiency prevalence in summer compared to winter in a city with high humidity and a sultry climate. Endokrynol. Pol. 62, 249–51.
- Calcium and vitamin D: skeletal and extraskeletal health. Curr. Rheumatol. Rep.. 2008;10:110-117.
- [Google Scholar]
- Seasonal variations in serum 25-hydroxy vitamin D levels in a Swedish cohort. Endocrine. 2015;49:800-808.
- [CrossRef] [Google Scholar]
- Influence of renin–angiotensin system on serum parathyroid hormone levels in uremic patients. Clin. Exp. Nephrol.. 2012;16:130-135.
- [CrossRef] [Google Scholar]
- Association between Vitamin D and heart failure mortality in 10,974 hospitalized individuals. Nutrients. 2021;13:335.
- [CrossRef] [Google Scholar]
- 25-hydroxyvitamin D and cardiovascular disease in patients with systemic lupus erythematosus: data from a large international inception cohort. Arthritis Care Res.. 2014;66:1167-1176.
- [CrossRef] [Google Scholar]
- Vitamin D deficiency and seasonal variation in an adult South Florida population. J. Clin. Endocrinol. Metab.. 2005;90:1557-1562.
- [CrossRef] [Google Scholar]
- 0.9% saline is neither normal nor physiological. J. Zhejiang Univ. Sci. B. 2016;17:181-187.
- [Google Scholar]
- 1α,25-Dihydroxyvitamin D3 affects hormone production and expression of steroidogenic enzymes in human adrenocortical NCI-H295R cells. Biochim. Biophys. Acta BBA – Mol. Cell Biol. Lipids. 2010;1801:1056-1062.
- [CrossRef] [Google Scholar]
- Vitamin D status in postmenopausal women living at higher latitudes in the UK in relation to bone health, overweight, sunlight exposure and dietary vitamin D. Bone. 2008;42:996-1003.
- [CrossRef] [Google Scholar]
- Transcriptional activation of the human insulin receptor gene by 1,25-dihydroxyvitamin D 3. Cell Biochem. Funct.. 2002;20:227-232.
- [CrossRef] [Google Scholar]
- 25-Hydroxyvitamin D in the range of 20 to 100 ng/mL and incidence of kidney stones. Am. J. Public Health. 2014;104:1783-1787.
- [CrossRef] [Google Scholar]
- Endocrinology: An Integrated Approach (1st ed.). Oxford: BIOS Scientific Publishers; 2001.
- Oxidative stress is associated with impaired arterial elasticity. Atherosclerosis. 2011;218:90-95.
- [CrossRef] [Google Scholar]
- Prevalence and outcomes associated with Vitamin D deficiency among indexed hospitalizations with cardiovascular disease and cerebrovascular disorder-a nationwide study. Med. Basel Switz.. 2020;7:E72.
- [CrossRef] [Google Scholar]
- Telmisartan effect’s on remodelling bone markers in hypertensive patients. Nutr. Hosp.. 2012;27:276-280.
- [CrossRef] [Google Scholar]
- Practical guidelines for the supplementation of vitamin D and the treatment of deficits in Central Europe - recommended vitamin D intakes in the general population and groups at risk of vitamin D deficiency. Endokrynol. Pol.. 2013;64:319-327.
- [Google Scholar]
- Endothelial dysfunction and hypertension: cause or effect? Endothelial dysfunction and hypertension. Hypertension. 2010;55:1092-1094.
- [CrossRef] [Google Scholar]
- Radomski, M., n.d. Weather and Seasons of the Year in Poland [WWW Document]. URL https://polish-dictionary.com/poland-weather-seasons (accessed 1.3.19).
- Impact of season and diet on vitamin D status of African American and Caucasian children. Clin. Pediatr. (Phila.). 2011;50:493-502.
- [CrossRef] [Google Scholar]
- Drug-vitamin D interactions: a systematic review of the literature. Nutr. Clin. Pract. Off. Publ. Am. Soc. Parenter. Enter. Nutr.. 2013;28:194-208.
- [CrossRef] [Google Scholar]
- Vitamin D insufficiency in New Zealanders during the winter is associated with higher parathyroid hormone concentrations: implications for bone health? N. Z. Med. J.. 2008;121:75-84.
- [Google Scholar]
- The 2011 report on dietary reference intakes for calcium and vitamin D from the Institute of Medicine: what clinicians need to know. J. Clin. Endocrinol. Metab.. 2011;96:53-58.
- [CrossRef] [Google Scholar]
- Alterations of calcium metabolism and of parathyroid function in primary aldosteronism, and their reversal by spironolactone or by surgical removal of aldosterone-producing adenomas. Am. J. Hypertens.. 1995;8:884-893.
- [CrossRef] [Google Scholar]
- Regulation of the vitamin D receptor gene by environment, genetics and epigenetics. Gene. 2015;561:171-180.
- [CrossRef] [Google Scholar]
- Serum 25-hydroxyvitamin D, diabetes, and ethnicity in the Third National Health and Nutrition Examination Survey. Diabetes Care. 2004;27:2813-2818.
- [Google Scholar]
- Is the cytoprotective effect of trimetazidine associated with lipid metabolism? Am. J. Cardiol.. 1998;82:18K-24K.
- [CrossRef] [Google Scholar]
- Serum 25-hydroxyvitamin D insufficiency in search of a bone disease. J. Clin. Endocrinol. Metab.. 2017;102:2321-2328.
- [CrossRef] [Google Scholar]
- Correlates and prevalence of insufficient 25-hydroxyvitamin D status in Black and White Older adults: the health, aging and body composition study. J. Am. Geriatr. Soc.. 2011;59:1165-1174.
- [CrossRef] [Google Scholar]
- Seasonal variation in 25-hydroxyvitamin D concentrations in the cardiovascular health study. Am. J. Epidemiol.. 2011;174:1363-1372.
- [CrossRef] [Google Scholar]
- The impact of medication on vitamin D status in older individuals. Eur. J. Endocrinol.. 2012;166:477-485.
- [CrossRef] [Google Scholar]
- Serum 25-OH vitamin D levels in patients with fibromyalgia Biomarkers in fibromyalgia Development and validation of the self-administered Fibromyalgia Assessment Status: a disease-specific composite measure for evaluating treatment effect. Isr Med Assoc J. 2009;11:339-342.
- [Google Scholar]
- Interactions among Vitamin D, atrial fibrillation, and the renin-angiotensin-aldosterone system. Am. J. Cardiol.. 2018;122:780-784.
- [CrossRef] [Google Scholar]
- Trimetazidine, a metabolic modulator, has cardiac and extracardiac benefits in idiopathic dilated cardiomyopathy. Circulation. 2008;118:1250-1258.
- [CrossRef] [Google Scholar]
- Vitamin D and hypertension: current evidence and future directions. Hypertension. 2010;56:774-779.
- [CrossRef] [Google Scholar]
- The association between drugs frequently used by the elderly and vitamin D blood levels: a review of observational and experimental studies. Drugs Aging. 2014;31:111-123.
- [CrossRef] [Google Scholar]
- Low vitamin D levels among patients at Semmelweis University: retrospective analysis during a one-year period. Orv. Hetil.. 2011;152:1272-1277.
- [CrossRef] [Google Scholar]
- Impact of gender difference on vitamin D status and its relationship with the extent of coronary artery disease. Nutr. Metab. Cardiovasc. Dis.. 2015;25:464-470.
- [CrossRef] [Google Scholar]
- 1,25-Dihydroxyvitamin-D3 prevents the development of diabetic cardiomyopathy in type 1 diabetic rats by enhancing autophagy via inhibiting the β-catenin/TCF4/GSK-3β/mTOR pathway. J. Steroid Biochem. Mol. Biol.. 2017;168:71-90.
- [CrossRef] [Google Scholar]
- Effects of Vitamin D analogs on gene expression profiling in human coronary artery smooth muscle cells. Atherosclerosis. 2006;186:20-28.
- [CrossRef] [Google Scholar]
- Vitamin D receptor activation protects against myocardial reperfusion injury through inhibition of apoptosis and modulation of autophagy. Antioxid. Redox Signal.. 2015;22:633-650.
- [CrossRef] [Google Scholar]
Appendix A
Supplementary data
Supplementary data to this article can be found online at https://doi.org/10.1016/j.jksus.2022.102187.
Appendix A
Supplementary data
The following are the Supplementary data to this article:


