

Translate this page into:
Screening of chickpea genotypes for boron biofortification potential
⁎Corresponding author at: Department of Agronomy, Bahauddin Zakariya University, Multan, Pakistan. mubashiragr@gmail.com (Mubshar Hussain)
-
Received: ,
Accepted: ,
This article was originally published by Elsevier and was migrated to Scientific Scholar after the change of Publisher.
Peer review under responsibility of King Saud University.
Abstract
Background
Malnutrition is a significant threat to mankind and deficiency of important minerals like boron (B) exert negative impacts on human health mostly in developing and least developed countries. Chickpea is an important legume with wide consumption in human diet due to easily digestible dietary protein and grown. Chickpea is mostly grown in arid and semi-arid regions of Pakistan. The B-deficiency in these areas not only decreases chickpea productivity, but also results lowers B concentration in grains. Different chickpea genotypes are capable of perform differently due to their divergent genetic makeup under stressful environmental conditions. Therefore, this field study screened different chickpea genotypes to improve yield and B biofortification.
Methods
For this purpose 20 ‘desi’ (i.e., ‘TG-1430’, ‘Parbat’, ‘TG-1616’, ‘TG-1620’, ‘05A028’, ‘TG-1601’, ‘TG-1623’, ‘Thal-2006’, ‘TG-1218’, ‘TG-1513’, ‘Chattan’, ‘BK-2011’, ‘TG-1500’, ‘NIAB-2016’, ‘GGP-1456’, ‘TG-1618’, ‘TG-1619’, ‘Bittle-2016’, ‘TG-1415’ and ‘Punjab-2008’) and 06 ‘kabuli’ (i.e., ‘TGK-228’, ‘TGK-1767’, ‘TGK-1802’, ‘NOOR-2009’, ‘TGK-1761’ and ‘TGK-1805’) chickpea genotypes were sown under 0 or 1 kg B ha−1 as soil application.
Results
Results indicated that B application improved the growth, nodulation, yield and grains B concentrations of all genotypes; however, genotype significantly differed in their response. Of the 20 ‘desi’ genotypes ‘Punjab-2008’ recorded the highest leaf area index, leaf area duration, crop growth rate, nodulation, yield and related traits under B application. However, genotypes ‘BK-2011’, ‘TG-1500’ and ‘NIAB-2016’ had higher grains B content under 1 kg ha−1 B application. Similarly, ‘kabuli genotypes’, i.e., ‘TGK-1761’ and ‘TGK-1802’ recorded higher nodulation, while ‘NOOR-2009’ had higher leaf area index, leaf area duration, crop growth rate, 1000-grain weight, grain yield and biological yield with 1 kg ha−1 B application compared to the rest of the ‘kabuli’ genotypes included in the study. The highest grain B concentration was recorded for ‘TGK-1767’ among ‘kabuli’ genotypes.
Conclusion
In conclusion, ‘desi’ genotype ‘Punjab-2008’ and ‘kabuli’ genotype ‘NOOR-2009’ should be grown under 1 kg ha−1 B application to get higher productivity and B biofortification. The genotypes which accumulated more B in their seeds should be included in future breeding programs to produce B-rich grains for reducing malnutrition.
Keywords
Genotypes
Biofortification
Grain yield
Nodulation
Grains boron concentration

1 Introduction
Malnutrition is a significant threat to mankind and affects >50% of the population of the world. Mostly pregnant women, and the kids below five-years age suffer from malnutrition, particularly in developing countries (Alloway, 2008; Ritchie and Roser, 2017). Micronutrients are equally important as macronutrients and required in very minute amount (Kalsoom et al., 2020; Nadeem et al., 2020). Boron (B) deficiency is critical among all micronutrients’ deficiencies, and regarded as a leading cause of a number of diseases in children residing in the developing countries (Hussain et al., 2020). Boron deficiency has been reported from ∼80 countries which exerts negative impacts on >132 plant species (Brestic et al., 2021; Hossain et al., 2021; Hua et al., 2016). The B-deficiency is mostly observed in calcareous soils that exerts negative effects on crop yields (Rashid et al., 2011; Waraich et al., 2011). Most of the Pakistani soils are calcareous in nature and deficient in micronutrients, particularly B (Rashid and Ryan, 2004). The B-deficiency status in Pakistani soils is alarming as 65% of the soils are B-deficient (Rashid and Ryan, 2004).
Boron is an essential micronutrient, structural component of plant cell wall, and plays an important role in the integrity of membrane in plants (Bassil et al., 2004; Maitra et al., 2021; Qureshi et al., 2021). It also plays an important role in transportation, photosynthetic activity and metabolism of indole acetic acid (Dordas and Brown, 2000; Hussain et al., 2012; Wang et al., 2007). Several studies reported that B application through different methods increased yield of different crops, including chickpea (Cicer arietinum L.) (Mehboob et al., 2022, 2021), cotton (Gossypium hirsutum L.) (Atique-ur-Rehman et al., 2020; Roberts et al., 2000), rice (Oryza sativa L.) (David et al., 2005; Rashid and Ryan, 2004), sunflower (Helianthus annus L.) (Ariraman et al., 2020; Ceyhan et al., 2008) and mungbean (Vigna radiata L.) (Laxmi et al., 2020). Boron is required in less amount; hence, the range between B-deficiency and toxicity is extremely narrow (Yau and Ryan, 2008). The B-deficiency disrupts biochemical, physiological, and cellular functions of plants which cause malnutrition problems and impairs plant growth. Boron-deficiency is mostly observed in reproductive stage of plants rather than vegetative stage and affects flowering, pollination, fruit setting, seed setting and grain filling (Islam et al., 2017). However B-deficiency in wheat (Triticum aestivum L.) increased number of open spikelets and decrease number of grains per spike which negatively affected grain setting (Tahir et al., 2009). The B-toxicity has been reported to negativelt affect crop production in arid and semi-arid regions of the world (Ahmad et al., 2013; Çatav et al., 2018). Boron application at higher level (toxicity) proved toxic for growth and productivity of chickpea (Hussain et al., 2020).
Chickpea is an annual grain legume grown in arid and semi-arid regions in Pakistan. It is a good source of easily digestible dietary proteins (22–28%), and contains significant amount of carbohydrates, fats, crude fiber and minerals (Foyer et al., 2016). The ‘kabuli’ and ‘desi’ chickpea genotypes are mostly grown around the world. The total cultivated area under ‘desi’ genotypes is 80–85%, while the remaining 15–20% area is cultivated with ‘kabuli’ genotypes in indo-Pakistan region. Chickpea requires very low amount of water; thus, arid, and semi-arid regions are optimum for its cultivation. Biofortification is the technique of integrating minerals into edible parts of crops. It offers a justifiable and economic way of increasing the density of minerals/micronutrients in important staple crops (Hossain et al., 2021; Mehboob et al., 2021). Addition of nutrients in edible parts of plants will help to control malnutrition and improve food quality (Mao et al., 2014; White and Broadley, 2009). Soil application of B at sowing may improve chickpea growth, nodulation and productivity (Mehboob et al., 2021). Soil application of B significantly improved physiological parameters and fiber quality of cotton (Atique-ur-Rehman et al., 2020).
All crops and their varieties may vary in the ability to uptake B from soils. This variation is primarily directed by their genetic structure, although environmental conditions and plant morphology also play their role in this variation. Therefore, this field study was designed to screen the available chickpea germplasm (both ‘desi’ and ‘kabuli’ genotypes) to find the most responsive genotypes for B uptake and translocations to grains. All collected germplasm was sown with and without B application to evaluate the effect of B on growth, nodulation, yield, and grain-B concentration. The better performing genotypes (both ‘desi’ and ‘kabuli’) will be further evaluated under different B application methods to determine the most reliable approach of getting higher chickpea yield and grain-B contents.
2 Materials and methods
2.1 Plant material
Seeds of 26 frequently cultivated chickpea genotypes, i.e., ‘TGK-1767’, ‘TGK-1802’, ‘NOOR-2009’, ‘TGK-1761’, ‘TGK-1805’, ‘TGK-228’, ‘TG-1430’, ‘Parbat’, ‘TG-1616’, ‘TG-1620’, ‘05A028’, ‘TG-1601’, ‘TG-1623’, ‘Thal-2006’, ‘TG-1218’, ‘TG-1513’, ‘Chattan’, ‘BK-2011’, ‘TG-1500’, ‘NIAB-2016’, ‘GGP-1456’, ‘TG-1618’, ‘TG-1619’, ‘Bittle-2016’, ‘TG-1415’ and ‘Punjab-2008’ were obtained from Arid Zone Research Institute (AZRI), Bakkhar, Pakistan and used in the study. Six genotypes, i.e., ‘TGK-1767’, ‘TGK-1761’, ‘TGK-1805’, ‘TGK-228’, ‘TGK-1802’ and ‘NOOR-2009’ were ‘kabuli’, while rest of the genotypes were ‘desi’. Boric acid (Merck, Germany, 17% B) was used as B source and applied at the time of sowing.
2.2 Description of experimental site
This study was conducted at Bahauddin Zakariya University, Bahadur Sub Campus, Layyah, Pakistan during Rabi season of 2018–2019. Before sowing, soil analysis was performed to assess the initial soil fertility status. Soil was sandy-loam with 3.54 dS m−2 EC, 8.00 pH, 30.0% saturation percentage, 0.57% organic matter, 5.40 mg kg−1 available phosphorus, 130.00 mg kg−1 available potassium and 0.57 mg kg−1 available B.
2.3 Experimental details
Seeds of all chickpea genotypes were sown on well-prepared seedbed under two B application levels, i.e., 0 and 1 kg B ha−1. Boric acid was used as a source of B. The experiment was laid out according to randomized complete block design with factorial arrangement. Boron levels were kept in the main plots, whereas genotypes were randomized in sub plots. All treatment had three replications with a net plot size of 4.0 m × 1.8 m.
2.4 Crop husbandry
Pre-soaking irrigation (locally called rouni) of 10 cm was applied to bring soil under optimum moisture level for seedbed preparation. When soil reached to workable moisture level, seedbed was prepared by cultivating the field two times with tractor drawn cultivator followed by planking. Chickpea was sown on November 01, 2018 by hand drill using seed rate of 80 kg ha−1 in 45 cm spaced rows. Before sowing 40 kg ha−1 nitrogen (N) and 80 kg ha−1 phosphorous (P) was applied using urea and triple superphosphate as sources of N and P, respectively. In total 4 irrigations were applied to fulfill moisture needs of chickpea. Weeds were controlled manually. All agronomic practices were uniform from sowing to harvesting. Mature crop was harvested on April 10, 2019.
2.5 Data collection
2.5.1 Growth attributes
To measure leaf area index (LAI) and crop growth rate (CGR), plants from 1 m2 area were harvested at 45 days after sowing (DAS) and second data were recorded at 90 DAS. Leaves were detached from the stem and their area was measured by using leaf area meter (DT Area Meter, Model MK2, Delta T Devices, Cambridge, UK). The LAI was computed by the formula given by Watson (1947).
Fresh weight of the plants harvested from 1 m2 was measured by using weight balance and then samples were dried under sunlight for 48 h. After sun drying the samples were oven-dried at 70 °C for 72 h under thermostatic blast drying oven. Afterwards, oven-dried samples were weighed. The formula given by Hunt, (1982) was used to calculate CGR.
Here W2 is dry weight at 90 DAS while W1 is dry weight taken at 45 DAS. Moreover, t2 and t1 are the time interval during both data.
Leaf area duration was calculated by using Hunt (1982) suggested formula.
LAI2 and LAI1 are leaf area index at 90 DAS and 45 DAS where t2 − t1 are time interval during both data.
Net assimilation rate (NAR) was calculated by using following formula of Beadle (1985). where TDM = total dry matter.
2.5.2 Yield traits
When crop reached at harvest maturity, 10 plants were harvested randomly from each genotype to record yield-related traits. Plant height was measured with a measuring tape and averaged. The nodules population was counted from each plant and averaged to record number of nodules per plant. For number of branches and pods per plant, number of branches and pods on each plant were counted carefully and averaged. The pods were threshed manually, and 1000 grains from each experimental unit were counted and weight to record 1000-grain weight. The plants from 1 m2 area were harvested, pods were removed and threshed manually to calculate grain yield. These yield was then converted into tones ha−1. All remaining plant parts were put under shade for sun drying for 48 h. After complete drying, the samples were weighed, and grain weight was added to record biological yield m2. Harvest index was taken as:
2.5.3 Grains boron analysis
For B analysis, grains sample was collected at harvest. Grain samples were dried in oven at 70 °C. Afterwards, 1 g sample from each treatment was taken in a porcelain crucible and kept in muffle at 550 °C for 6 h. Extraction of ashed samples was done by 10 ml of 0.36 N H2SO4 for 1 h. Extracted samples were then filtered with Whatman Number 1 filter paper and transferred in 50 ml plastic transparent bottles and volume was made 50 ml by adding distilled water. The buffer solution (ammonium acetate 250 ml, EDTA 15 ml dissolve in 400 ml distill water and then add slowly 125 ml acetic acid) and azomethine solution containing (azomethine-H 0.45 g and L-ascorbic acid 1 g in 100 ml water) were added to the filterate. The filtrate of 1 ml extracted solution was mixed with 2 ml of buffer solution and 2 ml of azomethine-H solution. This solution was kept for 45 min to develop color and the B concentration in each sample was recorded by spectrophotometer at 420 nm.
2.6 Statistical analysis
The data were checked for homogeneity of variance and normality. The collected data were subjected to two-way analysis of variance (ANOVA) to check the overall significance of data by using statistical package Statistix 8.1 (Analytical Software, USA). However, the difference among treatments means were compared using least significant difference (LSD) test at 95% probability level (Steel et al., 1997).
3 Results
Chickpea genotypes, B application and their interaction had highly significant effect on LAI, LAD, CGR and NAR, whereas interactive effect remained non-significant for CGR (Table 1). Overall, ‘desi’ genotypes recorded higher LAI, LAD, CGR and NAR during whole growing season than ‘kabuli' genotypes. With respect to B application, B applied at 1 kg ha−1 responded positively and increased LAI, LAD and CGR against no B application (Figs. 1–3). The ‘desi’ genotype ‘Punjab-2008’ and ‘kabuli’ genotype ‘NOOR-2009’ recorded higher LAI and LAD with 1 kg B ha−1 application compared to the rest of ‘desi’ and ‘kabuli’ genotypes at 45 and 90 DAS (Figs. 1 and 2). Moreover, ‘Thal-2006’ recorded higher NAR 1 kg B ha−1 application compared to the rest of the genotypes (Fig. 3). Here, SOV = source of variation, df = degree of freedom, SS = sum of squares, MS = mean squares, NS = non-significant, * = significant (p ≤ 0.05).
Plant height (cm)
Number of nodules per plant
SOV
df
SS
MS
P value
SS
MS
P value
Chickpea genotypes (V)
25
1088.92
43.56
0.0000*
1548.41
61.94
0.0210*
Boron levels (B)
1
519.91
519.91
0.0000*
407.08
407.08
0.0008*
V × B
25
414.03
16.56
0.0040*
1328.26
53.13
0.0665NS
Number of branches per plant
Number of pods per plant
Chickpea genotypes (V)
25
61.46
2.46
0.0166*
915.81
36.62
0.0000*
Boron levels (B)
1
38.61
38.61
0.0000*
641.89
641.89
0.0000*
V × B
25
60.54
2.42
0.0189*
948.10
37.92
0.0000*
1000 grains weight (g)
Grain yield (t ha−1)
Chickpea genotypes (V)
25
4298.0
171.9
0.0000*
3.65
0.14
0.0002*
Boron levels (B)
1
18734.8
18734.8
0.0000*
4.18
4.18
0.0000*
V × B
25
726.8
29.1
0.0007*
1.00
0.04
0.7979NS
Biological yield (t ha−1)
Harvest index (%)
Chickpea genotypes (V)
25
18.36
0.73
0.0000*
43.54
1.74
0.1894NS
Boron levels (B)
1
23.41
23.41
0.0000*
24.17
24.17
0.0001*
V × B
25
4.66
0.19
0.5786NS
36.47
1.46
0.3809NS
B grain contents (mg kg−1)
Leaf area duration (day)
Chickpea genotypes (V)
25
5633.9
225.4
0.0000*
3066.51
122.66
0.0000*
Boron levels (B)
1
68467.5
68467.5
0.0000*
478.24
478.24
0.0000*
V × B
25
2473.0
98.9
0.0000*
266.84
10.67
0.0000*
Leaf area index at 45 DAS
Leaf area index at 90 DAS
Chickpea genotypes (V)
25
7.80
0.31
0.0000*
7.60
0.30
0.0000*
Boron levels (B)
1
1.56
1.56
0.0000*
0.87
0.87
0.0000*
V × B
25
0.84
0.03
0.0000*
0.57
0.23
0.0000*
Crop growth rate (g m−2 day−1)
Net assimilation rate (g m−2 day−1)
Chickpea genotypes (V)
25
0.19
0.008
0.0000*
2.38
0.09
0.0000*
Boron levels (B)
1
0.05
0.05
0.0000*
0.129
0.19
0.0000*
V × B
25
0.03
0.001
0.9643NS
0.41
0.02
0.0132*
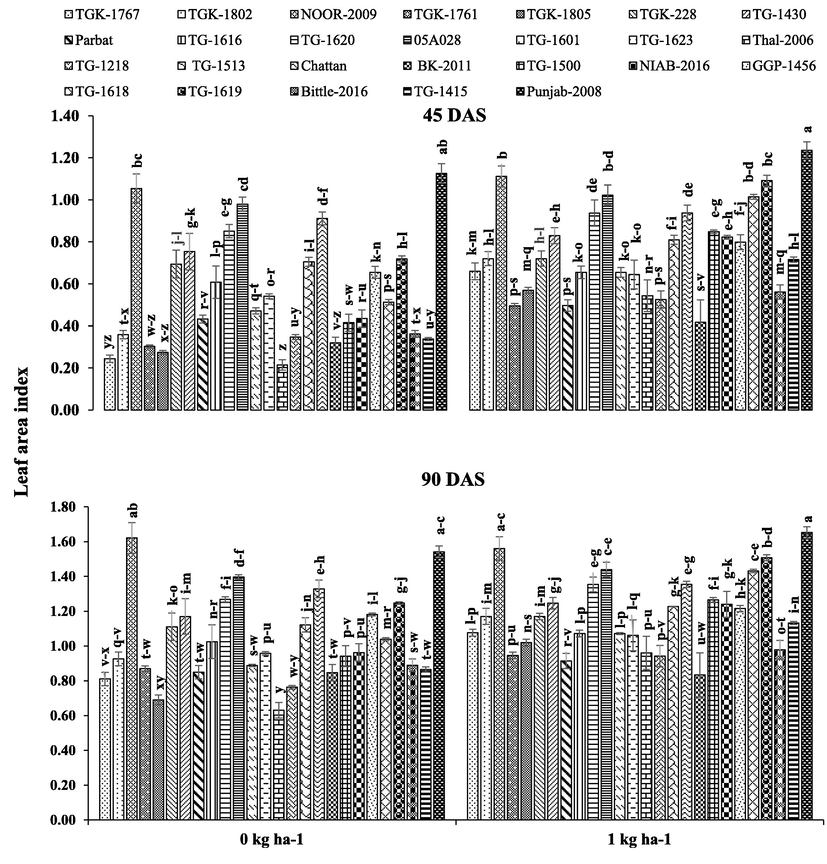
Effect of boron application on leaf area index of different chickpea genotypes ± SE. Here, DAS = days after sowing.
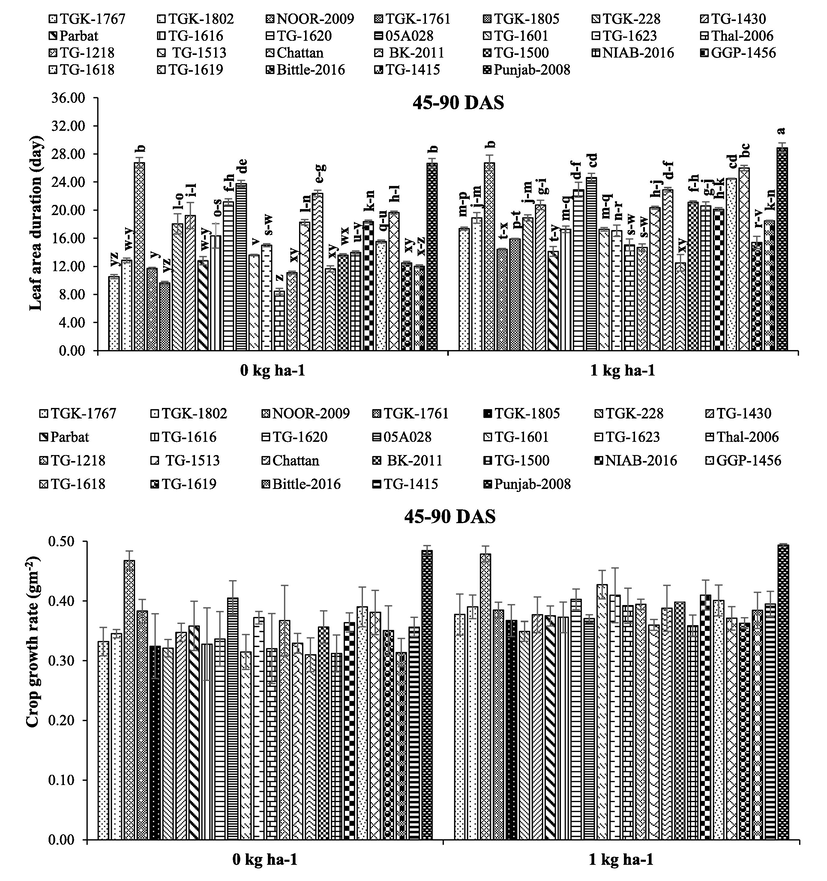
Effect of boron application on leaf area duration (day) and crop growth rate (g m−2 day−1) of different chickpea genotypes ± SE. Here, DAS = days after sowing.
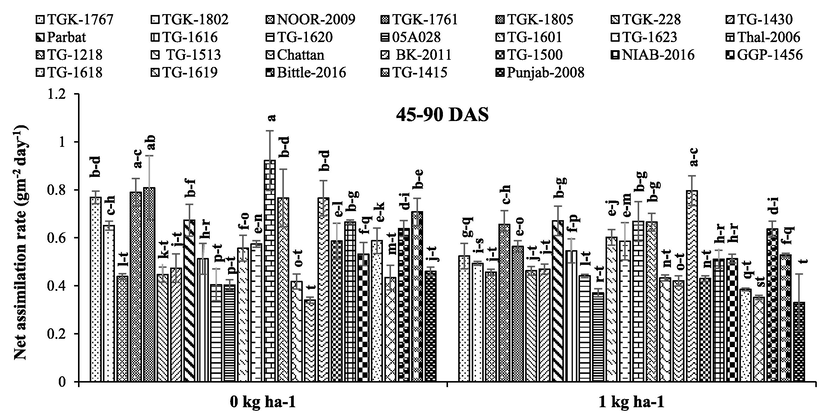
Effect of boron application on net assimilation rate (g m−2 day−1) of different chickpea genotypes ± SE. Here, DAS = days after sowing.
Genotypes and B application had highly significant effect on plant height and number of nodules per plant. However, interactive effect was significant for plant height and non-significant for number of nodules per plant (Table 1). Boron application improved plant height and number of nodules of all genotypes with varying degree (Table 2). Among ‘desi’ genotypes ‘Bittle-2016’ and ‘Punjab-2008’ resulted in the longest plant height with B application, while the shortest plant height was recorded for genotype ‘TG-1415’ grown without B application and it was statistically at par with genotypes ‘TGK-228’, ‘05A028’, ‘TG-1623’, ‘Thal-2006’, ‘TG-1218’, ‘TG-1513’, ‘Chattan’ and ‘NIAB-2016’ (Table 1). Among ‘kabuli’ genotypes, ‘TGK-1761’ and ‘TGK-228’ resulted in the highest and the lowest plant height, respectively grown with and without B application (Table 1). Likewise, ‘desi’ genotypes ‘TG-1616’, ‘TG-1601’, ‘05A028’, ‘Chattan’, ‘Bittle-2016’ and ‘Punjab-2008’ with B application recorded higher number of nodules per plant compared to the rest of the genotypes and B application treatments (Table 2). However, ‘kabuli’ genotypes ‘TGK-1761’, ‘TGK-1802’ and ‘NOOR-2009’ with or without B application observed higher number of nodules per plant and ‘TGK-228’ grown without B resulted in poor nodulation (Table 2). Means sharing different letters, within a column or row, differ significantly for each trait from each other at P ≤ 5%.
Chickpea genotypes
Plant height (cm)
Number of nodules per plant
Boron levels (kg ha−1)
0.00
1.00
Means
0.00
1.00
Means
TGK-1767
47.55 k-n
55.22 c-f
51.39 C-I
21.33
17.67
19.50 AB
TGK-1802
50.50 g-m
54.23 c-h
52.37 C-H
17.00
17.67
17.33 A-C
NOOR-2009
51.37 d-l
50.93 e-l
51.15 E-I
16.67
16.67
16.67 A-E
TGK-1761
51.63 d-k
57.37 bc
54.50 BC
17.67
16.67
17.17 A-D
TGK-1805
50.78 f-m
52.67 d-i
51.72 C-I
12.67
8.33
10.500 D-F
TGK-228
47.73 k-n
51.67 d-k
49.70 G-I
5.00
15.33
10.17 EF
TG-1430
50.29 h-m
52.91 c-i
51.60 C-I
15.33
15.33
15.33 A-F
Parbat
53.07 c-i
54.80 c-g
53.93 B-E
15.33
17.67
16.50 A-E
TG-1616
51.84 d-k
53.00 c-i
52.42 C-G
13.67
29.00
21.33 A
TG-1620
51.29 d-l
51.28 d-l
51.28 D-I
23.67
16.00
19.83 AB
05A028
46.39 mn
51.27 d-l
48.83 I
19.00
21.67
20.33 AB
TG-1601
51.29 d-l
51.87 d-k
51.58 C-I
17.00
21.00
19.00 AB
TG-1623
48.11 j-n
53.09 c-i
50.60 F-I
13.67
15.00
14.33 B-F
Thal-2006
49.49 i-n
47.89 j-n
48.69 I
15.00
18.33
16.67 A-E
TG-1218
47.11 l-n
50.56 g-m
48.83 I
19.00
15.33
17.17 A-D
TG-1513
48.89 i-n
53.18 c-i
51.03 E-I
11.33
19.33
15.33 A-F
Chattan
48.89 i-n
49.56 i-n
49.22 HI
9.67
20.67
15.17 A-F
BK-2011
52.99 c-i
51.58 d-l
52.28 C-H
6.67
11.33
9.00 F
TG-1500
51.47 d-l
52.62 d-i
52.04 C-H
13.67
19.00
16.33 A-E
NIAB-2016
47.44 k-n
52.33 d-j
49.89 G-I
12.33
17.00
14.67 A-F
GGP-1456
51.11 d-l
61.58 ab
56.34 AB
15.33
18.00
16.67 A-E
TG-1618
51.57 d-l
57.33 bc
54.45 B-D
17.67
15.67
16.67 A-E
TG-1619
51.91 d-k
55.44 cd
53.68 B-F
9.67
12.33
11.00 C-F
Bittle-2016
54.17 c-h
63.60 a
58.88 A
10.00
24.00
17.00 A-D
TG-1415
45.44 n
55.30 c-e
50.37 G-I
19.67
19.00
19.33 AB
Punjab-2008
55.367 c-e
61.33 ab
58.35 A
12.67
26.67
19.67 AB
Means for B
50.29 B
53.95 A
14.64 B
17.87 A
LSD value at 5% B = 0.88, V = 3.18, V × B = 4.50
LSD at 5% B = 1.86, V = 6.71
Chickpea genotypes, B application and their interaction had significant effect on number of branches and number of pods per plant (Table 1). Boron application improved the number of branches and number of pods of all genotypes and genotypes behaved differently (Table 3). Among ‘desi’ genotypes ‘Punjab-2008’, ‘Chattan’, ‘TG-1500’, ‘NIAB-2016’ and ‘GGP-1456’ recorded higher number of branches per plant compared with B application compared to the rest of the genotypes grown with or without B. However, all ‘kabuli’ genotypes recorded similar number of branches per plant with or without B application (Table 3). Moreover, ‘desi’ genotypes ‘Punjab-2008’ and ‘Bittle-2016’ with B application recorded higher number of pods per plant, while genotypes ‘TG-1601’, ‘TG-1623’ and ‘05A028’ recorded the lowest number of pods per plant with B application (Table 3). Means sharing different letters, within a column or row, differ significantly for each trait from each other at P ≤ 5%.
Chickpea genotypes
Number of branches per plant
Number of pods per plant
Boron levels (kg ha−1)
0.00
1.00
Means
0.00
1.00
Means
TGK-1767
4.45 f-l
4.33 g-l
4.39 F
41.00 f-j
45.33 c-g
43.167 E-H
TGK-1802
3.67 j-l
4.22 g-l
3.94 EF
38.67 h-k
44.44 d-g
41.555 GH
NOOR-2009
5.55 c-i
4.11 g-l
4.83 B-F
43.89 d-h
45.77 c-g
44.833 B-G
TGK-1761
4.22 g-l
3.56 kl
3.89 EF
46.22 c-f
44.67 d-g
45.445 B-F
TGK-1805
5.00 c-l
4.00 g-l
4.50 C-F
35.44 k
44.99 d-g
40.217 H
TGK-228
3.67 j-l
5.44 c-j
4.55 C-F
42.56 e-i
44.69 d-g
43.623 D-H
TG-1430
4.67 d-l
4.00 g-l
4.33 C-F
48.22 cd
44.24 d-g
46.233 B-E
Parbat
4.45 f-l
3.89 h-l
4.19 C-F
46.67 c-e
46.55 c-e
46.612 B-E
TG-1616
4.22 g-l
4.55 e-l
4.39 C-F
43.78 d-h
50.56 bc
47.167 A-D
TG-1620
3.67 j-l
4.33 g-l
4.00 D-F
47.33 c-e
48.67 b-d
48.00 A-C
05A028
3.78 i-l
4.67 d-l
4.22 C-F
40.67 g-k
48.00 cd
44.33 C-G
TG-1601
3.22 l
4.11 g-l
3.66 F
36.33 jk
47.33 c-e
41.83 F-H
TG-1623
4.45 f-l
5.22 c-k
4.83 B-F
38.67 h-k
48.44 cd
43.55 D-H
Thal-2006
3.78 i-l
6.22 a-f
5.00 B-E
41.00 f-j
44.67 d-g
42.83 E-H
TG-1218
4.22 g-l
5.66 c-h
4.94 B-F
47.00 c-e
48.00 cd
48.00 A-C
TG-1513
3.56 kl
4.66 d-l
4.11 D-F
45.78 c-g
47.33 c-e
44.33 C-G
Chattan
4.22 g-l
6.67 a-c
5.44 A-C
45.33 c-g
44.24 d-g
47.00 A-D
BK-2011
4.89 c-l
4.55 e-l
4.55 C-F
48.55 cd
48.22 cd
48.39 AB
TG-1500
4.56 e-l
6.33 a-e
4.39 C-F
48.67 b-d
47.11 c-e
47.89 A-C
NIAB-2016
4.11 g-l
6.44 a-d
5.28 A-D
46.67 c-e
48.33 cd
47.50 A-C
GGP-1456
4.33 g-l
7.56 ab
5.94 AB
45.67 c-g
48.33 cd
47.00 A-D
TG-1618
3.55 kl
4.89 c-l
4.22 C-F
42.56 e-i
48.33 cd
45.44 B-F
TG-1619
3.56 kl
6.22 a-f
4.89 B-F
48.33 cd
47.78 c-e
47.22 A-D
Bittle-2016
4.44 f-l
5.44 c-j
4.94 B-F
37.22 i-k
54.00 ab
48.05 A-C
TG-1415
4.00 g-l
5.78 b-g
4.89 B-F
43.67 d-h
50.67 bc
47.17 A-D
Punjab-2008
4.55 e-l
7.78 a
6.33 A
47.00 c-e
57.223 a
50.50 A
Means for B
4.18 B
5.18 A
43.73 B
47.78 A
LSD at 5% B = 0.09, V = 0.34, V × B = 0.48
LSD at 5% B = 1.06, V = 3.81, V × B = 5.39
Chickpea genotypes, B application and their interaction had significant effect on 1000-grain weight and grain yield of chickpea except for non-significant of interaction on grain yield (Table 1). Boron application improved 1000-grain weight and grain yield of all genotypes with varying degree (Table 4). Among ‘desi’ genotype ‘Punjab-2008’ and ‘kabuli’ genotype ‘NOOR-2009’ recorded higher 1000-grain weight grown with B application (Table 4). Moreover, ‘desi’ genotypes ‘Bittle-2016’ and ‘TG-1619’ with B application produced higher yield than all other genotypes, while ‘BK-2011’ and ‘TG-1620’ produced the lowest yield without B application (Table 4). Among ‘kabuli’ genotypes, ‘NOOR-2009’ recorded higher grain yield with B application (Table 4). Among ‘desi’ genotypes, ‘Punjanb-2008’ with B application recorded the highest grain yield and it was at par with ‘Bittle-2016’ and ‘TG-1619’, whereas ‘NOOR-2009’ ‘kabuli’ genotype with B application recorded higher grain yield compared to the rest of the ‘kabuli’ genotypes (Table 4). Means sharing different letters, within a column or row, differ significantly for each trait from each other at P ≤ 5%.
Chickpea genotypes
1000-grain weight (g)
Grain yield (t ha−1)
Boron (kg ha−1)
0.00
1.00
Means
0.00
1.00
Means
TGK-1767
428.47 op
445.00 e-k
436.73 C-H
2.41
2.77
2.59 D-G
TGK-1802
418.77 tu
438.03 mn
428.40 L
2.43
2.73
2.58 D-G
NOOR-2009
439.90 k-m
458.50 b
449.20 A
2.78
3.03
2.90 AB
TGK-1761
420.90 r-u
444.97 e-k
432.93 H-K
2.34
2.63
2.49 FG
TGK-1805
418.53 tu
446.30 d-j
432.42 I-K
2.24
2.67
2.45 G
TGK-228
428.21 op
446.27 d-j
437.24 C-F
2.27
2.70
2.53 E-G
TG-1430
418.60 tu
447.97 d-h
433.28 G-K
2.68
2.97
2.82 B-D
Parbat
427.30 o-q
447.03 d-j
437.17 C-G
2.33
2.93
2.63 C-G
TG-1616
428.23 op
448.73 d-f
438.48 CD
2.34
2.90
2.62 C-G
TG-1620
421.00 r-u
442.67 h-m
431.83 J-L
2.50
2.87
2.68 B-G
05A028
425.93p-r
444.00 f-l
434.97 C-J
2.72
2.90
2.81 B-D
TG-1601
427.17 o-q
450.07 c-e
438.62 C
2.62
2.80
2.71 B-G
TG-1623
425.63 p-r
443.63 f-l
434.63 D-J
2.69
2.77
2.73 B-F
Thal-2006
427.23 o-q
443.63 f-l
435.43 C-J
2.41
2.83
2.62 C-G
TG-1218
427.07 pq
442.03 i-m
434.55 E-J
2.50
2.90
2.70 B-G
TG-1513
420.90 r-u
446.03 d-j
433.47 F-K
2.67
2.97
2.82 B-D
Chattan
425.30 p-r
443.00 g-m
434.15 E-K
2.31
2.93
2.62 C-G
BK-2011
419.20 s-u
444.97 e-k
432.08 J-L
2.43
2.81
2.62 C-G
TG-1500
418.93 tu
441.70 j-m
430.32 KL
2.57
2.88
2.72 B-F
NIAB-2016
416.93 u
450.70 cd
433.82 F-K
2.37
2.82
2.67 B-G
GGP-1456
422.17 q-u
444.80 e-l
433.48 F-K
2.33
2.90
2.58 D-G
TG-1618
423.60 p-t
446.67 d-j
435.13 C-J
2.63
2.90
2.77 B-E
TG-1619
427.50 o-q
448.33 d-g
437.92 C-E
2.90
2.87
2.88 BC
Bittle-2016
432.67 no
455.40 bc
444.03 B
2.83
3.00
2.92 AB
TG-1415
424.57 p-s
447.43 d-i
436.00 C-I
2.73
2.90
2.82 B-D
Punjab-2008
439.33 lm
466.03 a
452.68 A
3.07
3.27
3.17 A
Means for B
425.16 B
447.07 A
2.54 B
2.87 A
LSD value at 5% B = 1.08, V = 3.90, V × B = 5.52
LSD at 5% V = 0.27, B = 0.07
Chickpea genotypes and B application had significant effect on biological yield and harvest index, while their interaction had non-significant effect (Table 1). Boron application improved biological yield of all genotypes (Table 5). Among ‘desi’ genotypes ‘Punjab-2008’ observed higher biological yield than all other genotypes (Table 5). Similarly, among ‘kabuli’ genotypes, ‘NOOR-2009’ recorded higher biological yield, whereas ‘TGK-1767’ produced the lowest biological yield (Table 5). The B application at 1 kg ha−1 resulted in higher biological yield compared with no B application. Regarding interactions, ‘Punjab-2008’ with B application recorded the highest biological yield among ‘desi’ genotypes, while ‘NOOR-2009’ had the highest biological yield with B application among ‘kabuli’ genotypes (Table 5). The lowest biological yield was recorded for ‘Parbat’ among ‘desi’ genotypes, ‘TGK-1767’ produced the lowest biological yield among ‘kabuli’ genotypes (Table 5). Among desi genotypes, ‘TG-1601’ and ‘05A028’ observed higher harvest index, whereas ‘TGK-1767’ recorded highest harvest index among ‘kabuli’ genotypes (Table 5). Means sharing different letters, within a column or row, differ significantly for each trait from each other at P ≤ 5%.
Chickpea genotypes
Biological yield (t ha−1)
Harvest index (%)
Boron levels (kg ha−1)
0.00
1.00
Means
0.00
1.00
Means
TGK-1767
6.85
7.80
7.33 E-H
35.21
35.45
35.33
TGK-1802
6.88
7.76
7.32 E-H
35.20
35.16
35.18
NOOR-2009
7.59
8.58
8.09 B
36.66
35.33
35.99
TGK-1761
6.79
7.51
7.15 GH
34.30
35.03
34.67
TGK-1805
6.50
7.63
7.07 H
34.36
34.96
34.66
TGK-228
6.81
7.74
7.27 F-H
34.38
34.90
34.64
TG-1430
7.38
8.20
7.79 B-E
36.23
36.15
36.19
Parbat
6.84
8.14
7.49 D-H
33.69
36.02
34.85
TG-1616
6.70
8.07
7.39 E-H
34.83
35.93
35.38
TG-1620
7.02
8.00
7.51 D-H
35.54
35.81
35.67
05A028
7.46
8.07
7.76 B-F
36.2
35.93
36.18
TG-1601
7.26
7.87
7.56 C-H
35.84
35.57
35.71
TG-1623
7.65
7.80
7.73 B-F
35.06
35.44
35.25
Thal-2006
7.09
7.90
7.49 D-H
33.95
35.86
34.90
TG-1218
7.26
8.06
7.66 B-G
34.39
35.94
35.16
TG-1513
7.60
8.24
7.92 B-D
35.04
35.99
35.52
Chattan
6.88
8.13
7.50 D-H
33.38
36.10
34.79
BK-2011
7.14
7.89
7.51 D-H
34.04
35.57
34.81
TG-1500
7.41
8.02
7.72 B-F
34.62
35.83
35.23
NIAB-2016
7.01
8.22
7.62 B-G
33.76
36.17
34.96
GGP-1456
6.93
7.90
7.42 D-H
33.58
35.63
34.61
TG-1618
7.55
8.07
7.81 B-E
34.83
35.93
35.38
TG-1619
8.10
8.03
8.07 BC
35.80
35.66
35.73
Bittle-2016
7.93
8.18
8.05 BC
35.73
36.68
36.21
TG-1415
7.74
8.07
7.90 B-D
35.30
35.93
35.62
Punjab-2008
8.41
9.03
8.72 A
36.46
36.18
36.32
Means for B
7.26 B
8.04 A
35.74 A
34.95 B
LSD at 5% B = 0.14, V = 0.52
LSD at 5% B = 0.37
Chickpea genotypes, B application and their interaction had significant effect on grains B concentration (Table 1). Boron application improved grain B concentrations of all genotypes and genotypes significantly differed in this regard (Table 5). Among ‘desi’ genotypes, ‘TG-1500’, ‘Chattan’, ‘05A028’, ‘TG-1620’ and ‘NIAB-2016’ recorded higher grain B concentration (Table 6). Among ‘kabuli’ genotypes, ‘TGK-1767’ recorded the highest grain B concentration (Table 6). Regarding interaction, ‘TG-1500’, ‘BK-2011’ and ‘NIAB-2016’ with B application recorded the highest grain B concentration among ‘desi’ genotypes, while ‘TGK-1767’ and ‘TGK-228’ with B supplementation had higher grain B contents among all ‘kabuli’ genotypes (Table 6). Means sharing different letters, within a column or row, differ significantly for each trait from each other at P ≤ 5%.
Chickpea genotypes
Grains boron concentrations (mg kg−1)
Boron (kg ha−1)
0.00
1.00
Means
TGK-1767
2.81 v
57.62 d-g
30.22 G-J
TGK-1802
8.60 q-v
50.13 g-i
29.37 H-J
NOOR-2009
7.96 r-v
38.57 j
23.27 K
TGK-1761
5.18 uv
55.05 e-h
30.11 G-J
TGK-1805
18.45 k-o
55.91 d-h
37.18 C-E
TGK-228
19.95 k-n
60.83 b-e
40.39 B-E
TG-1430
7.96 r-v
48.63 hi
30.44 G-J
Parbat
12.03 n-u
48.84 hi
35.04 E-H
TG-1616
14.81 n-t
55.27 e-h
36.86 D-F
TG-1620
9.67 p-v
64.04 a-d
35.25 E-G
05A028
7.75 s-v
62.76 a-e
37.61 C-E
TG-1601
16.52 l-q
58.69 c-f
27.97 I-K
TG-1623
5.61 uv
50.34 g-i
28.94 I-K
Thal-2006
7.53 s-v
50.34 g-i
25.40 JK
TG-1218
7.32 t-v
43.49 ij
34.93 E-H
TG-1513
24.87 k
44.99 ij
42.64 A-D
Chattan
24.66 kl
60.62 b-e
42.74 A-C
BK-2011
18.02 k-o
67.47 ab
42.75 A-C
TG-1500
24.66 kl
70.89 a
47.77 A
NIAB-2016
23.37 k-m
66.40 a-c
44.88 AB
GGP-1456
15.67 m-s
58.26 c-g
36.96 C-F
TG-1618
16.10 m-r
59.97 b-e
38.03 C-E
TG-1619
11.39 o-u
63.83 a-d
37.61 C-E
Bittle-2016
11.39 o-u
51.20 f-i
31.29 F-I
TG-1415
15.31 m-t
44.99 ij
30.15 G-J
Punjab-2008
17.59 k-p
55.48 e-h
36.54 EF
Means of B
13.66 B
55.56 A
LSD at 5% B = 1.60 , V=5.79 , V × B = 8.18
4 Discussion
The results the current study supported our hypothesis that B application significantly improved growth, nodulation, yield related traits and grain B concentration (Figs. 1–3, Tables 1–6). All genotypes responded differently under B availability and genetic makeup is thought to be responsible for this response. Equal amount of B was applied to each genotype; however, their response varied to a great extent. Ceyhan et al. (2007) unveiled that chickpea genotypes had varying response to supplementation because of their divergent genetic makeup. More B application improved grain B concentration of all tested genotypes (Table 6).
Boron is an essential element and undoubtedly plays structural role in cell walls and the maintenance of plasma membrane functions, sugar transport, carbon-fixation, lignification, ribose nucleic acid metabolism and indole acetic acid metabolism (Flores et al., 2017). Application of B considerably enhanced LAI, LAD, CGR and NAR which boosted the productivity of chickpea (Figs. 1–3). Leaf area index is important factor of growth rate and yield which is an alternative for the measurement of photosynthesis. Boron was applied at sowing, so it was expected to influence growth traits, especially LAI, LAD and CGR (Figs. 1–3). Boron application before vegetative stage resulted in higher LAI through improved LAD (Al-Amery et al., 2011). With respect to ‘desi’ genotypes, ‘Punjab-2008’ recorded higher LAI, LAD and CGR, whereas in ‘kabuli’ genotypes ‘NOOR-2009’ had higher values of these traits (Figs. 1–3). Leaf area is considered as main part of photosynthesis and directly affects photosynthesis rate. According to Yamori et al. (2016), photosynthesis rate directly depends on chlorophyll content and leaf area index, which ultimately enhanced grain yield and dry matter production. Chickpea plants observed reduction in LAI, LAD and dry weight under no B application which resulted in lower photosynthetic rate and reduced production (Figs. 1–3). Under drought conditions, photosynthesis rate and water status is improved by B application (Lu et al., 2014).
Boron application significantly improved plant height, nodulation, number of grains per plant and 1000-grain weight leading to higher grain yield. Bayrak et al. (2005) reported that B application in B‐deficient soils has significant effect on number of pods per plant in chickpea. Sarker et al. (2002) reported that B application 1000-grain weight in soybean (Glycine max L.). Oosterhuis and Zhao (2001) stated that B is very important for germination and development of pollen tube, seed maturity, richness of floret, anther growth and plasma membrane encouragement. Nutrient and water availability during vegetative stage helps in biomass accumulation. Results of this study reported that ‘desi’ genotypes, especially ‘Punjab-2008’ had higher plant height, branches, and pods per plant under B application compared to other genotypes which might be due to more nodulation (Tables 2–3).
Boron application enable plants to produce a greater number of pods, nodules, and quality grains because it plays active role in assimilated partitioning and transport (Zohaib et al., 2018). Better movement of assimilates from source to sink, improved pollen fertility and grains development are the major role of B in plants. Therefore, chickpea yield-related traits were improved under B application. Application of B improved number of nodules (18%), branches (19%), number of pods (8.5%) and 1000 grain weight (5%) as compared to no B application (Tables 2–4). Due to increase in all yield-related traits under B application, chickpea grain yield and biological yield were increased by 11.5% and 10% respectively. Boron application also improved grain B concentration in plants by ∼75% which fulfil the requirement of B in grains and mitigate the malnutrition problem (Table 6). According to Hussain et al. (2020), biofortification of B economically increased gains/pod and 1000-grain weight in chickpea.
When assimilate move easily, plants produce higher net returns because of their utilization. Ceyhan et al. (2008) revealed that soil application of boron at 7.5 kg B ha−1 increased grain yield and plant height not only in 1st year but the positive effect was also visible on next year. Boron application improved total dry matter by three times in B-deficient plants than in B-sufficient plants (Asad et al., 2003). Soil application of B along with Bacillus sp. MN54 inoculation substantially augmented number of pods plant−1 (38%), nodulation (81%) and grain yield (47%) compared with control treatment (Mehboob et al., 2021).
All crops and varieties may vary in their ability to uptake B from soils. This variation is primarily directed by their genetic structure, although environmental issues and plant morphology play a certain role in this variation. In this study, ‘Punjab-2008’ ‘desi’ genotypes and ‘NOOR-2009’ ‘kabuli’ genotype showed better response to B application. These genotypes recorded higher productivity due to notable expansion in nodulation, number of pods and 1000-grain weight. Observing the amount of B in eatable portions of cereals and pulses both by B and no B application may be helpful for the screening of B enriched varieties. Biofortification is an only option today to reduce the effect of malnutrition by entering the essential minerals to our diet.
5 Conclusions
Chickpea genotypes (desi and kabuli) had different response to soil application of B. From 20 ‘desi’ genotypes, ‘Punjab-2008’ recorded higher nodulation, pods per plant, 1000-grain weight, grain yield and B-grain concentration with B application. In case ‘kabuli’ genotypes, ‘NOOR-2009’ observed higher nodulation, 1000-grain weight grain and biological yields with B application. In conclusion, desi genotype ‘Punjab-2008’ and ‘kabuli’ genotype ‘NOOR-2009’ are better option to increase chickpea growth, nodules population, productivity, and grain concentration under B application.
Acknowledgement
The authors extend their appreciation to the Researchers supporting project number (RSP-2021/247) King Saud University, Riyadh, Saudi Arabia.
Declaration of Competing Interest
The authors declare that they have no known competing financial interests or personal relationships that could have appeared to influence the work reported in this paper.
References
- A review on therapeutic potential of Nigella sativa: A miracle herb. Asian Pac. J. Trop. Biomed.. 2013;3:337-352.
- [CrossRef] [Google Scholar]
- Effect of boron foliar application on reproductive growth of sunflower (Helianthus annuus L.) Int. J. Agron.. 2011;2011:1-5.
- [CrossRef] [Google Scholar]
- Micronutrient deficiencies in global crop production. Springer Science & Business Media; 2008.
- Effect of boron application on growth, yield parameters, yield, quality, nutrient uptake and economics of sunflower. IJCS. 2020;8:512-516.
- [Google Scholar]
- Effects of boron foliar applications on vegetative and reproductive growth of sunflower. Ann. Bot.. 2003;92:565-570.
- [Google Scholar]
- Atique-ur-Rehman, Qamar, R., Hussain, A., Sardar, H., Sarwar, N., Javeed, H.M.R., Maqbool, A., Hussain, M., 2020. Soil applied boron (B) improves growth, yield and fiber quality traits of cotton grown on calcareous saline soil. PLoS One 15, e0231805. https://doi.org/10.1371/journal.pone.0231805.
- Use of phenylboronic acids to investigate boron function in plants. Possible role of boron in transvacuolar cytoplasmic strands and cell-to-wall adhesion. Plant Physiol.. 2004;136:3383-3395.
- [Google Scholar]
- Effects on yield and some yield components of boron application in chickpea (Cicer arietinum L.) varieties. Selcuk Univ. J. Fac. Agric.. 2005;19:66-74.
- [Google Scholar]
- Beadle, C.L., 1985. Plant growth analysis, in: Techniques in Bioproductivity and Photosynthesis. Elsevier, pp. 20–25.
- Crop photosynthesis for the twenty-first century. Photosynth. Res.. 2021;150:1-3.
- [CrossRef] [Google Scholar]
- Effect of Boron Toxicity on Oxidative Stress and Genotoxicity in Wheat (Triticum aestivum L.) Bull. Environ. Contam. Toxicol.. 2018;100:502-508.
- [CrossRef] [Google Scholar]
- Response of chickpea cultivars to application of boron in boron-deficient calcareous soils. Commun. Soil Sci. Plant Anal.. 2007;38:2381-2399.
- [CrossRef] [Google Scholar]
- Effects of application boron on yields, yield component and oil content of sunflower in boron-deficient calcareous soils. African J. Biotechnol.. 2008;7:2854-2861.
- [Google Scholar]
- Boron fertilization of rice with soil and foliar applications. Crop Manag.. 2005;4:1-7.
- [Google Scholar]
- Permeability of boric acid across lipid bilayers and factors affecting it. J. Membr. Biol.. 2000;175:95-105.
- [Google Scholar]
- Flores, R.A., Silva, R.G. da, Cunha, P.P. da, Damin, V., Abdala, K. de O., Arruda, E.M., Rodrigues, R.A., Maranhão, D.D.C., 2017. Economic viability of Phaseolus vulgaris (BRS Estilo) production in irrigated system in a function of application of leaf boron. Acta Agric. Scand. Sect. B—Soil Plant Sci. 67, 697–704.
- Neglecting legumes has compromised human health and sustainable food production. Nat. Plants. 2016;2:16112.
- [CrossRef] [Google Scholar]
- Selenium biofortification: roles, mechanisms, responses and prospects. Molecules. 2021;26:881.
- [CrossRef] [Google Scholar]
- Transcriptomics-assisted quantitative trait locus fine mapping for the rapid identification of a nodulin 26-like intrinsic protein gene regulating boron efficiency in allotetraploid rapeseed. Plant. Cell Environ.. 2016;39:1601-1618.
- [CrossRef] [Google Scholar]
- Hunt, R., 1982. Plant growth analysis. Institute of Terrestrial Ecology.
- Boron application improves growth, yield and net economic return of rice. Rice Sci.. 2012;19:259-262.
- [CrossRef] [Google Scholar]
- Optimizing boron seed coating level and boron-tolerant bacteria for improving yield and biofortification of chickpea. J. Soil Sci. Plant Nutr.. 2020;20:2471-2478.
- [CrossRef] [Google Scholar]
- Yield and yield contributing characters of mungbean as influenced by zinc and boron. Agric. Adv.. 2017;6:391-397.
- [Google Scholar]
- Biological importance of microbes in agriculture, food and pharmaceutical industry: A review. Innovare J. Life Sci.. 2020;8:1-4.
- [Google Scholar]
- Growth and Yield Response of Mungbean as Influenced by Sulphur and Boron Application. Int. J. Curr. Microbiol. App. Sci. 2020;9:2788-2794.
- [Google Scholar]
- Effects of boron deficiency on major metabolites, key enzymes and gas exchange in leaves and roots of Citrus sinensis seedlings. Tree Physiol.. 2014;34:608-618.
- [CrossRef] [Google Scholar]
- Bioinoculants—natural biological resources for sustainable plant production. Microorganisms. 2021;10:51.
- [CrossRef] [Google Scholar]
- Using agronomic biofortification to boost zinc, selenium, and iodine concentrations of food crops grown on the loess plateau in China. J. soil Sci. Plant Nutr.. 2014;14
- [CrossRef] [Google Scholar]
- Soil-applied boron combined with boron-tolerant bacteria (Bacillus sp. mn54) improve root proliferation and nodulation, yield and agronomic grain biofortification of chickpea (Cicer arietinum L.) Sustain. 2021
- [CrossRef] [Google Scholar]
- Seed priming with boron and Bacillus sp. MN54 inoculation improves productivity and grain boron concentration of chickpea. Crop Pasture Sci.. 2022;73:494-502.
- [CrossRef] [Google Scholar]
- Comparative response of two rice (Oryza sativa L.) cultivars to applied zinc and manganese for mitigation of salt stress. J. Soil Sci. Plant Nutr.. 2020;20:2059-2072.
- [CrossRef] [Google Scholar]
- Oosterhuis, D.M., Zhao, D., 2001. Effect of boron deficiency on the growth and carbohydrate metabolism of cotton, in: Plant Nutrition. Springer, pp. 166–167.
- Agronomic bio-fortification of iron, zinc and selenium enhance growth, quality and uptake of different sorghum accessions. Plant, Soil Environ.. 2021;67:549-557.
- [CrossRef] [Google Scholar]
- Boron deficiency in rainfed wheat in Pakistan: incidence, spatial variability and management strategies. J. Plant Nutr.. 2011;34:600-613.
- [Google Scholar]
- Micronutrient constraints to crop production in soils with Mediterranean-type characteristics: a review. J. Plant Nutr.. 2004;27:959-975.
- [Google Scholar]
- Micronutrient deficiency. Our World data; 2017.
- Economics and marketing soil-and foliar-applied boron in cotton production: An economic analysis. J. Cotton Sci.. 2000;4:171-177.
- [Google Scholar]
- Sulphur and boron fertilization on yield quality and nutrient uptake by Bangladesh soybean-4. J. Biol. Sci.. 2002;2:729-733.
- [Google Scholar]
- Steel, R.., Torrei, J., Dickey, D., 1997. Principles and Procedures of Statistics A Biometrical Approach., A Biometrical Approach.
- Yield response of wheat (Triticum aestivum L.) to boron application at different growth stages. Pak. J. Life Soc. Sci. 2009;7:39-42.
- [Google Scholar]
- Plant boron nutrition and boron fertilization in China. Adv. Plant Anim. Boron Nutr. 2007:93-101.
- [Google Scholar]
- Role of mineral nutrition in alleviation of drought stress in plants. Aust. J. Crop Sci.. 2011;5(6):764-777.
- [Google Scholar]
- Comparative physiological studies on the growth of field crops: I. Variation in net assimilation rate and leaf area between species and varieties, and within and between years. Ann. Bot.. 1947;11:41-76.
- [Google Scholar]
- Biofortification of crops with seven mineral elements often lacking in human diets–iron, zinc, copper, calcium, magnesium, selenium and iodine. New Phytol.. 2009;182:49-84.
- [Google Scholar]
- Enhanced leaf photosynthesis as a target to increase grain yield: insights from transgenic rice lines with variable Rieske FeS protein content in the cytochrome b 6 / f complex. Plant. Cell Environ.. 2016;39:80-87.
- [CrossRef] [Google Scholar]
- Boron toxicity tolerance in crops: A viable alternative to soil amelioration. Crop Sci.. 2008;48:854.
- [CrossRef] [Google Scholar]
- Comparative productivity and seed nutrition of cotton by plant growth regulation under deficient and adequate boron conditions. Planta Daninha. 2018;36
- [CrossRef] [Google Scholar]


