Translate this page into:
Rooftop solar Photovoltaic (PV) plant – One year measured performance and simulations
⁎Corresponding author. harjit.singh@brunel.ac.uk (Harjit Singh)
-
Received: ,
Accepted: ,
This article was originally published by Elsevier and was migrated to Scientific Scholar after the change of Publisher.
Peer review under responsibility of King Saud University.
Abstract
In this study, 1-year real life performance of a 30kWp rooftop solar PV power plant installed at the Köprübaşı Vocational School of the Manisa Celal Bayar University was evaluated and is presented here. The PV plant is comprised of 116 polycrystalline modules mounted 15 cm proud of the roof surface providing a gap between roof surface and the bottom of the panels for air circulation. The panels were tilted at 12° with horizontal and orientated at an azimuth angle of −20°. Measured power output of the plant was compared against the predictions of a spreadsheet based simulation model developed. Results were found to be in excellent agreement with the measured values. Annual array yield, final yield and reference yield values of the system that produced 45,592 kWh of energy, under an average 1,818 kWh/m2/a radiation incident on the panels inclined surfaces, were found to be 4.25, 4.97 and 4.16 h/d, respectively. The annual performance ratio of the system has been calculated as 83.61% and the capacity factor 17.35%. It has been determined that the power plant displaced 23.5 tonnes of CO2 emissions in 2018.
Keywords
Rooftop PV
Performance analysis
Solar energy
Photovoltaic
PV
1 Introduction
Globally there is a huge interest in deploying rooftop solar PV plants. In the lack of publicly accessible power plant performance data, however, decision-making process often relies on computer models or very minimal measured data from nearby power plants that may not be directly similar to the ones being considered for deployment. This potentially could result into misleading predictions, energy production or financial, upfront at planning stage, which even could dissuade future investors. A model to predict the energy generated by a photovoltaic system connected to the grid in low latitude countries was presented by Mulcué-Nieto and Mora-López (2014). Investors would like to have highly reliable data covering the energy conversion, economic and carbon reduction performance of various types of PV cells and panels under a range of climatic and installation scenarios. (Wittkopf et al., 2012) reported a 142.5kWp rooftop PV plant in the hot-humid climate of Singapore and (Emziane and Al Ali, 2015) reported 4 large (>50 kWp) rooftop plants in dry-hot climate of Abu Dhabi. Both these plants were based on mono-crystalline Silicon (m-Si) PV cells. Al-Otaibi et al. (2015) evaluated the performance of CIGS cell based rooftop PV power plants in Kuwait. There are several commercial software available to simulate the performance and sizing PV power plants for a given location; these have been in detail covered by de Silva et al. (2020). In the present study, one-year real life measured performance of a 30kWp rooftop solar PV power plant installed at Köprübaşı (Turkey) has been presented and employed to validate a developed spreadsheet based model. The model is presented as a simple tool to be used by decision makers, plant developers and installers to appropriately size system components. The authors have described important performance indices and employed them to evaluate the performance the rooftop PV plant (30 kWp). A combination of factors such as high irradiation and low average daytime ambient temperature has led the studied power plant to record one of the highest specific yield of 1519.7 kWh/kWp/year. Such studies are expected to enhance consumers’ confidence in solar PV technology leading to a higher uptake without requiring any government or policy support worldwide.
2 Materials and methods
2.1 The PV system
The solar PV power plant was installed on the rooftop of Koprubasi Vocational School (Latitude 38.751 and Longitude 28.395) in Manisa in Turkey in May 2018, see Fig. 1.
(a) Location of the PV Plant; (b) A view of the solar PV plant at Koprubasi Vocational School.
The PV plant comprised of 116 panels mounted 15 cm proud of the roof surface providing a gap between roof surface and the bottom of the panels for air circulation. The panels were tilted at 12° with horizontal and orientated at an azimuth angle of −20°.
The Odul solar OSP260 modules, each 260Wp power rating and containing 60 polycrystalline silicon cells, were employed. The PV module specifications are shown in Table 1. PV modules were not manually cleaned during the monitoring period because the roof was not accessible. However, rains at different times throughout the year enabled the PV modules to be cleaned.
Module
Specification
Type
Polycrystalline
Maximum Power (Pmax)
260 W
Module Efficiency
16%
Maximum Power Point Voltage (Vmpp)
30.8 V
Maximum Power Point Current (Impp)
8.48A
Open Circuit Voltage (Voc)
38 V
Short Circuit Current (Isc)
8.96A
Cell Count
60 (6*10)
Temperature Coefficient of Pmax
− 0.45%/°C
Module Dimensions
1640*992*35 mm
NOCT
45 °C ± 2 °C
A three-phase Huawei SUN2000-33KTL inverter with 30 kW rated output power was used for DC/AC conversion and grid connection. Table 2 shows the inverter specifications.
Inverter
Specification
Input
Max. Dc Input
33,800 W
Max. Input Voltage
1,000 V
Max. Input Current per MPPT
23A
Rated Input Voltage
620 V
Maximum Number of Inputs
6
Number of Maximum Power Point Trackers
3
Output
Rated AC Output Power
30 kW
Maximum Efficiency
98.6%
The PV plant, which had three maximum power point tracker (MPPT) inputs comprised of six panel arrays with two arrays for each input. The 3-phase inverter output was directly connected to the 220 V grid via an energy meter. The schematic diagram of the system is given in Fig. 2.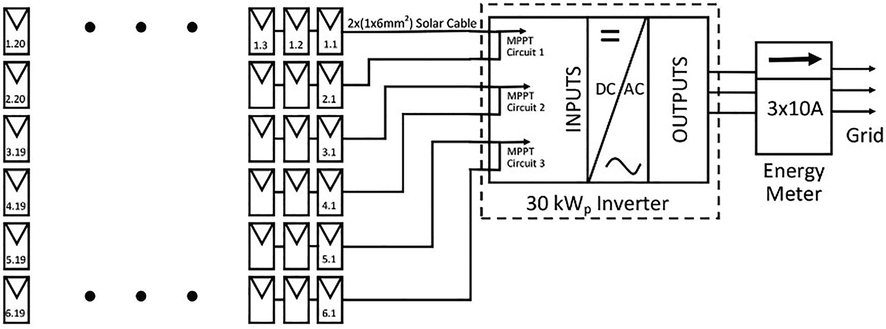
Schematic diagram of the PV plant.
2.2 Modelling grid connected PV system
The amount of electrical energy that PV systems can produce depends on the radiation and ambient temperature. The PV modules operate at output power, which is the catalogue value under STC (1 kW/m2 irradiance, 25 °C ambient temperature and 1.5 air mass). A positive linear relationship is observed between radiation and panel output power, while a negative relationship between ambient temperature and hence module temperature and output power is observed. The equation of PV module output power based on radiation and cell temperature was calculated using equation (1) (Kazem et al., 2014).
Cell temperature, is given by (Messenger and Ventre, 2005; Mulcué-Nieto and Mora-López, 2014; Sharma and Goel, 2017), can be calculated by using Eq. (2).
In this equation, Tamb is the ambient temperature, NOCT is the nominal operating cell temperature (=45 °C for the cells employed), which is the temperature PV cell attains when it is operated in an open circuit arrangement under irradiance of 800 W/m2, ambient temperature of 20 °C, wind speed of 1 m/s and air mass (AM) of 1. is provided by the manufacturer.
The inverter converts the DC power generated by the PV array into AC power for despatching to the grid. During DC / AC conversion, some losses occur in the cables, electronic components and transformer, if any. The AC output power of the inverter is calculated from the DC power at its input, minus the losses that occur. The efficiency of the inverter is also calculated using Eq. (3).
2.3 Monthly and annual electrical energy production
Hourly electric energy production of the PV system was calculated using Eq. (4).
Here Gt is the total irradiance on module surface in an hour, Am is the PV module area, ηm is the module efficiency and Cm is the number of modules.
Daily, monthly and annual energy produced by the system can be calculated using equation (5–7).
2.4 Performance analysis methodology
In order to monitor the performance of the PV system connected to grid, measurements are made continuously. In order to determine PV system performance, array yield (YA), final yield (YF), reference yield (YR), performance ratio (PR) and capacity factor (CF) were calculated as defined by IEC Standard 61,724 (IEC 61724, 1998).
2.4.1 Calculation of the yields
The array yield is calculated by using Eq. (8), as the ratio of the DC energy (EDC) produced by the PV array over a period of time (day, month or year) to the peak power of the PV plant at STC (PPVrated), and is given by (Ayompe et al., 2011; Pvps, 2007).
The daily (YA,d) and monthly array yield (YA,m) is given as (Pvps, 2007) and calculated using equation (9).
The final yield is calculated as the ratio of the AC energy (EAC) produced by the entire solar PV plant over a period of time (day, month or year) to the peak power rating of the PV plant at STC (Ayompe et al., 2011; Kymakis et al., 2009; Pvps, 2007). The final yield allows comparison of similar PV systems installed in specific (same or near) geographical regions. Daily final yield was calculated using equation (10).
The reference yield is the total in-plane solar insolation Gt (kWh/m2) divided by the array reference irradiance (1 kW/m2). This value shows the number of peak sun-hours per day and is given as (Kymakis et al., 2009; Sharma and Goel, 2017) and calculated using equation (11).
2.4.2 Calculation of the losses
Array capture losses (Lc) represents the uncaptured portion of the total radiation falling onto the photovoltaic modules and is the difference between the reference yield (YR) and the actual array yield (YA) (Equation (12)) (Wittkopf et al., 2012).
The system losses (Ls) represent the losses that occur in the system components during conversion of DC power to AC power and feeding it into the grid, and are calculated by the difference between array actual yield (YA) and finally measured yield (YF) (Equation (13)).
2.4.3 Calculation of the efficiencies
The Instantaneous PV module efficiency (ηPV) was calculated using equation (14), as (Ayompe et al., 2011; Sharma and Goel, 2017)
In the Eq. (14) Pm is module output power, It (W/m2) is total in-plane solar insolation and Am is the area of module. Cell temperature dependent module efficiency, is given by (Dubey et al., 2013; Luque and Hegedus, 2011; Skoplaki and Palyvos, 2009), can be calculated by using Eq. (15).
Instantaneous inverter efficiency (ηinv) was calculated using Eq. (16), as the ratio of instantaneous AC output power (PAC) to DC input power (PDC) (Sharma and Goel, 2017).
Monthly inverter efficiency was calculated using Eq. (17), as the ratio of the total monthly AC energy (EAC) supplied to the grid to the monthly total DC energy (EDC) at the inverter input (Mondol et al., 2006).
Instantaneous system efficiency (ηsys) shows how much of the total irradiance (It) falling on the PV modules is converted into DC or AC electrical energy (Luque and Hegedus, 2011; Sharma and Goel, 2017). Instantaneous system efficiency was calculated using Eq. (18).
It is the total radiation on tilted surface, Am is the area of module in the Eq. (18). This value can also be calculated by using Eq. (19). In this equation ηpv is the PV array efficiency and ηinv is the inverter efficiency.
In addition, the method of the calculation of the annual system efficiency was given in equation (20).
Gt (Wh/m2) is the total radiation on the inclined surface over a period of time.
2.4.4 Performance ratio
This is the ratio of the energy that a PV plant can deliver to the grid to the energy that it can theoretically generate at STC conditions. Performance ratio is a dimensionless parameter and used to compare the performance of PV systems regardless of where and how they are mounted (A. Goetzberger and Hoffmann, 2005). It was calculated by using Eq. (21).
This ratio shows how close the PV system is to the rated power, with temperature losses, cable mismatch, inverter inefficiency and soiling. Performance ratio was also calculated by dividing final yield to reference yield (Eq. (22)).
It is also possible to calculate this value by the ratio of PV system efficiency to efficiency at STC by using Eq. (23) (Eicker, 2014; Sharma and Goel, 2017).
2.4.5 Capacity factor
The capacity factor is an indicator that demonstrates the performance of a PV system according to the installation location and the type of installation. This value is calculated by dividing the annual AC energy produced by the system to the maximum energy that the system can produce as a result of its operation at rated power for one year (Ayompe et al., 2011; Kazem et al., 2014; Kymakis et al., 2009; Sharma and Goel, 2017).
3 Results
3.1 Measured radiation and temperature values
Solar radiation was measured by using a pyranometer installed in-plane with the solar panels titled at 12° and the temperature of the PV panels was measured at the back surface using thermocouples and with the data collected by a data logger recording every 5 min providing hourly average values. Ambient temperature and wind speed values were obtained from Turkey’s State Meteorology Service. In Köprübaşı, where PV plant is installed, measured monthly average daily total (MADT) radiation on module’s cover plane and monthly average ambient temperatures are shown in Fig. 3.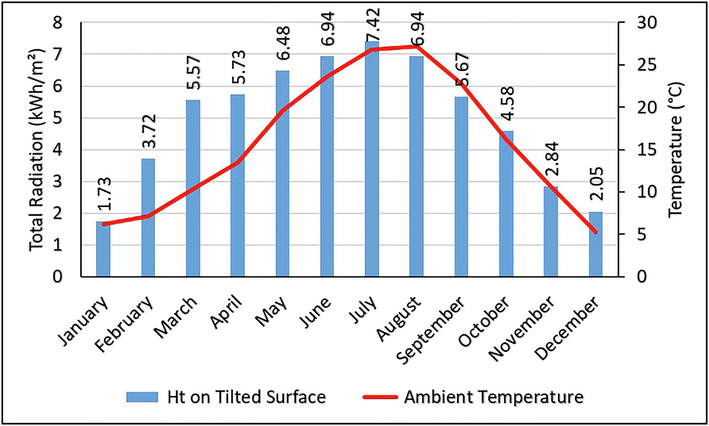
Monthly average daily total radiation on tilted surface and monthly average ambient temperature measured.
The minimum and maximum daily total radiation received were respectively measured as 237.16 Wh/m2 on 25th December and 8,249.25 Wh/m2 on 26th July. The lowest and highest temperatures were respectively −5.2 °C at 5 am on 9th January and 38.6 °C at 3 pm on 31st August.
3.2 Comparison of simulation results and measured values
The analytical model developed using equations described in Section 1 was employed to predict several performance parameters of the PV plant. Measured monthly total generation values and simulation results were given in Table 3.
Months
Ht (kWh/m2)
Measured Energy
Simulated Energy
Module Output (kWh)
AC (kWh)
Module Output (kWh)
AC (kWh)
January
53.65
12.38
1,423.27
13.24
1,490.81
February
104.18
24.02
2,732.34
25.08
2,833.21
March
172.56
38.13
4,323.43
40.65
4,594.10
April
171.96
37.48
4,251.65
40.64
4,592.17
May
200.88
43.33
4,894.95
47.36
5,352.35
June
208.17
46.06
5,218.35
48.85
5,520.88
July
230.11
50.07
5,667.29
53.73
6,073.59
August
215.19
46.56
5,265.48
50.31
5,686.01
September
170.13
37.44
4,240.39
40.15
4,538.63
October
142.03
32.34
3,670.88
33.94
3,834.94
November
85.14
19.48
2,223.18
20.68
2,334.55
December
63.66
14.67
1,680.76
15.62
1,760.91
Total
1,817.67
401.97
45,591.99
430.26
48,612.15
According to the results of the simulation, while a total of 13.24 kWh of electrical energy was expected to be generated with a 260 W module under 53.65 kWh/m2 solar insolation, 12.38 kWh was generated in January. The PV module’s expected electrical energy generation of 53.73 kWh in July, when the monthly total insolation is the highest, was realized as 50.07 kWh. As a result of the simulation made by considering all system components’ efficiency, it was calculated that the 30 kWp rooftop PV system would generate a total of 48,612.15 kWh of electrical energy annually under a solar irradiation of 1,817.67 kWh/m2. But this SPP generated as 45,591.99 kWh electrical energy. The electrical energy generation of this system under the same condition has been recorded as 45,591.99 kWh. Köprübaşı district is a rural area and there are fluctuations in the electricity grid. During these fluctuations, the inverter disconnects from the grid for safety reasons and stops generation. The difference between simulated and measured energy outputs is attributed to assumptions such as the use of hourly average solar radiation intensity by the model, different panel (cell) temperatures used by the model and real life situation and the forced disconnections of the PV plant due to grid quality fluctuations.
In order to validate the analytical model, its predictions were compared with the measured values; for example, see Fig. 4, which shows the module power output for 11st July and 10th December.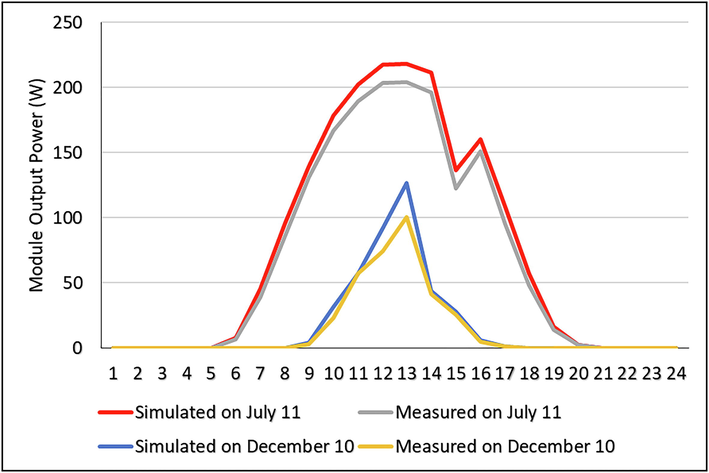
Simulated and measured module power output on two days.
The measured MADT AC energy generated by the solar PV power plant were compared with the model predictions, see Fig. 5. The graph shows that the two sets of the results are very close to each other.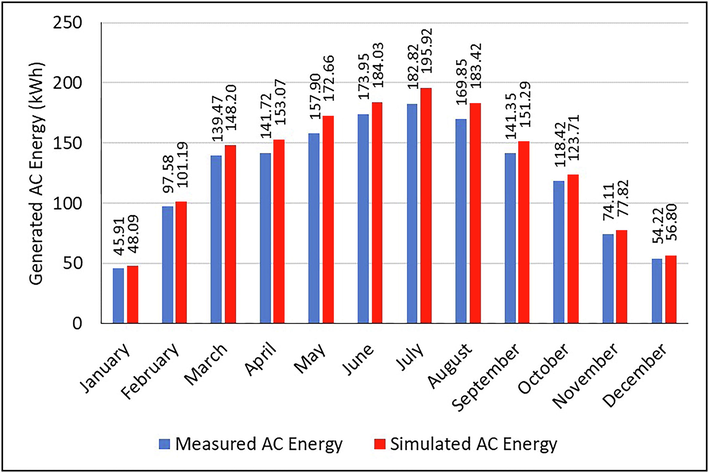
Produced and simulated MADT energy values.
The correlation coefficient (R2) between the simulated and measured PV output power values was calculated as 0.985, see Fig. 6, using equation (25) (Ulgen and Hepbasli, 2002).
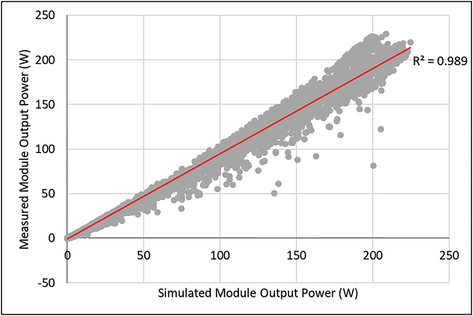
Correlation between measured and simulated data.
Here P is the power, subscripts s and m indicate the simulated and measured values and subscript i indicates value number.
Clearly, the simulation results are in an excellent agreement with the measured values. A linear relationship between the measured and simulated PV module output powers is observed.
3.3 Performance of the PV system
MADT AC energy produced by the rooftop power plant is provided in Fig. 7.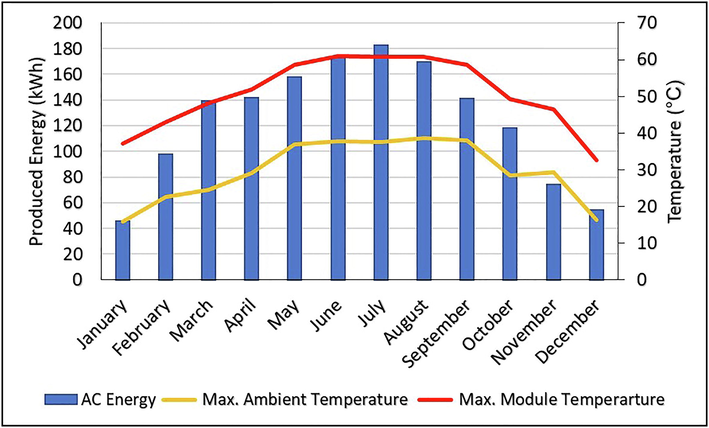
MADT AC energy produced and maximum temperature measured at the back surface of panels.
The highest and the lowest average daily energy production of the system was 182.8 kWh in July and 45.9 kWh in January respectively. The highest module back surface temperature was recorded as 61.0 °C on 9th June at 1 pm and the highest difference between module’s back surface temperature and ambient temperature was recorded as 34.2 °C at mid-day on 21st June when ambient temperature was 23 °C.
The MADT radiation on 12° tilted panel surface (Ht), ambient temperature (Ta), daily average yields and losses per month of the system operating under these conditions are detailed in Table 4.
Month
Ht (kWh/ m2)
Ambient Temp. (°C)
Wind Speed (m/s)
Array Yield (h/d)
Reference Yield (h/d)
Final Yield (h/d)
Capture Losses (h/d)
System Losses (h/d)
January
1.73
6.19
1.22
1.56
1.73
1.53
0.17
0.03
February
3.72
7.12
1.32
3.32
3.72
3.25
0.40
0.07
March
5.57
10.35
1.36
4.75
5.57
4.65
0.82
0.10
April
5.73
13.54
1.50
4.82
5.73
4.72
0.91
0.10
May
6.48
19.60
1.42
5.39
6.48
5.26
1.09
0.12
June
6.94
23.65
1.57
5.93
6.94
5.80
1.01
0.13
July
7.42
26.78
1.76
6.23
7.42
6.09
1.20
0.13
August
6.94
27.19
1.45
5.79
6.94
5.66
1.16
0.12
September
5.67
22.74
1.44
4.81
5.67
4.71
0.86
0.10
October
4.58
16.26
1.15
4.03
4.58
3.95
0.55
0.08
November
2.84
10.65
1.00
2.52
2.84
2.47
0.31
0.05
December
2.05
5.28
1.04
1.84
2.05
1.81
0.21
0.04
Annual Average
4.97
15.78
1.35
4.25
4.97
4.16
0.72
0.09
The minimum and maximum final array yields (Yf) were 1.53 h/d in January and 6.09 h/d in July, with an average final yield of 4.16 h/d while annual reference yield (Yr) was 4.97 h/d. The minimum, maximum and average array yields (Ya) were calculated as 1.65 h/d, 6.23 h/d and 4.25 h/d, respectively. The system losses (LS) were changing between 0.03 h/d and 0.13 h/d. The capture losses (LC) ranged from 0.17 h/d to 1.20 h/d. The average system and capture losses were 0.09 h/d and 0.72 h/d.
The monthly total radiation on 12° tilted surface and a selection of performance parameters are detailed in Table 5.
Month
Ht (kWh/m2)
DC Energy (kWh)
AC Energy (kWh)
PV Efficiency (%)
Inverter Efficiency (%)
System Efficiency (%)
Performance Ratio (%)
Capacity Factor (%)
January
53.65
1,454.39
1,423.27
14.18
97.86
14.06
88.44
6.38
February
104.18
2,787.97
2,732.34
14.17
98.00
13.90
87.42
13.55
March
172.56
4,413.30
4,323.43
13.58
97.96
13.28
83.51
19.37
April
171.96
4,341.85
4,251.65
13.40
97.92
13.10
82.42
19.68
May
200.88
5,009.26
4,894.95
13.26
97.72
12.91
81.22
21.93
June
208.17
5,333.53
5,218.35
13.60
97.84
13.28
83.56
24.16
July
230.11
5,791.82
5,667.29
13.37
97.85
13.05
82.09
25.39
August
215.19
5,381.04
5,265.48
13.30
97.85
12.97
81.56
23.59
September
170.13
4,332.61
4,240.39
13.53
97.87
13.21
83.08
19.63
October
142.03
3,748.62
3,670.88
14.00
97.93
13.70
86.15
16.45
November
85.14
2,271.10
2,223.18
14.07
97.89
13.84
87.04
10.29
December
63.66
1,715.73
1,680.76
14.17
97.96
13.99
88.01
7.53
Annual total/average
1,817.67
46,581.22
45,591.99
13.59
97.88
13.29
83.61
17.35
While the total annual irradiation recorded on the plane of the panels was 1,817.67 kWh/m2, the lowest monthly radiation intensity was 53.65 kWh/m2 in January and the highest 230.11 kWh/m2 in July. PV system produced 5,667.29 kWh electrical energy in July, when solar irradiance was highest and 1,423.27 kWh in January when it was lowest. With a total annual AC energy produced being 45,591.99 kWh, the power plant achieved a specific yield (ratio of energy produced to the plant nominal power), of 1,519.73 kWh/kWp/year.
PV arrays was measured to achieve an annual average efficiency of 13.59% with lowest conversion efficiency of 13.26% in May and the highest of 14.18% in January. Inverter recorded an average efficiency of 98%. The annual system efficiency, which was the lowest at 12.91% in May and the highest at 13.99% in December, was 13.29% with a performance ratio of 83.61%. The capacity factor, due to a combination of system efficiency and low irradiation, remained below 10% in December and January and was calculated as 25% in July, which is the highest value. Annual capacity factor was calculated as 17.35%.
In order to enable a comparison of performance parameters of different types of rooftop PV power plants reported in the literature, Table 6 detailing the final yield (Yf), system efficiency (ηsys), performance ratio (PR) and specific yield is presented. It is clear that power plant studies in this study is one of the best performing in the world. c-Si: Monocrystalline Silicon, m-Si: Multi crystalline Silicon, a-Si: Amorphous Silicon, CIGS: copper indium gallium selenide, Cd-Te: cadmium tellure, CIS: copper indium diselenide
Location
Rated Power (kWp)
PV Type
Final Yield (kWh/kWp/day)
System Eff. (%)
Performance Ratio (%)
Specific Yield (kWh/kWp/year)
Reference
Manisa, Turkey
30
m-Si
4.16
13.29
83.61
1,519.73
Present Study
Dublin, Ireland
1.72
c-Si
2.4
12.6
81.5
885.1
(Ayompe et al., 2011)
Singapore
142.5
m-Si
3.12
11.2
81
1020
(Wittkopf et al., 2012)
Northern Ireland
13
c-Si
–
6.4
61
–
(Mondol et al., 2006)
Warsaw, Poland
1
a-Si
–
4–5
60–80
812.76
(Pietruszko and Gradzki, 2003)
Ujjain, India
6.4
c-Si
–
–
75.01
1528.13
(Dondariya et al., 2018)
Kuwait
85.05
21.6CIGS
4.5
–
74–85
–
(Al-Otaibi et al., 2015)
Norway
2.07
m-Si
2.71
11.6
83.03
989.2
(Adaramola, 2015; Adaramola and Vågnes, 2015)
Lucknow, India
5
m-Si
3.99
10.02
76.97
–
(Yadav and Bajpai, 2018)
Niš, Serbia
2f
c-Si
–
10.07
93.6
1161.7
(Milosavljević et al., 2015)
Kocaeli, Turkey
1.25
1.17
1.2c-Si
m-Si
Cd-Te–
–
83.8
82.05
89.76–
(Başoğlu et al., 2015)
Abu Dhabi, UAE
111.4
50.4
215.7
994m-Si
m-Si
c-Si
c-Si5.1
6.2
4.7
4.7–
80
81
70
-1522
1802
1325
1438(Emziane and Al Ali, 2015)
Bangi, Malaysia
5
5c-Si
CIS3.52
3.6410.72
13.1873.43
77.54–
(Humada et al., 2016)
Malaysia
3
c-Si
2.8
–
77.28
–
(Farhoodnea et al., 2015)
The final yield value of Koprubasi Vocational School rooftop PV SPP is calculated as 4.16 kWh/kWp/day, which is not much inferior to 4.7 to 6.2 kWh/kWp/day reported by Emziane and Al Ali (2015)for Abu Dhabi and 4.5 kWh/kWp/day reported by Al-Otaibi et al. (2015) for Kuwait. The plant level efficiency of 13.29% is comparable or outperforms those reported by Humada et al. (2016) and Ayompe et al. (2011).
3.4 CO2 emission reduction
Based on Turkey’s total electrical energy produced in 2018 (EPDK, 2019) and CO2 emission factors for various fuel resources (WNA, 2011) an overall carbon emission factor of 515.88 tonnes CO2/GWh has been calculated; see Table 7.
Fuel/Source
Generated electrical energy (GWh) (EPDK, 2019)
CO2 emission factor (Tonnes/GWh) (WNA, 2011)
Annual CO2 Emission (Tonnes)
Natural Gas
91,228.26
499
45,522,901.74
Coal
68,283.69
888
60,635,916.72
Hydro
59,972.18
26
1,559,276.70
Lignite
45,055.29
1,054
47,488,275.66
Wind
20,003.36
10
200,033.60
Solar
7,925.33
23
182,282.51
Geothermal
7,611.58
38
289,240.04
Biomass
2,615.90
26
68,013.45
Fuel Oil
957.98
733
702,199.34
Diesel
0.98
888
870.24
Total
303,654.55
–
156,649,010
CO2 Emission Factor of Turkey
515.88 tCO2/GWh
The PV plant has in theory displaced an equivalent amount of CO2e emissions which would otherwise be concomitantly generated by conventional power plants. A simple calculation using the above estimated emission factor has estimated that the 30kWp PV power plant investigated has displaced 23.5 tonnes of CO2 emissions during the period of study.
4 Conclusion
Real life measured performance parameters for a rooftop PV power plant deployed in Koprubasi, Manisa in Turkey have been presented. The power plant produced 45,591.99 kWh displacing 23.5 tonnes of CO2 emissions in 2018 using Turkey’s emission factor of 515.88 tonnes CO2/GWh. A spreadsheet based analytical model to simulate the system performance has been developed. The correlation coefficient between the PV output power obtained as a result of the simulation and the measured values was calculated as 0.99.
The total irradiance measured at the Köprübaşı, where the PV system was installed, on an 12° inclined surface was 1,817.67 kWh/m2. Under this irradiance value, the energy produced from 30kWp PV SPP has been measured as 45,591.99 kWh. The annual average module, inverter and system efficiency values of the PV plant were estimated to be 13.59%, 97.88% and 13.29%, respectively. In addition, the performance ratio of the system was calculated as 83.61% and the capacity factor 17.35%. The performance of the system can be considered as a representative of building mounted systems which are not cleaned regularly and operate in locations where grid fluctuations can also impact the performance. It is felt that to enhance uptake systems will have to record higher panel and plant level efficiency whilst offering lower installed costs.
The model, whose results were shown to predict the measured performance parameters with a correlation factor of > 0.98, is proposed as a user friendly decision making tool for power plant operators and financial institutions looking to install/fund such power plants anywhere in the world.
Acknowledgements
The first author will like to thank Zafer Development Agency for funding the solar PV plant through project 'TR33-16-SUCEP-0028' and Ayrinti Technologies Ltd for providing instrumentation. The second author would like to acknowledge the funding received from EPSRC (UK) for the SUNRISE project (EP/P032591/1).
Declaration of Competing Interest
The authors declare that they have no known competing financial interests or personal relationships that could have appeared to influence the work reported in this paper.
References
- Goetzberger, A., Hoffmann, V.U., 2005. Photovoltaic Solar Energy Generation, 1st ed, Photovoltaic Solar Energy Generation. Springer-Verlag Berlin Heidelberg, Freiburg, Germany. 10.1109/9.412626
- Techno-economic analysis of a 2.1 kW rooftop photovoltaic-grid-tied system based on actual performance. Energy Convers. Manag.. 2015;101:85-93.
- [CrossRef] [Google Scholar]
- Preliminary assessment of a small-scale rooftop PV-grid tied in Norwegian climatic conditions. Energy Convers. Manag.. 2015;90:458-465.
- [CrossRef] [Google Scholar]
- Performance evaluation of photovoltaic systems on Kuwaiti schools’ rooftop. Energy Convers. Manag.. 2015;95:110-119.
- [CrossRef] [Google Scholar]
- Measured performance of a 1.72 kW rooftop grid connected photovoltaic system in Ireland. Energy Convers. Manag.. 2011;52(2):816-825.
- [CrossRef] [Google Scholar]
- Performance analyzes of different photovoltaic module technologies under İzmit, Kocaeli climatic conditions. Renew. Sustain. Energy Rev.. 2015;52:357-365.
- [CrossRef] [Google Scholar]
- Performance simulation of grid-connected rooftop solar PV system for small households: a case study of Ujjain, India. Energy Rep.. 2018;4:546-553.
- [CrossRef] [Google Scholar]
- Temperature dependent photovoltaic (PV) efficiency and its effect on PV production in the world - a review. Energy Procedia. 2013;33:311-321.
- [CrossRef] [Google Scholar]
- Eicker, U., 2014. Solar Thermal Technologies for Buildings, 1st ed., Solar Thermal Technologies for Buildings. John Wiley & Sons Ltd, West Sussex, England. 10.4324/9781315074467
- Performance assessment of rooftop PV systems in Abu Dhabi. Energy Build.. 2015;108:101-105.
- [CrossRef] [Google Scholar]
- Electricity Market Development Report 2018 [WWW Document]. Auth: Energy Mark. Regul; 2019. http://epdk.gov.tr/Detay/Icerik/5-7861/2018-yili-sektor-raporlarinin-ingilizce-versiyonl (accessed 1.1.21)
- Farhoodnea, M., Mohamed, A., Khatib, T., Elmenreich, W., 2015. Performance evaluation and characterization of a 3-kWp grid-connected photovoltaic system based on tropical field experimental results: new results and comparative study. Renew. Sustain. Energy Rev. 10.1016/j.rser.2014.10.090
- Performance evaluation of two PV technologies (c-Si and CIS) for building integrated photovoltaic based on tropical climate condition: a case study in Malaysia. Energy Build.. 2016;119:233-241.
- [CrossRef] [Google Scholar]
- Photovoltaic System Performance Monitoring—Guidelines for Measurement, Data Exchange and Analysis. Geneva: Switzerland; 1998.
- Performance and feasibility assessment of a 1.4 kW roof top grid-connected photovoltaic power system under desertic weather conditions. Energy Build.. 2014;82:123-129.
- [CrossRef] [Google Scholar]
- Performance analysis of a grid connected photovoltaic park on the island of Crete. Energy Convers. Manag.. 2009;50(3):433-438.
- [CrossRef] [Google Scholar]
- Luque, A., Hegedus, S., 2011. Handbook of Photovoltaic Science and Engineering, 1st ed, Handbook of Photovoltaic Science and Engineering. John Wiley & Sons Ltd, West Sussex, England. 10.1002/9780470974704
- Messenger, R.A., Ventre, J., 2005. Photovoltaic Systems Engineering, 2nd ed., Photovoltaic Systems Engineering. CRC Press, Florida, USA.
- Performance analysis of A grid-connected solar PV plant in Niš, republic of Serbia. Renew. Sustain. Energy Rev.. 2015;44:423-435.
- [CrossRef] [Google Scholar]
- Long term performance analysis of a grid connected photovoltaic system in Northern Ireland. Energy Convers. Manag.. 2006;47(18-19):2925-2947.
- [CrossRef] [Google Scholar]
- A new model to predict the energy generated by a photovoltaic system connected to the grid in low latitude countries. Sol. Energy. 2014;107:423-442.
- [CrossRef] [Google Scholar]
- Performance of a grid connected small PV system in Poland. Appl. Energy. 2003;74(1-2):177-184.
- [CrossRef] [Google Scholar]
- Task 2: Cost and Performance Trends in Grid-connected Photovoltaic systems and Case Studies. International Energy Agency 2007
- [Google Scholar]
- Performance analysis of a 11.2 kWp roof top grid-connected PV system in Eastern India. Energy Rep.. 2017;3:76-84.
- [CrossRef] [Google Scholar]
- Silva, J.L. de S., Costa, T.S., Melo, K.B. de, Sakô, E.Y., Moreira, H.S., Villalva, M.G., 2020. A comparative performance of PV power simulation software with an installed PV plant. In: 2020 IEEE International Conference on Industrial Technology (ICIT). pp. 531–535. 10.1109/ICIT45562.2020.9067138
- On the temperature dependence of photovoltaic module electrical performance: a review of efficiency/power correlations. Sol. Energy. 2009;83(5):614-624.
- [CrossRef] [Google Scholar]
- Comparison of solar radiation correlations for Izmir, Turkey. Int. J. Energy Res.. 2002;26:413-430.
- [CrossRef] [Google Scholar]
- Analytical performance monitoring of a 142.5kW p grid-connected rooftop BIPV system in Singapore. Renew. Energy. 2012;47:9-20.
- [CrossRef] [Google Scholar]
- WNA, 2011. Comparison of Lifecycle Greenhouse Gas Emissions of Various Electricity Generation Sources, World Nuclear Association. London, UK.
- Performance evaluation of a rooftop solar photovoltaic power plant in Northern India. Energy Sustain. Dev.. 2018;43:130-138.
- [CrossRef] [Google Scholar]


