

Translate this page into:
Role of Mesenchymal Stem Cells (MSCs) individually and with combination of cherry extract against antiepileptic drug induced hepatotoxicity
⁎Corresponding author. dr.asma.alshammary@gmail.com (Asma A AL-Shammary),
-
Received: ,
Accepted: ,
This article was originally published by Elsevier and was migrated to Scientific Scholar after the change of Publisher.
Peer review under responsibility of King Saud University.
Abstract
Objectives
Antiepileptic drugs (ADEs) are now used to treat a wide range of neurological problems, although their usage is still restricted due to their side effects, particularly hepatotoxicity. Thus, this study consists of the therapeutic effects of non-conditioned Mesenchymal Stem Cells (MSCs) and the MSCs preconditioned with cherry extract (MSCs CM) on mitigation of liver damage induced by the dual administration of antiepileptic drugs such as Levetiracetam (L) and Oxcarbazepine (O).
Methods
The toxicity was induced in male albino rats by the means of the ADEs administration and was examined with the help of different paraments such as biochemical (total protein, albumin, globulin levels, A/G ratio level ALT, and GGTP), Oxidative stress (MDA, NO, and GSH), western blotting assay, immune-histopathology, and histopathological examinations.
Results
The results revealed that rats treated with LO showed an increase in the level of ALT, GGTP, MDA, NO, Bax, and the protein expression of AKT and BI3K, caspase 3 level along with a decrease in GSH, total protein, albumin levels as well as, the level of Bcl2. MSCs or MSC CM with cherry extract treatment post antiepileptic drug administration ameliorate these parameters. Our findings suggest that MSCs and MSCs CM could be used in the disparity purpose of dual antiepileptic drugs induced towards normal.
Conclusions
Thus, it may be deduced that MSCs and MSC CM can hepatoprotection against ADEs-mediated hepatotoxicity and hence signifying that they could be a used as a valuable natural remedy for treating liver damage caused by drugs.
Keywords
Mesenchymal Stem Cells
Cherry extract
Levetiracetam
Oxcarbazepine
Hepatotoxicity
Histopathology

1 Introduction
To prevent or treat seizures, neurocritical care patients frequently take anti-seizure drugs levetiracetam and Oxcarbazepine, they both are used to treat seizures. Seizures are brief spikes in the brain's electrical activity that momentarily alter how it functions. Levetiracetam reduces the speed of these electrical signals to prevent seizures (Salahinejad et al., 2023). Whereas, Oxcarbazepine is used for focused and generalized seizures clinically. It has been used alone and as an add-on therapy for bipolar illness patients who have failed previous medications (Wellington and Goa, 2001).
While there has been progress in the management of epilepsy, 30–40% of individuals remain uncontrolled despite the use of at least one anti-epileptic medication. Polytherapy is the standard treatment for these patients (Kwan and Brodie, 2006). Polytherapy is a method of treating epilepsy in which various medications are used to treat the ilness and diminish the severity and frequency of seizures (Majkowski, et al., 2005). The variety of therapeutic combinations used to treat epilepsy has expanded significantly since the introduction of these medications, as has the associated risk of drug interactions (Hachad et al., 2002). Instead, with a lot of medicinal benefits they both are also proven for some allergies, liver issues, pancreatitis, suicide ideation, and irregular heartbeats (Wellington and Goa, 2001; Talbot, 2020). It is widely known that antiepileptic medications (AED) can cause liver damage. The most widely used AED causes acute liver failure, which is extremely uncommon but can be fatal or require a liver replacement. Due to these side effect, there is an unmet need for a safer drug that have the least or minimal side effects.
The liver is a critical organ because it acts as a pivotal character in the body's metabolic processes, including the creation of energy (Zeng et al., 2023). It's also required for the kidney's biotransformation and removal of exogenous medicines and toxins. According to Bieghs and Trautwein (2013) cell death of hepatocytes responds to liver injury and subsequently produces cytokines and initiates anti-inflammatory responses (Bieghs and Trautwein, 2013). Scientists believe that inflammation is the key role in the evolution of these disorders and that it is one of the mechanisms through which fibrosis and cirrhosis emerge (Garcia-Ruiz et al., 2011; Pettinelli et al., 2011). AKT, a serine-threonine protein kinase, appears to stimulate immune cells in a similar way that phosphatidylinositol-3 kinase (PI3K) does (Weichhart and Säemann, 2008), through variation of important inflammatory cytokines, modifications to the PI3K/AKT signaling pathway may lead to certain therapeutic outcomes (Ding et al., 2021). Thus, lifestyle modification or by use of medicines induces hepato-toxicity. Hepato-toxicity may be attributable to hepato-toxicity produced by a wide range of ecological contaminants, pathogenic micro-organisms, viruses, medications, and organic substances (Shakya, 2020).
Stem cells can regenerate and repair all animal tissues, making them promising therapeutic agents (Ji et al., 2017). They must have two qualities. First, to produce identical progeny, stem cells must have infinite self-renewal. Cancer cells also divide uncontrollably, unlike stem cells, which are closely regulated. Second, they must produce a specific cell type that can formulate the part of the healthy animal (Joyce et al., 2010). Stem cells, of which mesenchymal stem cells (MSCs) are a subset, offer many therapeutic benefits, including the ability to move to locations of tissue injury, potent immune-suppressive effects, and increased safety following infusion of allogeneic MSCs.
Cherry fruit is an abundant source of flavonoids. The significance these nutrients play in preventing oxidative stress, tenderness, and endothelial dysfunction makes them essential to a balanced diet (Beconcini, 2020). Many studies have proven that cherries are full of anthocyanin, polyphenols, and Vitamin C, which can help in reducing inflammation across the body and protect from liver diseases (McCune, 2010). When it comes to antioxidant capacity and health-promoting benefits, cherry is the most extensively researched stone fruit species. Several different types of antioxidant chemicals can be found in sour cherry fruit. Considering black cherries are a strong source of polyphenols, flavonoids, and antioxidants, they may act as a preventative measure or a remedy for liver damage in rats (Abd Allah and Abd-Elrahman, 2020) by significant diminutions in liver malondialdehyde (MDA) content and rises in hepatic catalase (CAT) activity and glutathione (GSH) content. Antioxidants and anti-inflammatory chemicals are just two examples of fruit and vegetable substances with key nutraceutical characteristics. Another study reported the use of Prunus laurocerasus extracts proven antioxidant capacity in it and protective properties in many diseases including hepatoprotective properties induced by paracetamol (Berktas and Peker, 2022). Hence, the bioactive substances found in this fruit keep reactive oxygen species (ROS) levels down and block the production of prostaglandins (Serrano et al., 2018). Therefore, this research objectives is to provide an impression of the therapeutic benefits of preconditioned stem cells and preconditioned stem cells with cherry extract on reducing liver damage brought on by the administration of Levetiracetam and Oxcarbazepine.
2 Materials and methods
2.1 Animals
Wister male albino rats were used and procured from the breeding unit of the University of Hail. Each animal weighs 150 ± 10 gm at the age of 10–12 weeks (El-Mesallamy et al., 2018). The animals were kept in conventional settings with climate control, lighting, and food and liquid availability. The poll followed the rules established by the European Economic Community (EEC) (Directive 86/609/EEC, as revised).
2.2 Chemicals
The Glaxo Company in Cairo, Egypt was where I bought my supply of levetiracetam syrup. The Novartis Company of Cairo, Egypt, produced oxcarbazepine suspension. Cherry Juice Concentrate with Anthocyanin Complex was purchased from (Nature's Goodness Australia) and prepared according to the manufacturer instructions (30:100 ml) Rest all reagents are of analytical grade.
2.3 Isolation and propagation of MSCs from rats
From the bone marrow, MSCs were extracted and propagated according to Alhadlaq and Mao, 2005 (Alhadlaq and Mao, 2005). Then, using flow cytometry analysis, MSCs were distinguished from other bone marrow cells using Mesenchymal Stem Cell Surface Markers. In a nutshell, male Wistar rats killed before having their femur bones removed in order to isolate bone marrow MSCs. Phosphate-buffered saline (PBS), which was purchased from Sigma Chemical Co. (United States), was used to cleanse the bone marrow cavity in order to retrieve bone marrow samples. After layering for around 35 min on 15 ml of Ficoll-Paque (Gibco-Invitrogen, Grand Island, NY), a 15 ml sample of the flushed bone marrow cells was centrifuged at 400 g rpm. After being aspirated, the mononuclear cell layer was twice washed in PBS containing 2 mM EDTA, and then centrifuged for 10 min. at 200 g rpm at 5 °C. RPMI-1640 media supplemented with 10% foetal bovine serum (FBS) from Sigma (United States), 0.5% penicillin, and streptomycin was used to grow the isolated bone marrow MSCs in T25 flasks. The flasks were incubated for 7 days at 37 °C and 5% CO2 until the cell confluence reached 80%-90%. The identity of the MSCs was established by morphology and Fluorescent Analysis Cell Sorting (FACS) cytometry, which revealed that they were CD29+, CD90+, and CD105+ positive and CD34− negative prior to preconditioning. MSCs were increased up to the third passage.
2.4 Preconditioning of MSCs with cherry extract
The mesenchymal stem cells were split into two groups: those that had not been treated with cherry extract (MSCs) and those that had been treated with cherry extract (MSCs CM). The MSCs that had been treated were put in a dish with 100 M of cherry extract for 90 min (Zhang et al., 2014).
2.5 Flow cytometry analysis
Single-cell suspended cells were treated for 20 min. on ice in the FACS buffer comprising pre-conjugated antibodies. Cells were twice washed with the FACS buffer after incubation. Throughout the entire process, a Cell Lab Quanta SCMPL was used for flow cytometry. The data were examined using the Kaluza1®2.2 programme (Beckman Coulter, Denmark), and the percentage of expression was used to calculate the expression of each CD marker on the cells.
2.6 Experimental protocol
Animals were separated into four groups, individually of six ones. The primary group was the normal “control”; the second one was the antiepileptic administered group “LO”: in this group animals were administered with Levetiracetam (L) (150 mg/kg/p.o.) together with Oxcarbazepine (O) (100 mg/kg/p.o.) (Jia et al., 2011) for 3 weeks (Gonzalez-Maciel et al., 2000). In the third group, LO was administered to the animals and then followed by MSCs non-conditioned medium (MSCs) injections (1 × 10⁶/0.5 ml) “LOS” group. The fourth group was the LO administered to the animals and then injected with MSCs conditioned with cherry extract medium “LOSE” group. Forty-eight hours after the completion of the four weeks experimental period, all the rats were fasted overnight and sacrificed by cervical dislocation under light urethane anesthesia (1.2 mg/kg). The blood samples immediately were collected through cardiac puncture centrifuged at 3500 rpm for 20 min. Serum was collected and kept at −20 °C for the biochemical investigations. The rat liver was immediately removed and divided into two portions. The initial portion was homogenized and kept safe for further estimation whereas the subsequent part of liver tissue was fixed in 10% formalin for histopathological and immune- histopathological observation.
2.7 Investigational parameters
Investigations carried out on serum were liver biomarkers enzymes including alanine aminotransferase (ALT), gamma-glutamyl transferase (GGTP), total protein (TP), and albumin. Serum activity of ALT was measured using a Kit (Bio-diagnostic) (Reitman and Frankel, 1957). While the activity of GGT was done as per Saw et al. Conversely, the concentration of serum total protein was recorded according to Yatzidis and albumin levels by Doumas and Biggs procedure (Doumas et al., 1972).
The primary section of the liver was homogenized in ice-cold 0.1Mphosphate buffer saline (pH 7.4) and frozen at −80 °C for determination of the biochemical parameters such as MDA, glutathione, nitric oxide, AKT, BLC2, PI3K, Bax- Pal and Caspase 3.
2.8 Western blotting
This test was done to examine the expression of the proteins AKT and PI3K in the liver tissue. With the help of a protein extraction kit, we were able to obtain the total protein content of the tissue. The Bradford assay was used to quantify the amount of total protein (Kruger, 2009). SDS-PAGE and PVDF membrane electrophoresis separated equal amounts of protein samples.
Briefly, in SDS-PAGE, proteins were segregated by size, transferred to a PVDF membrane, and then blocked. The membrane is then probed overnight with primary antibodies including anti-beta actin (1:1000 dilution; Thermo Scientific), AKT, and PI3K (1:2000 dilution; Abcam, Cambridge, MA, United States), then washed, and incubated at room temperature with secondary antibodies conjugated to horseradish peroxidase for 2 h. The resulting signal were then detected using chemiluminescence detection kit following manufacturer’s advices. The densitometric evaluation was carried out with the help of the image J program following gel analysis plugin and to calculate the relative protein expression levels between different samples, we divided the intensity of each band of interest by the intensity of the loading control or reference sample (Mubin et al., 2018).
2.9 Histopathological examination
We took tissue samples from the liver and treated them in 10% neutral buffered formalin to examine them under the microscope. Following dehydration in progressively more concentrated ethanol, clearing in xylene, embedding in paraffin wax, and sectioning at 5-µm thickness, we have our processed tissue specimens. Haematoxylin and eosin stains were used to examine the specimens. Sections were viewed at 200× and 400× magnification (Bancroft and Gamble, 2008).
Liver tissue (full sections) was examined on six slides per group for histological analysis; morphometric analysis was performed; and the severity index was categorized as average (1%), mild (+) (1–25%), moderate (26–100%), or marked (>75%). Focal, multifocal, and diffuse were the categories used to describe the spread (Thenmozhi et al., 2015).
2.10 Statistical findings
The results are presented as the mean standard deviation (n = 6). One-way analysis of variance (ANOVA) and the Tukey-Kramer multiple comparison test (MCT) were used for statistical analysis.
3 Results
3.1 Determination of flow cytometry analysis
From the result of flow cytometry analysis, the MSCs were distinguished from other bone marrow cells using Mesenchymal Stem Cell Surface Markers. The BM-MSC was negative for CD45- and positive for the following CD markers CD29+, CD73+, CD90+, and CD105+ (Fig. 1).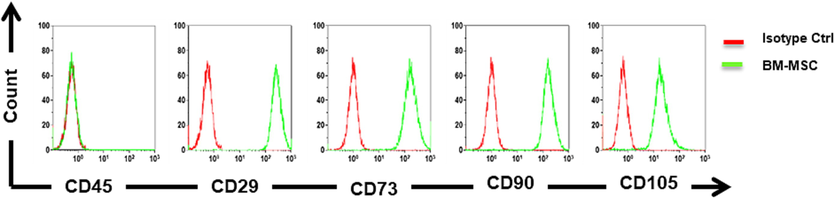
Flow cytometry for the detection of surface markers on MSCs and find by the means of flow cytometry, it was negative for CD45- and Positive for the following CD markers CD29+, CD73+, CD90+, and CD105+.
3.2 Determination of liver function biomarkers
Liver toxicity due to LO administration was detected by measuring liver function biomarkers ALT and GGTP activities as well as total protein, albumin, globulin levels, and A/G ratio in serum. Due to the administration of LO drugs, serum ALT and GGT activities showed a marked increase in ALT (46.75%) and GGT (106.3%) as compared to that of control. On the other hand, the administration of LO recorded a significant decrease in total protein and albumin levels. The calculated percentage of both parameters was 24% and 19.8% correspondingly as compared to the normal control. However, globulin and A/G ratio calculated non-significant change as compared to the control levels (Table 1).
Groups
Con.
LO
LOS
LOSE
ALT
18.33 ± 0.8200
26.09 ± 5.024(a)
46.75%19.39 ± 0.7560(b)
5.78%
−25.68%19.43 ± 0.3970(b)
6.00%
−25.53%
GGTP
1.402 ± 0.2729
2.892 ± 0.6373(a)
106.28%1.708 ± 0.3185(b)
21.83%
−40.94%1.088 ± 0.3971(b)
−22.40%
−62.38
Total protein
9.575 ± 0.9464
7.267 ± 0.3798(a)
−24.10%9.274 ± 1.097(b)
−3.14%
27.62%9.118 ± 1.276(b)
−4.77%
25.47%
Albumin
4.521 ± 0.3485
3.624 ± 0.5097(a)
−19.84%4.193 ± 0.1334
−7.26%
15.7%4.535 ± 0.6274(b)
0.31%
25.14%
Globulin
5.054 ± 1.056
3.929 ± 0.5467
–22.26%4.215 ± 0.9438
−16.60%
7.28%3.853 ± 0.6633
–23.76%
−1.88%
A/G ratio
2.130 ± 0.2963
2.125 ± 0.3637
−0.24%2.010 ± 0.3101
−5.63%
−5.41%1.887 ± 0.1332
−11.41%
−11.2%
LO-administered animals treated with both MSCs CM and an MSCs cherry extract medium showed a decrease (P < 0.05) in ALT and GGT activities as compared to animals administered to LO and the calculated percentage difference for ALT of both MSCs CM and a MSCs preconditioned with cherry extract medium treatments were −25.68 and −25.54% respectively and for GGT activity were −40.94% and −62.36% for both media respectively. These changes were accompanied by a non-significant change in all parameters as compared with normal control levels Table 1.
3.3 Determination of oxidative biomarkers
Treatment with an antiepileptic drug (LO) induced a state of oxidative stress; animals treated with LO demonstrated a significant elevation in hepatic TBARS content by 170.9 % as compared to normal animals. In addition, treatment with MSCs stem cells (LOS), showed a significant decrease in hepatic TBARS content by 50.3% as compared to the LO group. Moreover, treatment with MSCs cherry extracts medium treatments (LOSE), nearly normalized hepatic TBARS content by a percentage decrease of 51% when compared to the LO group (Table 2).
Groups
Con.
LO
LOS
LOSE.
MDA
37.36 ± 3.319
101.2 ± 12.36(a)
170.9%50.34 ± 3.871(a)(b)
35%
−50%49.50 ± 2.422(a)(b))
33%
51%
NO
17.12 ± 3.351
58.52 ± 9.179(a)
−242%28.42 ± 5.314(a)(b)
66%
−51%22.96 ± 4.098(b)
34%
−61%
GSH
93.28 ± 15.59
27.42 ± 4.747(a)
−70.6%76.44 ± 11.21(b)
−18%
179%70.16 ± 14.60(a)(b)
−25%
156%
Animals treated with antiepileptic drug (LO) demonstrated significant acute hepatotoxicity as evidenced by markedly elevating hepatic content of NO by 242 % as compare with normal. The treatment with MSCs (LOS), attenuated this change where LOS significantly diminished the increments in hepatic NO content by 51% when compared to the LO group. Moreover, MSCs cherry extract medium treatments (LOSE) nearly normalized hepatic NO content by 61% when compared to LO value.
Acute hepatotoxicity caused by antiepileptic drug (LO) administration significantly decreased hepatic glutathione (GSH) content by 71 % when compared to the normal. Conversely, treatment with MSCs (LOS) and MSCs cherry extract medium (LOSE), demonstrated a significant increase in hepatic GSH content by 179 % and 156% respectively as compared to the LO group.
3.4 Determination of proapoptotic protein (Bax)and antiapoptotic protein Bcl2
Treatment with dual antiepileptic drug (LO) induced apoptotic signaling pathway as indicated by a rise of proapoptotic protein (Bax) by 465% (Fig. 2) and a significant reduction of antiapoptotic protein (Bcl-2) by 78% (Fig. 3) accompanied by a significant upsurge in the Bax/Bcl-2 ratio as compred with normal.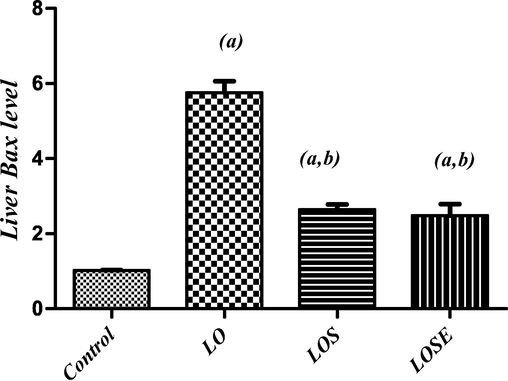
Changes in liver Bax level in LO-administered rats and the therapeutic role of stem cells or stem cells were grown in the cherry extract. (a) Significantly different from the control group, (b) significantly different from (LO) treated group at P < 0.05.
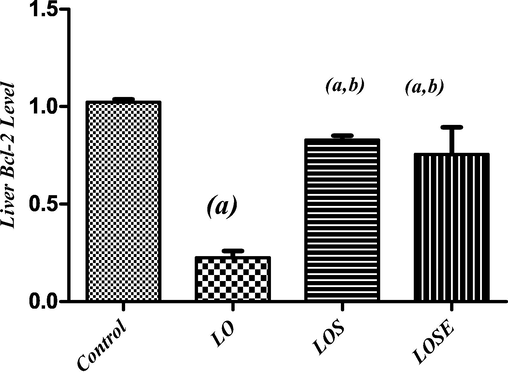
Changes in liver Bcl2 level in LO-administered rats and the therapeutic role of stem cells or stem cells were grown in the cherry extract. (a) Significantly different from the control group, (b) significantly different from (LO) treated group at P < 0.05.
On the other hand, treatment with MSCs (LOS), attenuated these changes where LOS exhibited a significant reduction in Bax by 54% as compared to the LO group (Fig. 2). Moreover, treatment with MSCs CM with cherry extract (LOSE), displayed a greater reduction of the content of hepatic Bax by 57 % when compared to the LO group (Fig. 2). Furthermore, treatment with MSCs (LOS) and MSCs CM with cherry extract (LOSE), significantly elevated hepatic bcl2 content by 267% and 235 % correspondingly to the LO group (Fig. 3).
3.5 Determination of hepatic AKT and PI3K contents
As shown in Fig. 4(A and B) treatment with dual antiepileptic drugs (LO) caused a significant rise in hepatic AKT and PI3K contents by 544% and 453% respectively concerning the normal group.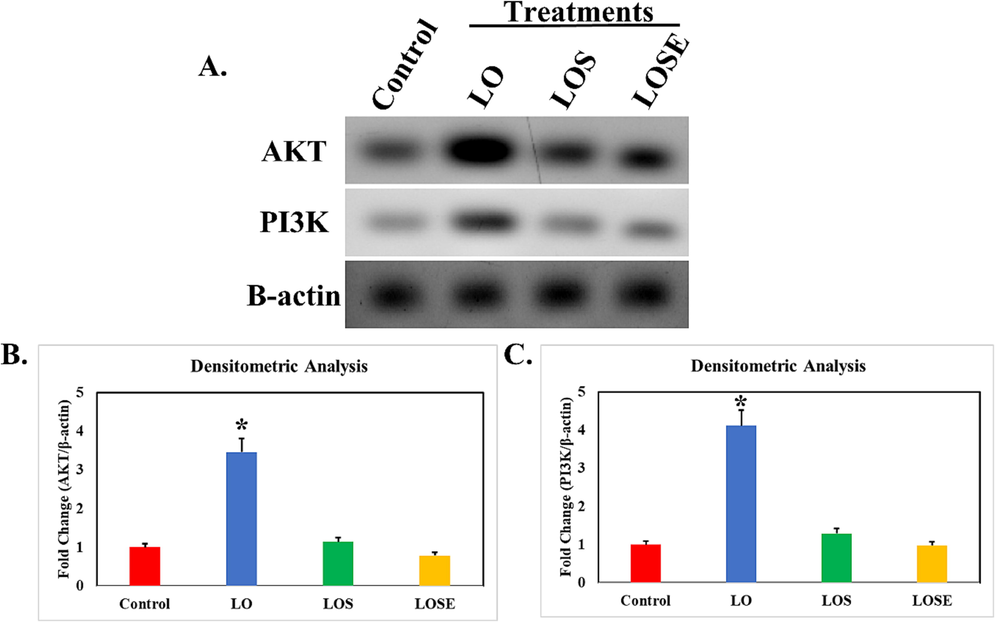
Administeration of LO in rats alters the expression of AKT and PI3K in liver tissue. A panel shows the differential expression of protein and loading control β-actin. B and C panel represent the fold change normalized to β-actin Statistical significance against resepective control, *, P < 0.05.
In addition, treatment with mesenchymal stem cells (LOS), demonstrated a significant decrease in hepatic AKT and PI3K contents by 61% and 65% respectively to LO group. Besides, the MSCs cherry extract medium (LOSE), demonstrated a greater drop of the content of hepatic AKT and BI3K by 57% and 55%when compared to the LO group Fig. 4(B and C).
3.6 Determination of immunohistopathological characteristics
Caspase-3 levels were found to be considerably higher in the LO group compared to the control group as showen in Fig. 5, indicating that apoptosis was caused by the LO therapy. Induction of acute hepatotoxicity by antiepileptic drug (LO) caused a rise in hepatic caspase-3 contents by 313.8% when compared with the normal values.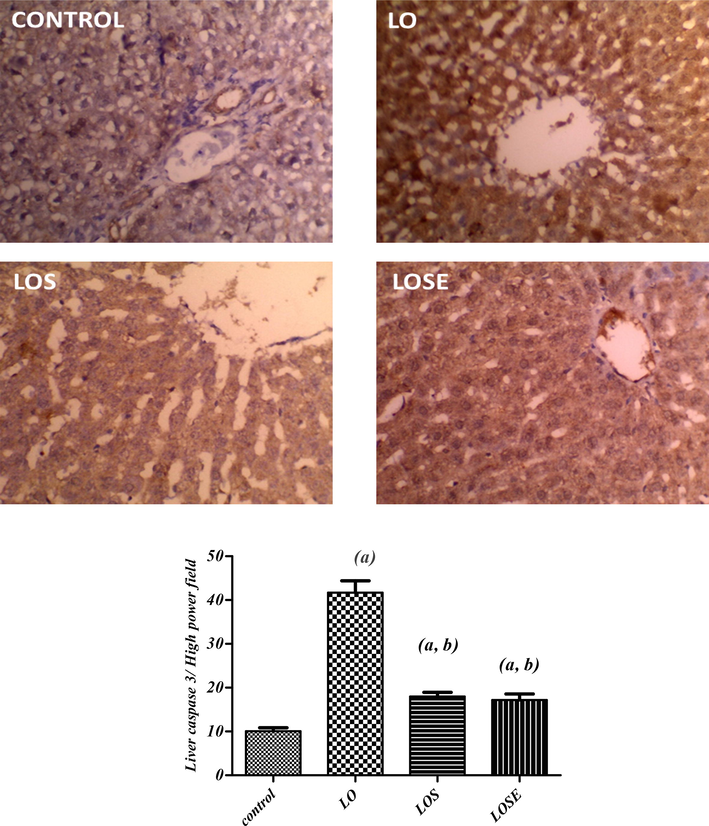
Immunohistochemical photographs of caspase 3 expression in liver tissue of dual antiepileptic drugs administered to rats treated with MSCs CM or MSCs cherry extract (20X). sections taken from the liver of control rats shows slight expression. Section taken from the liver of rats administered with LO drugs displays extensive cytoplasmic expression. The section was taken from livers of LOS or LOSE groups showing medium to limited expression (brown color). (a)Significantly different as of the control group. (b)Significantly different as of LO group.
Alternatively, treatment with non-conditioned MSCs or MSCs CM with cherry extract attenuated these changes whereas the LOS group showed a significant decline in hepatic caspase-3 by 56.8 % as compared to the LO group. Moreover, treatment with MSCs cherry extract (LOSE), showed a greater effect on diminishing hepatic caspase-3 contents by a percentage decrease of 58.8 % when compared to the LO group.
4 Histopathological findings
On gross examination of the control animals’ group, the liver showed average portal tracts, veins, and peri-portal hepatocytes. It consists of average central veins with single-cell cords of hepatocytes and average blood sinusoids between Table 3, and Fig. 6(A and B). Portal tract: • Portal vein (PV): 0: Average +: Mildly dilated/congested ++: Markedly dilated/congested. • Inflammatory infiltrate: 0: No +: Mild ++: Moderate/marked. • Edema: 0: No +: Mild ++: Moderate/marked. • Hepatocytes: 0: Average +: apoptosis/ hydropic change ++: areas of necrosis. Peri-venular area: • Central vein: 0: Average +: Mildly dilated/congested ++: Markedly dilated/congested. • Blood sinusoids: 0: Average +: Mildly dilated/congested ++: Markedly dilated/congested. • Hepatocytes: 0: Average +: scattered apoptosis/mild hydropic change ++: Marked apoptosis.
Portal tract
Peri-venular area
PV
Inflammatory infiltrate
Edema
Hepatocytes
CV
Blood sinusoids
Hepatocytes
Inflammatory infiltrate
Control
0
0
0
0
0
0
0
0
LO
+
0
+
+
0
0
++
0
LOS
0
0
0
0
0
0
0
0
LOSE
0
0
0
0
0
0
0
0
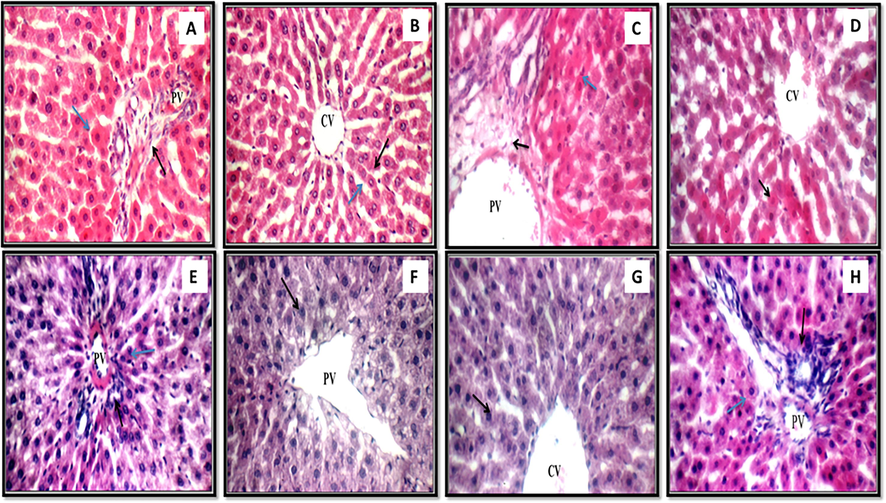
(A) (Control): In this high magnification liver image (black arrow) and portal vein (PV) are typical, as are the peri-portal hepatocytes (blue arrow); (B) (Control): Another look at the liver, this time revealing the typical central vein (CV) and the single-cell cords of hepatocytes (black arrow) separated by typical blood sinusoids (blue arrow); (C) (LO): This high magnification image of the liver reveals mildly swollen portal tracts (black arrow), mildly dilated and congested portal veins (PV), and a few apoptotic hepatocytes in the peri-portal region; (D) Image of the liver demonstrating typical central veins (CV) and extensive peri-venular apoptotic hepatocytes (black arrow); (E) (LOS): A view of the liver under high magnification reveals typical features, including portal tracts (black arrow), portal veins (PV), and hepatocytes (yellow arrow) in the peri-portal region; (F) (LOS): Similar to the previous image, this one also demonstrates average central veins (CV) and peri-venular hepatocytes (black arrow); (G) (LOSE): The liver demonstrates the average number of central veins (CV) and the average number of hepatocytes in the peri-venular area (shown by the black arrow) and (H) (LOSE): This image of the liver displaying typical portal tracts (black arrows) and portal veins (PV) as well as typical hepatocytes in peri-portal locations (blue arrows). All the images are stained with H&E and the picture was taken at a magnification of 400 for all figures except H which is taken at 200).
Liver tissue sections of the animals' treated with dual antiepileptic drugs exhibited mild edematous portal tracts with minor extended congested portal veins and scattered apoptotic hepatocytes in the peri-portal area, and average central veins with marked apoptotic hepatocytes in the peri-venular area (Fig. 6C and D).
On the other hand, the liver of the group administered with antiepileptic drugs and treated with non-conditioned MSCs or MSCs CM with cherry extract (LOS or LOSE) disclosed regular portal tracts with usual portal veins, normal central veins, and normal hepatocytes in the peri-portal and peri-venular area (Fig. 6E and 6F) group (LOS) and (Fig. 6G and 6H) group (LOSE).
5 Discussion
As per a report by Kamitaki et al., several antiseizure medications, both from earlier and later generations, were linked to the expansion of drug-induced liver injury including Levetiracetam (L) and Oxcarbazepine (O) (Kamitaki et al., 2021). Thus these types of medication with its effect also produce hepatoxicity (Sridharan et al., 2020). The Mesenchymal Stem Cell Surface Markers were utilized in order to differentiate the MSCs from the other cells found in the bone marrow as the outcome of flow cytometry testing that was mostly simaliar with the study of Nery et al. (2013) and Ramos et al. (2016). In the current investigation, rats who were given both (L) and (O) dual antiepileptic medications combined exhibited an increase in blood levels of liver enzyme activity, as well as an increase in the liver oxidative stress markers and severe histopathological changes of the liver; indicating hepatocytes injuries as mildly oedematous portal tracts with mildly expanded congested portal veins and scattered apoptotic hepatocytes in peri-portal area, and marked apoptotic hepatocytes in peri-venular area. The hepatocytes became damaged as a result of either an increase in the production of free radicals or a loss in the body's ability to rid itself of them. According to Abd Al Haleem et al. (2019) and Mansour et al. (2014) lipid peroxidation in animals treated with LO drugs was significantly higher as compared to control levels. This elevation caused damage to the membrane bilayer and integrity of the cell. In this study, there is an elevation in oxidative stress markers (MDA and NO levels) measured in the liver with a decrease in the GSH as an antioxidant agent due to dual LO administration. Albumin is the primary provider of diminished sulfhydryl groups, and they're very good at getting rid of toxic oxygen and nitrogen species (Shoaib et al., 2014). These groups are found extracellularly in albumin. Albumin's structure and function are compromised in severe liver injury due to many factors, including Albumin being oxidatively damaged, and large quantities of bilirubin occupying binding sites, all of which lead to lower plasma levels. Concerning dual drug effects on total protein and albumin serum levels, the results of the current research showed that among rats pre-treated with both antiepileptic drugs (L) and (O) exerted the serum total protein and albumin levels were significantly subordinate than those of the control group. Markers of hepatocellular injury (ALT) or bile flow obstruction (cholestasis) can be seen in liver enzymes (GGT) (Khalid et al., 2020). Despite the fact that these enzymes are high in people with liver cancer, they may also be elevated in the absence of injury due to secondary enzyme start. Low albumin levels, in conjunction with increased liver enzymes, are a more diagnostic indicator of liver dysfunction (Ahmed and Siddiqi, 2006). The therapy with Oxcarbazepine leads to an advancement of ALT, AST, ALP, and GGT. However, although GGT is considered a non-specific marker of liver disease often elevates during LO therapy (Ahmed and Siddiqi, 2006), and according to the recorded results treatment with dual LO caused enhancement in both ALT and GGT activities with a decrease in albumin levels. The goal of the investigation was to find out if cherry extract was had a hepatoprotective impact on the hepatotoxic agent. Thus, in this aspect first, we did a precondition of MSCs with the cherry extract.
Members of the Bcl2 family of proteins are crucial for the preservation and regulation of apoptosis. Variations of Bcl‐2 and Bax ratio may adapt to the advancement of cytochrome‐C (Cyt‐C) (Tzifi et al., 2012). So, the most vital sign of mitochondrial cell dysfunction is suffered in dual antiepileptic drugs treated rats. Following our results, the groups of animals treated with MSCs or MSCs CM showed amelioration in Bcl‐2 expressions due to the involvement role of stem cells inhibiting the damages caused by dual LO administration. The start of apoptosis is the central progression in which caspase‐3 plays a vital role and activates cell death (Elmore and Pathol, 2007). Caspase regulation survives mitochondrial Cyt-C increase and caspase-3 protein abnormalities in dual LO-treated animals. MSC therapy CM protects against LO antiepileptic drug-induced liver impairment via decreasing PI3K/AKT signaling pathway expression.
6 Conclusion
This study concludes that the dual administration of antiepileptic drugs (Levetiracetam and Oxcarbazepine) can induce hepatotoxicity by enhancing the level of liver marker enzymes and oxidative stress biomarkers level. Hence, our study concluded that amelioration of liver oxidative stress markers (MDA, NO, and GSH) and protein expression of Bcl‐2, Bax, and PI3K, AKT downregulation by stem cells treatment coups the liver damage induced through dual antiepileptic drugs treatment. In summary, stem cell treatment was used for the disparity purpose of dual antiepileptic drugs induced liver damage towards normal.
7 Future perspective
However, the result of this study reflected that the mice treated with MSCs or MSC CM had higher Bcl-2 expressions due to stem cells reducing dual damage property. As a result, medical professionals and the patients they treat need to exercise extreme caution when it comes to the administration of these AEDs. In the meantime, it is recommended that more experimental and clinical research be conducted on the effects of simultaneously giving patients levetiracetam and oxcarbazepine.
Declaration of Competing Interest
The authors declare that they have no known competing financial interests or personal relationships that could have appeared to influence the work reported in this paper.
References
- Improvement of liver injury induced by acetaminophen using black cherry (Prunus serotina Ehrh) powder and extract in rats. مجلة التربية النوعية و التکنولوجيا بحوث علمية و تطبيقية,. 2020;18(7):558-575.
- [Google Scholar]
- Tissue-engineered osteochondral constructs in the shape of an articular condyle. JBJS. 2005;87(5):936-944.
- [Google Scholar]
- Theory and Practice of Histological Techniques. Elsevier Health Sciences; 2008.
- Antioxidant and anti-inflammatory properties of cherry extract: nanosystems-based strategies to improve endothelial function and intestinal absorption. Foods. 2020;9(2):207.
- [Google Scholar]
- Protective effects of Prunus laurocerasus extracts against paracetamol-induced hepatotoxicity. Nutrit. Food Process.. 2022;5(4)
- [Google Scholar]
- The innate immune response during liver inflammation and metabolic disease. Trends Immunol.. 2013;34(9):446-452.
- [Google Scholar]
- Taxifolin, a novel food, attenuates acute alcohol-induced liver injury in mice through regulating the NF-κB-mediated inflammation and PI3K/Akt signalling pathways. Pharm. Biol.. 2021;59(1):866-877.
- [Google Scholar]
- Determination of Serum Albumin, in Standard Methods of Clinical Chemistry. Elsevier; 1972. p. :175-188.
- Ferulic acid protects against radiation-induced testicular damage in male rats: Impact on SIRT1 and PARP1. Environ. Sci. Pollut. Res.. 2018;25(7):6218-6227.
- [Google Scholar]
- Toxicol. Pathol.. 2007;35(4):495-516. Review. PMID. 17562483
- Metabolic therapy: Lessons from liver diseases. Curr. Pharm. Des.. 2011;17(35):3933-3944.
- [Google Scholar]
- Effects of oxcarbazepine on the behavioral response and neuroanatomical alterations following administration of kainic acid. In: Proceedings of the Western Pharmacology Society. Seattle, Wash: The Society; 2000.
- [Google Scholar]
- New antiepileptic drugs: review on drug interactions. Ther. Drug Monit.. 2002;24(1):91-103.
- [Google Scholar]
- Promising therapeutic strategies for mesenchymal stem cell-based cardiovascular regeneration: from cell priming to tissue engineering. Stem Cells Int.. 2017;2017
- [Google Scholar]
- Effects of levetiracetam on the expression of NCAM and GAP-43 mRNA in the hippocampus of rats with epilepsy. Zhongguo Dang dai er ke za zhi = Chinese J. Contemp. Pediatr.. 2011;13(5):428-431.
- [Google Scholar]
- Mesenchymal stem cells for the treatment of neurodegenerative disease. Regen. Med.. 2010;5(6):933-946.
- [Google Scholar]
- Drug-induced liver injury associated with antiseizure medications from the FDA Adverse Event Reporting System (FAERS) Epilepsy Behav.. 2021;117:107832
- [Google Scholar]
- Anti obesity prospective of Dalbergia latifolia (Roxb.) hydroalcoholic bark extract in high fat diet induced obese rats. 3 Biotech. 2020;10(11):1-12.
- [Google Scholar]
- Antiepileptic Drugs: Combination Therapy and Interactions. Berlin: Cambridge University Press; 2005.
- Mycobacterium tuberculosis host cell interaction: Role of latency associated protein Acr-1 in differential modulation of macrophages. PLoS One. 2018;13(11):e0206459
- [Google Scholar]
- Human mesenchymal stem cells: from immunophenotyping by flow cytometry to clinical applications. Cytometry A. 2013;83(1):48-61.
- [Google Scholar]
- Molecular mechanisms of steatosis in nonalcoholic fatty liver disease. Nutr. Hosp.. 2011;26(3):441-450.
- [Google Scholar]
- MSC surface markers (CD44, CD73, and CD90) can identify human MSC-derived extracellular vesicles by conventional flow cytometry. Cell Commun. Signal.. 2016;14(1):1-14.
- [Google Scholar]
- A colorimetric method for the determination of serum glutamic oxalacetic and glutamic pyruvic transaminases. Am. J. Clin. Pathol.. 1957;28(1):56-63.
- [Google Scholar]
- Effects of common antiepileptic drugs on teleost fishes. Sci. Total Environ. 2023161324
- [Google Scholar]
- Bioactive compounds and extracts from traditional herbs and their potential anti-inflammatory health effects. Medicines. 2018;5(3):76.
- [Google Scholar]
- Drug-induced hepatotoxicity and hepatoprotective medicinal plants: a review. Indian J. Pharm. Educ. Res.. 2020;54(2):234-250.
- [Google Scholar]
- Antiulcerogenic activity of hydromethanolic extract of Andrographis paniculata in Indomethacin and Indomethacin plus pylorus ligation induced gastric ulcer in rats. Asian J. Biomed. Pharm. Sci.. 2014;4(39):8.
- [Google Scholar]
- Drug-induced liver injury in critically ill children taking antiepileptic drugs: A retrospective study. Curr. Ther. Res.. 2020;92:100580
- [Google Scholar]
- 12 Chapter for Mental Disorders: Valproate, Lamotrigine, Carbamazepine and Oxcarbazepine. In: Seminars in Clinical Psychopharmacology. Cambridge University Press; 2020.
- [Google Scholar]
- Neuroprotective effect of hesperidin on aluminium chloride induced Alzheimer’s disease in Wistar rats. Neurochem. Res.. 2015;40(4):767-776.
- [Google Scholar]
- The role of BCL2 family of apoptosis regulator proteins in acute and chronic leukemias. Adv. Hematol.. 2012;2012
- [Google Scholar]
- The PI3K/Akt/mTOR pathway in innate immune cells: emerging therapeutic applications. Ann. Rheum. Dis.. 2008;67(Suppl 3):iii70-iii74.
- [Google Scholar]
- Lipophagy: Molecular mechanisms and implications in hepatic lipid metabolism. Front. Biosci.-Landmark. 2023;28(1):6.
- [Google Scholar]
- Helium preconditioning protects mouse liver against ischemia and reperfusion injury through the PI3K/Akt pathway. J. Hepatol.. 2014;61(5):1048-1055.
- [Google Scholar]


