

Translate this page into:
Review of toxic metals in tobacco cigarette brands and risk assessment
⁎Corresponding author. amos.ntarisa@udsm.ac.tz (Amos Vincent Ntarisa)
-
Received: ,
Accepted: ,
This article was originally published by Elsevier and was migrated to Scientific Scholar after the change of Publisher.
Abstract
The act of tobacco smoking cigarettes is linked to the development of lung cancer, which accounts for around 90 % of lung cancers in the world. This paper reviewed 76 articles on harmful heavy metals in tobacco cigarette brands and associated health risk assessment. This comprehensive examination involved searching targeted databases across multiple search engines, such as Scopus, Web of Science, Google Scholar, Science Direct, PubMed and Research Gate, published in English from 2000 to September 2024. The mean heavy metals concentrations are 2.9, 10.5, 4.5, 7.9 and 3.5 mg/kg for Cd, Pb, Cr, As and Hg, respectively. Related mean hazard quotient (HQ for non-carcinogenic ingestion and inhalation were determined. HQ for ingestion and inhalation were < 1 and > 1, respectively. HQ for all metal inhalation, which signifies considerable health risk. The risk of cancer for ingestion of all metals is in the acceptable limit below 1E-04, while the risk of cancer for inhalation of all metals is in the unacceptable range. Additional research on toxic heavy metals in tobacco cigarette brands from diverse countries is necessary to arrive at conclusive mean risks for each specific toxic heavy metal.
Keywords
Heavy metals
Smoking
Tobacco
Cigarette brands
Lung cancer, carcinogenic and non-carcinogenic

1 Introduction
Excessive levels of heavy metals pose a significant human toxicity risk as they are extensively distributed throughout the environment. While these metals are naturally present, in addition to by-products which contain some heavy metals, human activities such as mining, agriculture, industries activities, etc, that discharge them into the air, soil, water, and food can elevate exposure levels (Ntarisa, 2024; Sebiawu et al., 2014). Heavy metals are grouped into two main categories: essential and toxic heavy metals. Essential heavy metals play an important role in the daily lives of humans, plants, and other living beings but are toxic at higher concentrations. On the other hand, toxic heavy metals have no biological function in humans, plants, and other living beings. Even at low concentrations, these metals are highly hazardous. The highly toxic heavy metals are lead (Pb), mercury (Hg), arsenic (As), cadmium (Cd), and chromium (Cr). In contrast, the essential heavy metals in trace amounts include metals such as manganese (Mn), zinc (Zn), iron (Fe), copper (Cu), etc. (Asati et al., 2016; Mohamed et al., 2016; Pinto et al., 2017; Velusamy et al., 2022; Ziyae Aldin Samsam Shariat et al., 2019).
Certain plants, like tobacco, possess the capacity to accumulate heavy metals. Tobacco plants absorb metal ions and compounds from the soil through their roots, and they are further transported from the roots to the leaves (Özcan et al., 2019) Tiny leaf accumulations of heavy metals transfer to cigarette smoke during tobacco processing. The pH level, soluble organic matter, soil type, and presence of organic or metal ions are vital factors that affect the speciation, adsorption, and distribution of heavy metals in soil (Eneji et al., 2013; Ziarati et al., 2016). Consequently, the contamination of heavy metals varies in each country and each place where tobacco plants are cultivated and processed (Ziarati et al., 2016).
Accumulation of heavy metals from tobacco cigarette smoke occurs in tissues and fluids as a result of smoking (Ntarisa, 2024). As stated by the International Agency for Research on Cancer (IARC), inhaling smoke from tobacco cigarettes poses significant dangers and toxicity to human health (Massadeh et al., 2005). As per the World Health Organization (WHO), one person dies from the consequences of tobacco consumption every 4 s (St Claire et al., 2020). A prolonged intake of minimal quantities of heavy metals due to cigarette smoke over several years can lead to kidney damage and weakened bones, as certain heavy metals are primarily stored in the bone, liver, and kidneys (Karbon et al., 2015; Massadeh et al., 2005). Heavy metals can induce severe impacts on the brain, correlate with a decline in intelligence quotient (IQ) levels and the potential emergence of behavioural issues. Also, the act of smoking cigarettes is linked to the development of lung cancer, which accounts for around 90 % of lung cancers in the world (Felix and Ntarisa, 2024; Massadeh et al., 2005; Pelit et al., 2013).
Tobacco cigarette consumption and the prevalence of smokers have been on a consistent rise globally (Azeez et al., 2019; Hussain et al., 2024). Numerous companies worldwide engage in the manufacturing of tobacco cigarettes under various brand names. A significant portion of these cigarettes is available at affordable prices. If contaminated with various heavy metals, it can result in adverse health effects for the population. Because of this health risk problem, several researchers have devoted their efforts to conducting studies on heavy metals in tobacco cigarette brands worldwide, spanning various countries. Some early reviews regarding heavy metals in tobacco and tobacco products were carried out with titles: “Metals in Cigarette Smoke”, “Review on Cadmium Contamination in Soil and Bioaccumulation by Tobacco, its Source, Toxicity and Health Risk, and Metals in Cigarette Smoke” and”Toxic elements in tobacco and in cigarette smoke: inflammation and sensitization” presented by Bernhard et al (Bernhard et al., 2005), Iradukunda et (Iradukunda et al., 2021) and Steve Pappas (Pappas, 2011) respectively. Bernhard et al. examine how cigarette smoking delivers metals to the human body and explores the body's reactions to metals (Al, Cu, Cd, Hg, Pb, Ni, Zn, Cr, Se, Mn and V) exposure, while Iradukunda et al investigate tobacco plant's cadmium uptake, sources, toxicity, and health risks from soil accumulation also Steve Pappas Examine and consolidate existing evidence about specific health risks associated with exposure to metals or metalloids. Focus on those substances categorized as carcinogens by (IARC) or metals that demonstrate evidence of sensitization or inflammation due to exposure through smokeless tobacco products or cigarette smoke. This study reviews research on heavy metals in tobacco cigarette brands manufactured worldwide from 2000 to September 2024. It estimates the average amounts of toxic heavy metals (As, Cd, Cr, Hg, and Pb) in these cigarette brands and assesses the associated health risks to consumers.
2 Methods
2.1 Sources of data and search Method
A systematic review of heavy metal involved a comprehensive search of specific databases, spanning from early September 2023 to September 2024. The search targeted articles published in the English language between the years 2000 and September 2024. Various search platforms such as Google Scholar, Scopus, Science Direct, Web of Science, PubMed and Research Gate were the sources from which the data were retrieved. The approach employed for searching was heavy metals in tobacco cigarette brands, toxic metals in tobacco cigarette brands, trace metals in tobacco cigarette brands, metals in tobacco cigarette brands, assessment/analysis/measurements/evaluations of heavy metals in tobacco products and contamination of heavy metal in tobacco cigarette brands. Initially, 170 papers from diverse countries were randomly selected without specific considerations for the publication year or cigarette brands' sample size (N). Later, a more focused time frame of 2000 to September 2024 was chosen, and the selection criterion for N was established as N ≥ 3 for heavy metals. Upon reviewing the papers, redundant documents were eliminated. Finally, following the filtration process, eithty-one (81) articles sourced from diverse countries were identified for heavy metals in tobacco cigarette brands. After that, articles containing at least one toxic metal among As, Cd, Cr, Hg and Pb were chosen for quantitative analysis. Seventy-six(76) analysed articles had at least one element of these harmful metals. The tables for each toxic metal were created with information on manufacturer country, year, N, heavy metal concentration range, mean heavy metal concentrations, and reference. The range of concentrations for heavy metals, along with their arithmetic mean, was determined in units. Any values not initially presented in ( were converted into this unit.
2.2 Human health risk assessment
The human health risks assessment for non-carcinogenic and carcinogenic components was conducted using different equations. Equations (1) and (2) were used to calculate the average daily dosage (ADD) for non-carcinogenic hazards for ingestion and inhalation, respectively. Equations (3) and (4) were used to calculate the hazard quotient (HQ) for assessing non-carcinogenic risks by inhalation and ingestion, respectively. Equations (5) to (8) were used to calculate the lifetime average daily dose (LADD), as well as the risk from ingesting and inhalation, to assess carcinogenic health risk (Ismail et al., 2017; Ntarisa, 2024; Taiwo and Awomeso, 2017)
In this context, C stands for the average concentration of heavy metals in mg/kg, EF is the exposure frequency with a unit of 365 days/year, IRIng is the ingestion rate which is equivalent to 50 mg/day, IRInh is the inhalation rate (20 m3/day), and ED refers to the exposure duration (30 years). AT is the average exposure period, with values of 10,950 days (ED × 365) for non-carcinogenic risks and 25,550 days, calculated as 70 years × 365 days for carcinogenic risks. BW refers to body weight, which is assumed to be 70 kg, RFD is the reference dose, RFC is the reference concentration, URF is the unit risk factor for inhalation, and CSF is the cancer slope factor for ingestion. If the hazard quotient (HQ) exceeds 1, it indicates a significant health risk concern (Ismail et al., 2017; Ntarisa, 2024; Taiwo and Awomeso, 2017). In carcinogenic assessments, a risk within the range of 1
to 1
is considered acceptable (Abedi Sarvestani and Aghasi, 2019; Benson et al., 2017; Ismail et al., 2017). The values used for calculating EF, IR, ED, AT, and BW are listed in Table 1, while the RFD, RFC, CSF, and URF values are provided in Table 2.
Value
Reference
EF
365 days/year
(Ismail et al., 2017; Zhao et al., 2023)
IRIng
50 mg/day
(Ismail et al., 2017)
IRInh
20 m3 /day
(Ismail et al., 2017; Zhao et al., 2023)
ED
30 years
(Benson et al., 2017; Ismail et al., 2017; Taiwo and Awomeso, 2017)
AT for non-carcinogenic
10950 days
(Benson et al., 2017; Ismail et al., 2017; Zheng et al., 2010)
AT for carcinogenic
25,550 days
(Ismail et al., 2017; Zheng et al., 2010)
BW
70 kg
(Ismail et al., 2017; Zheng et al., 2010)
Heavy Metal
RFD
Reference
RFC
Reference
CSF mg/kg-d
Reference
URF
Reference
Hg
0.0001
(USEPA, 2023)
0.0003
(Ismail et al., 2017; USEPA, 2023)
*
*
Pb
0.0036
(Abedi Sarvestani and Aghasi, 2019; Ismail et al., 2017; Naimabadi et al., 2021; Taiwo et al., 2019)
0.0352
(Naimabadi et al., 2021)
0.042
(Naimabadi et al., 2021)
*
Cd
0.0001
(USEPA, 2023)
0.00001
(Ismail et al., 2017; USEPA, 2023)
1.5
(Ismail et al., 2017)
0.0018
(Ismail et al., 2017; USEPA, 2023)
As
0.0003
(Ismail et al., 2017; Taiwo and Awomeso, 2017)
0.000015
(Ismail et al., 2017; USEPA, 2023)
1.5
(Ismail et al., 2017; Lee et al., 2006; USEPA, 2023)
0.0043
(Ismail et al., 2017; USEPA, 2023)
Cr
0.003
(Naimabadi et al., 2021; Taiwo et al., 2019; USEPA, 2023)
0.0001
(Ismail et al., 2017; USEPA, 2023)
0.5
(Ismail et al., 2017; USEPA, 2023)
0.084
(Ismail et al., 2017; USEPA, 2023)
3 Results
The analysis of toxic heavy metal encompassed 76 articles sourced from various continents, detailed in Supplementary Tables 2-6. From the review findings, 38 articles were identified from Asia, 12 from Europe, 3 from North America, 21 from Africa, and 2 from South America. Out of the total, 66 articles were accessible in full text, accounting for 86.8 %, while 10 were only available in abstract form, representing 13.2 %. Some investigations documented the presence of a single toxic heavy metal in cigarette brands, whereas other research findings indicated the existence of many toxic heavy metals in cigarette brands. The results show that atomic absorption spectrophotometry was mainly used to determine toxic heavy metals, followed by flame atomic absorption spectrophotometer in cigarette brands, as shown in Supplementary Table 1.
A total of 75, 60, 31, 14, and 9 studies, in that order, have presented findings on the concentrations of Cd, Pb, Cr, As, and Hg in various cigarette brands, as shown in Supplementary Tables 2-6. The average arithmetic mean concentration in mg/kg were 2.9, 10.5, 4.5, 7.9 and 3.5 for Cd, Pb, Cr, As and Hg, respectively. The primary element of interest was Cd, followed by Pb. Prolonged exposure to small amounts of Cd over an extended period may lead to kidney damage and weakened bones, as Cd accumulates primarily in bones, liver, and kidneys. Also, elevated levels of Pb have been linked to a reduction in intelligence quotient (IQ) and the potential emergence of behavioural issues (Massadeh et al., 2005).
Tables 3 to 7 estimate non-carcinogenic and carcinogenic health risks for Cd, Pb, Cr, As, and Hg, respectively. The mean average ADD for non-carcinogenic health risks through ingestion was 2.08, 7.48, 3.21, 5.60 and 2.47
mg/kg-day for Cd, Pb, Cr, As and Hg, respectively. The mean average ADD values for inhalation were 3.83, 25.33, 2.68, 6.9 and 8.13 mg/m3-day for Cd, Pb, Cr, As and Hg, respectively. The mean HQ values for non-carcinogenic risks through ingestion were 20.80, 2.08, 1.07, 18.75 and 24.71
for Cd, Pb, Cr, As and Hg, respectively. For inhalation, the mean HQ values were 382.23, 0.72, 26.81, 547.60 and 27.09
for Cd, Pb, Cr, As and Hg, respectively. Since HQ < 1 for all metals through ingestion indicates no significant health risk, Q > 1 for all metals through inhalation suggests a considerable health risk (Ismail et al., 2017; Ntarisa, 2024).
Manufactures country
Year
Reference
Mean concentrations (mg/kg)
Non-carcinogenic health risk
Carcinogenic health risk
Ingestion
Inhalation
Ingestion
Inhalation
ADD (
mg/kg-day)
HQ
ADD (mg/m3-day)
HQ
LADD (
mg/kg-day)
Cancer risk
LADD (mg/m3-day)
Cancer risk
Benin
2012
(Agbandji et al., 2013)
47.2
33.71
337.14
62.03
6203.42
14.45
21.67
26.59
47.86
Brazil
2011
(Viana et al., 2011)
0.7
0.50
5.00
0.92
92.00
0.21
0.32
0.39
0.71
Bulgaria
2023
(Peeva et al., 2023)
0.8
0.57
5.71
1.05
105.14
0.24
0.37
0.45
0.81
China
2017
(Ren et al., 2016)
0.1
0.07
0.71
0.13
13.14
0.03
0.05
0.06
0.10
China
2014
(O’Connor et al., 2014)
3.2
2.29
22.86
4.21
420.57
0.98
1.47
1.80
3.24
Egypt
2017
(Abd El-Samad and Hanafi, 2017)
4.4
3.14
31.43
5.78
578.29
1.35
2.02
2.48
4.46
Ethiopia
2016
(Engida, 2017)
2.5
1.79
17.86
3.29
328.57
0.77
1.15
1.41
2.54
France
2012
(Agbandji et al., 2013)
41
29.29
292.86
53.89
5388.57
12.55
18.83
23.09
41.57
Germany
2005
(Nnorom et al., 2005)
1.8
1.29
12.86
2.37
236.57
0.55
0.83
1.01
1.83
Hungary
2002
(Csalári and Szántai, 2002)
0.3
0.21
2.14
0.39
39.43
0.09
0.14
0.17
0.30
India
2009
(Dhaware et al., 2009)
0.4
0.29
2.86
0.53
52.57
0.12
0.18
0.23
0.41
India
2019
(Özcan et al., 2019)
0.6
0.43
4.29
0.79
78.86
0.18
0.28
0.34
0.61
India
2010
(Verma et al., 2010)
0.5
0.36
3.57
0.66
65.71
0.15
0.23
0.28
0.51
Iran
2016
(Ziarati et al., 2016)
0.6
0.43
4.29
0.79
78.86
0.18
0.28
0.34
0.61
Iran
2012
(Pourkhabbaz and Pourkhabbaz, 2012)
2.7
1.93
19.29
3.55
35.49
0.83
1.24
1.52
2.74
Iran
2019
(Ziyae Aldin Samsam Shariat et al., 2019)
1.6
1.14
11.43
2.10
210.29
0.49
0.73
0.90
1.62
Iran
2015
(Pashapour et al., 2015)
0.4
0.29
2.86
0.53
52.57
0.12
0.18
0.23
0.41
Iraq
2021
(Haleem and Amin, 2021)
0.4
0.29
2.86
0.53
52.57
0.12
0.18
0.23
0.41
Iraq
2019
(Haleem et al., 2020)
0.4
0.29
2.86
0.53
52.57
0.12
0.18
0.23
0.41
Iraq
2015
(Karbon et al., 2015)
0.57
0.41
4.07
0.75
74.91
0.17
0.26
0.32
0.58
Iraq
2022
(Joda and Alheloo, 2022)
1.6
1.14
11.43
2.10
210.29
0.49
0.73
0.90
1.62
Iraq
2015
(Al-Jeboori et al., 2015)
0.1
0.07
0.71
0.13
13.14
0.03
0.05
0.06
0.10
Ireland
2015
(Afridi et al., 2015)
0.4
0.29
2.86
0.53
52.57
0.12
0.18
0.23
0.41
Japan
2021
(Dinh et al., 2021)
0.9
0.64
6.43
1.18
118.29
0.28
0.41
0.51
0.91
Jordan
2005
(Massadeh et al., 2005)
2.6
1.86
18.57
3.41
341.71
0.80
1.19
1.46
2.64
Jordan
2003
(Jaradat et al., 2003)
0.3
0.21
2.14
0.39
39.43
0.091
0.14
0.17
0.30
Jordan
2004
(Massadeh et al., 2003)
2.6
1.86
18.57
3.41
341.71
0.80
1.19
1.46
2.64
Kenya
2015
(Omari et al., 2015)
0.08
0.06
0.57
0.11
10.51
0.02
0.04
0.05
0.081
Kenya
2020
(Peter et al., 2020)
0.1
0.07
0.71
0.13
13.142
0.03
0.05
0.06
0.10
Malaysia
2017
(Ismail et al., 2017)
0.9
0.64
6.43
1.18
118.29
0.28
0.41
0.51
0.91
Malaysia
2019
(Janaydeh et al., 2019)
0.8
0.57
5.71
1.05
105.14
0.24
0.37
0.45
0.81
Mexico
2008
(Martínez et al., 2008)
1.2
0.86
8.57
1.58
157.71
0.37
0.55
0.68
1.22
Nigeria
2013
(Eneji et al., 2013)
0.01
0.01
0.07
0.013
1.31
0.003
0.05
0.006
0.0101
Nigeria
2019
(Onojah et al., 2019)
1.4
1.00
10.00
1.84
184.00
0.43
0.64
0.79
1.42
Nigeria
2013
(IWUOHA et al., 2013)
0.6
0.43
4.29
0.79
78.86
0.18
0.28
0.34
0.61
Nigeria
2011
(Anhwange and Yiase, 2011)
1.4
1.00
10.00
1.84
184.00
0.43
0.64
0.79
1.42
Nigeria
2015
(Abudu et al., 2015)
0.13
0.09
0.93
0.17
17.09
0.04
0.06
0.074
0.13
Nigeria
2019
(Azeez et al., 2019)
1.4
1.00
10.00
1.84
184.00
0.43
0.64
0.79
1.42
Nigeria
2005
(Nnorom et al., 2005)
1.3
0.93
9.29
1.71
170.86
0.40
0.60
0.73
1.32
Nigeria
2011
(Yebpella et al., 2010)
0.7
0.50
5.00
0.92
92.00
0.21
0.32
0.39
0.71
Nigeria
2018
(Onojah et al., 2019)
1.4
1.00
10.00
1.84
184.00
0.43
0.64
0.79
1.42
Pakistan
2008
(Ajab et al., 2008)
0.5
0.36
3.57
0.66
65.71
0.15
0.23
0.28
0.51
Pakistan
2011
(Ahmad et al., 2011)
0.2
0.14
1.43
0.26
26.29
0.06
0.09
0.11
0.20
Pakistan
2019
(Mahmood et al., 2020)
0.5
0.36
3.57
0.66
65.71
0.151
0.23
0.28
0.51
Pakistan.
2017
(Asim et al., 2017)
0.10
0.07
0.71
0.13
13.14
0.03
0.05
0.06
0.10
Pakistan
2008
(Kazi et al., 2009)
0.6
0.43
4.29
0.79
78.86
0.184
0.28
0.34
0.61
Pakistan
2024
(Hussain et al., 2024)
0.4
0.28
2.86
0.53
52.57
0.12
0.18
0.22
4.06
Palestina
2015
(Abu-Obaid et al., 2015)
1.2
0.86
8.57
1.58
157.71
0.37
0.55
0.678
1.22
Philippines
2013
(Solidum, 2013)
0.01
0.01
0.07
0.013
1.31
0.003
0.005
0.006
0.0101
Poland
2008
(Galażyn-Sidorczuk et al., 2008)
0.8
0.57
5.71
1.05
105.14
0.24
0.37
0.45
0.81
Portugal
2014
(Pinto et al., 2017)
0.8
0.57
5.71
1.05
105.14
0.24
0.37
0.45
0.81
Romanian
2014
(AGOROAEI et al., 2014)
1.1
0.79
7.86
1.45
144.57
0.34
0.51
0.62
1.12
Romania
2018
(Strungaru et al., 2018)
0.7
0.50
5.00
0.92
92.00
0.21
0.32
0.39
0.71
Saudi Arabia
2021
(Dahlawi et al., 2021)
37.4
26.71
267.14
49.15
4915.42
11.45
17.17
21.07
37.92
Saudi Arabia
2012
(Ashraf, 2012)
1.8
1.29
12.86
2.37
236.57
0.55
0.83
1.01
1.83
Spain
2015
(Armendáriz et al., 2015)
0.8
0.57
5.71
1.05
105.14
0.24
0.37
0.45
0.81
Tanzania
2024
(Ntarisa, 2024)
0.53
0.38
3.79
0.70
69.66
0.16
0.24
0.30
0.54
Turkey
2013
(Pelit et al., 2013)
0.3
0.21
2.14
0.39
39.43
0.091
0.14
0.17
0.30
Turkey
2012
(Duran et al., 2012)
1.1
0.79
7.86
1.45
144.57
0.34
0.51
0.62
1.12
Turkey
2012
(KADIOĞLU et al., 2012)
2.0
1.43
14.29
2.63
262.86
0.61
0.92
1.13
2.03
Turkey
2001
(Barlas et al., 2001)
1.7
1.21
12.14
2.23
223.43
0.52
0.78
0.96
1.72
U.S
2013
(Caruso et al., 2013)
0.9
0.64
6.43
1.18
118.29
0.28
0.41
0.51
0.91
UK
2005
(Nnorom et al., 2005)
1.3
0.93
9.29
1.71
170.86
0.40
0.60
0.73
1.31
U.S
2005
(Nnorom et al., 2005)
1.6
1.14
11.43
2.10
210.29
0.49
0.73
0.90
1.62
Average
2.91
2.08
20.80
3.83
382.85
0.89
1.33
1.64
2.95
Manufactures country
Year
Reference
Mean concentrations (mg/kg)
Non-carcinogenic health risk
Carcinogenic health risk
Ingestion
Inhalation
Ingestion
Inhalation
ADD (
mg/kg-day)
HQ
ADD (mg/m3-day)
HQ
LADD (
mg/kg-day)
Cancer risk
LADD (mg/m3-day)
Benin
2012
(Agbandji et al., 2013)
2.0
1.43
396.83
4.83
137.34
0.61
0.03
2.07
Brazil
2011
(Viana et al., 2011)
0.3
0.21
59.52
0.73
20.60
0.09
0.004
0.31
Bulgaria
2023
(Peeva et al., 2023)
1.6
1.14
317.46
3.87
109.87
0.49
0.02
1.66
China
2017
(Ren et al., 2016)
0.2
0.14
39.68
0.48
13.74
0.06
0.003
0.21
China
2014
(O’Connor et al., 2014)
2.5
1.79
496.03
6.04
171.67
0.77
0.03
2.59
Ethiopia
2016
(Engida, 2017)
6.2
4.43
1230.16
14.99
425.75
1.90
0.08
6.42
France
2012
(Agbandji et al., 2013)
4.4
3.14
873.02
10.64
302.14
1.35
0.06
4.56
Ghana
2014
(Sebiawu et al., 2014)
5.8
4.14
1150.79
14.02
398.78
1.78
0.07
6.01
Hungary
2002
(Csalári and Szántai, 2002)
0.5
0.36
99.21
1.21
34.33
0.15
0.01
0.52
India
2009
(Dhaware et al., 2009)
7.4
5.29
1468.26
17.89
508.15
2.27
0.10
7.67
India
2019
(Özcan et al., 2019)
3.5
2.50
694.44
8.46
240.34
1.07
0.05
3.63
India
2010
(Verma et al., 2010)
1.9
1.36
376.98
4.59
130.47
0.58
0.02
1.97
Iran
2016
(Ziarati et al., 2016)
34.4
24.57
6825.40
83.15
2362.21
10.53
0.44
35.64
Iran
2012
(Pourkhabbaz and Pourkhabbaz, 2012)
2.1
1.50
416.67
5.08
144.20
0.64
0.03
2.18
Iran
2015
(Pashapour et al., 2015)
22.3
15.93
4424.61
53.90
1531.31
6.83
0.29
23.10
Iraq
2021
(Haleem and Amin, 2021)
4.6
3.29
912.70
11.12
315.88
1.41
0.06
4.77
Iraq
2019
(Haleem et al., 2020)
4.6
3.29
912.70
11.12
315.88
1.41
0.06
4.77
Iraq
2014
(Karbon et al., 2015)
5.9
4.21
1170.64
14.26
405.15
1.81
0.08
6.11
Iraq
2015
(Al-Jeboori et al., 2015)
0.2
0.14
39.68
0.48
13.74
0.06
0.003
0.21
Ireland
2015
(Afridi et al., 2015)
0.4
0.29
79.37
0.97
27.47
0.12
0.005
0.41
Japan
2021
(Dinh et al., 2021)
1.6
1.14
317.46
3.87
109.87
0.49
0.02
1.66
Jordan
2005
(Massadeh et al., 2005)
2.7
1.93
535.71
6.53
185.41
0.83
0.03
2.80
Jordan
2003
(Jaradat et al., 2003)
0.3
0.21
59.52
0.73
20.60
0.09
0.004
0.31
Jordan
2004
(Massadeh et al., 2003)
2.7
1.93
535.71
6.53
185.41
0.83
0.03
2.80
Kenya
2015
(Omari et al., 2015)
6.8
4.86
1349.21
16.44
466.95
2.08
0.09
7.04
Kenya
2020
(Peter et al., 2020)
0.2
0.14
39.68
0.48
13.73
0.06
0.003
0.21
Malaysia
2017
(Ismail et al., 2017)
0.6
0.43
119.05
1.45
41.20
0.18
0.008
0.62
Malaysia
2019
(Janaydeh et al., 2019)
3.1
2.21
615.08
7.49
212.87
0.95
0.04
3.21
Nigeria
2013
(Eneji et al., 2013)
0.04
0.03
7.94
0.097
2.75
0.012
0.0005
0.04
Nigeria
2013
(IWUOHA et al., 2013)
22.8
16.29
4523.81
55.11
1565.65
6.98
0.29
23.62
Nigeria
2011
(Anhwange and Yiase, 2011)
2.0
1.43
396.83
4.83
137.34
0.61
0.03
2.07
Nigeria
2011
(Yebpella et al., 2010)
10.1
7.21
2003.97
24.41
693.55
3.09
0.13
10.46
Pakistan
2008
(Ajab et al., 2008)
14.4
10.28
2857.14
34.81
988.83
4.41
0.19
14.92
Pakistan
2019
(Haleem et al., 2020)
1.0
0.71
198.41
2.42
68.67
0.31
0.01
1.04
Pakistan
2008
(Ren et al., 2016)
0.3
0.21
59.52
0.73
20.60
0.09
0.004
0.31
Pakistan
2024
(Hussain et al., 2024)
2.08
1.49
412.70
5.03
142.83
0.64
0.03
2.15
Palestina
2015
(Abu-Obaid et al., 2015)
3.1
2.21
615.08
7.49
212.87
0.95
0.04
3.21
Philippines
2013
(Solidum, 2013)
1.0
0.71
198.41
2.42
68.67
0.31
0.01
1.04
Portugal
2014
(Pinto et al., 2017)
0.5
0.36
99.21
1.21
34.33
0.15
0.01
0.52
Poland
2008
(Galażyn-Sidorczuk et al., 2008)
0.8
0.57
158.73
1.93
54.94
0.24
0.01
0.83
Romanian
2014
(AGOROAEI et al., 2014)
4.2
3.00
833.33
10.15
288.41
1.29
0.05
4.35
Roumania
2018
(Strungaru et al., 2018)
0.4
0.29
79.37
0.97
27.47
0.12
0.01
0.41
Saudi Arabia
2021
(Dahlawi et al., 2021)
312.8
223.43
62063.52
756.08
21479.59
95.76
4.02
324.03
Saudi Arabia
2011
(Ashraf, 2012)
2.5
1.79
496.03
6.04
171.67
0.77
0.03
2.59
Serbia
2012
(Lazarević et al., 2012)
0.9
0.64
178.57
2.18
61.80
0.28
0.01
0.93
Spain
2015
(Armendáriz et al., 2015)
0.6
0.43
119.05
1.45
41.20
0.18
0.008
0.62
Turkey
2012
(Duran et al., 2012)
3.7
2.64
734.13
8.94
254.07
1.13
0.05
3.83
Turkey
2001
(Barlas et al., 2001)
1.0
0.71
198.41
2.41714
68.67
0.31
0.01
1.04
U.S
2013
(Caruso et al., 2013)
0.4
0.29
79.37
0.97
27.47
0.12
0.005
0.41
Average
10.48
7.48
2078.96
25.33
719.5
3.21
0.14
10.85
Manufactures country
Year
Reference
Mean concentrations (mg/kg)
Non-carcinogenic health risk
Carcinogenic health risk
Ingestion
Inhalation
Ingestion
Inhalation
ADD (
mg/kg-day)
HQ
ADD (mg/m3-day)
HQ
LADD (
mg/kg-day)
Cancer risk
LADD (mg/m3-day)
Cancer risk
Brazil
2011
(Viana et al., 2011)
1.4
1.00
333.33
0.84
8.36
0.43
0.21
0.36
0.03
Brazil
2020
(Lisboa et al., 2020)
0.6
0.43
142.86
0.36
3.58
0.18
0.09
0.15
0.012
China
2017
(Ren et al., 2016)
0.1
0.07
23.81
0.06
0.60
0.03
0.02
0.03
0.002
China
2014
(O’Connor et al., 2014)
0.6
0.43
142.86
0.36
3.58
0.18
0.09
0.15
0.01
Ghana
2014
(Sebiawu et al., 2014)
4.3
3.07
1023.81
2.57
25.68
1.32
0.66
1.10
0.09
Hungary
2009
(Hamidatou et al., 2009)
8.4
6.00
2000.00
5.02
50.16
2.57
1.29
2.15
0.18
India
2019
(Özcan et al., 2019)
1.4
1.00
333.33
0.84
8.36
0.43
0.21
0.36
0.03
India
2010
(Verma et al., 2010)
4.1
2.93
976.20
2.45
24.48
1.26
0.63
1.05
0.09
Iraq
2021
(Haleem and Amin, 2021)
3.3
2.36
785.72
1.97
19.71
1.01
0.51
0.84
0.07
Iraq
2020
(Haleem et al., 2020)
3.3
2.36
785.72
1.97
19.71
1.01
0.51
0.84
0.07
Iraq
2014
(Karbon et al., 2015)
3.8
2.71
904.76
2.27
22.69
1.16
0.58
0.97
0.08
Kenya
2015
(Peter et al., 2020)
2.8
2.00
666.67
1.67
16.72
0.86
0.43
0.72
0.06
Malaysia
2017
(Ismail et al., 2017)
22.1
15.79
5261.92
13.20
131.97
6.77
3.38
5.66
0.48
Nigeria
2013
(Eneji et al., 2013)
0.12
0.09
28.57
0.07
0.72
0.04
0.02
0.03
0.002
Nigeria
2009
(Asubiojo et al., 2009)
N.A
0.00
0.00
0.00
0.00
0.00
0.00
0.00
0.00
Nigeria
2013
(IWUOHA et al., 2013)
21.6
15.423
5142.86
12.90
128.98
6.61
3.31
5.53
0.46
Nigeria
2011
(Anhwange and Yiase, 2011)
2.2
1.57
523.81
1.31
13.14
0.67
0.34
0.56
0.05
Nigeria
2018
(Azeez et al., 2019)
6.4
4.57
1523.81
3.82
38.22
1.96
0.98
1.64
0.14
Pakistan
2024
(Hussain et al., 2024)
11.2
8.0
2666.67
6.69
66.88
3.43
1.71
2.87
0.24
Romanian
2014
(AGOROAEI et al., 2014)
3.8
2.71
904.76
2.27
22.69
1.16
0.58
0.97
0.08
Romania
2018
(Strungaru et al., 2018)
1.2
0.86
285.71
0.72
7.17
0.37
0.18
0.31
0.03
Saudi Arabia
2021
(Dahlawi et al., 2021)
1.8
1.29
428.57
1.07
10.75
0.55
0.28
0.46
0.04
Spain
2015
(Armendáriz et al., 2015)
1.4
1.00
333.33
0.84
8.36
0.43
0.21
0.36
0.03
Tanzania
2024
(Ntarisa, 2024)
1.82
1.3
433.33
1.09
10.87
0.56
0.28
0.47
0.04
Turkey
2012
(Duran et al., 2012)
5.0
3.57
1190.48
2.99
29.86
1.53
0.77
1.28
0.11
Turkey
2001
(Barlas et al., 2001)
1.6
1.14
380.92
0.96
9.55
0.49
0.24
0.41
0.03
U.S
2013
(Caruso et al., 2013)
2.4
1.71
571.43
1.43
14.33
0.73
0.37
0.61
0.05
Average
4.49
3.21
1069.05
2.68
26.81
1.37
0.69
1.15
0.097
Manufactures country
Year
Reference
Mean concentrations (mg/kg)
Non-carcinogenic health risk
Carcinogenic health risk
Ingestion
Inhalation
Ingestion
Inhalation
ADD (
mg/kg-day)
HQ
ADD (mg/m3-day)
HQ
LADD (
mg/kg-day)
Cancer risk
LADD (mg/m3-day)
Cancer risk
Benin
2012
(Agbandji et al., 2013)
37.1
26.50
88.33
32.33
2155.33
11.36
17.04
13.86
59.58
Brazil
2011
(Viana et al., 2011)
0.09
0.06
0.21
0.08
5.23
0.03
0.04
0.03
0.15
China
2014
(O’Connor et al., 2014)
0.8
0.57
1.90
0.70
46.48
0.24
0.37
0.30
1.29
France
2012
(Agbandji et al., 2013)
50
35.71
119.05
43.57
2904.76
15.31
22.96
18.67
80.30
Hungary
2009
(Hamidatou et al., 2009)
3.9
2.79
9.29
3.40
226.57
1.19
1.79
1.46
6.26
India
2009
(Dhaware et al., 2009)
0.5
0.36
1.19
0.44
29.05
0.15
0.23
0.19
0.80
Ireland
2015
(Afridi et al., 2015)
0.2
0.14
0.48
0.17
11.62
0.06
0.09
0.07
0.32
Malaysia
2017
(Ismail et al., 2017)
0.03
0.02
0.07
0.03
1.74
0.01
0.014
0.01
0.048
Mexico
2008
(Martínez et al., 2008)
0.6
0.43
1.43
0.52
34.86
0.18
0.28
0.22
0.96
Serbia
2012
(Lazarević et al., 2012)
0.2
0.14
0.48
0.17
11.62
0.06
0.09
0.07
0.32
Turkey
2001
(Barlas et al., 2001)
0.9
0.64
2.142
0.78
52.29
0.28
0.41
0.34
1.45
U.S
2013
(Caruso et al., 2013)
0.2
0.14
0.48
0.17
11.62
0.06
0.09
0.07
0.32
Average
7.9
5.6
18.75
6.9
457.60
2.41
3.62
2.94
12.6
Manufactures country
Year
Reference
Mean concentrations (mg/kg)
Non-carcinogenic health risk
Ingestion
Inhalation
ADD (
mg/kg-day)
HQ
ADD (mg/m3-day)
HQ
Ireland
2015
(Afridi et al., 2015)
4.4
3.14
31.43
10.33
34.45
Japan
2021
(Dinh et al., 2021)
12.3
8.79
87.86
28.89
96.29
Malaysia
2017
(Ismail et al., 2017)
0.2
0.14
1.43
0.47
1.57
Pakistan
2019
(Haleem et al., 2020)
0.1
0.07
0.71
0.23
0.78
Turkey
2001
(Barlas et al., 2001)
0.3
0.21
2.14
0.70
2.35
Average
3.5
2.47
24.71
8.13
27.09
Table 8 shows the average arithmetic mean concentration, Mean.
,
,
,
,
,
,
, and
. The mean LADD for carcinogenic human health risks through ingestion were 0.89, 3.21, 1.37 and 2.41
mg/kg-day for Cd, Pb, Cr and As, respectively. The mean LADD values for inhalation were 1.64, 10.85, 1.15, and 2.94 mg/m3-kg for Cd, Pb, Cr and As, respectively. The mean risk for ingestion was 1.34, 0.14, 0.69 and 3.62
for Cd, Pb, Cr and As, respectively. The mean risk for inhalation was 2.95, 96.50 and 12.6
for Cd, Cr and As, respectively. A risk within the range of 1
to 1
is considered acceptable(Benson et al., 2017; Ismail et al., 2017; Ntarisa, 2024). Therefore, the ingestion risk for all metals is acceptable as it falls within the permissible range, while the inhalation risk for all metals is unacceptable since all values exceed the accepted limit of 1
to 1
. Fig. 1 shows some effects of toxic heavy metals present in tobacco cigarettes. From the figure, lung cancer is the main contributor to cancer due to tobacco cigarettes smoking from contaminated heavy metals such as Cd, Hg, Pb, Cr As, etc.
Toxic heavy metal
Average arithmetic Mean concentrations (mg/kg)
Non-carcinogenic health risk
Carcinogenic health risk
Ingestion
Inhalation
Ingestion
Inhalation
Mean ADD (
mg/kg-day)
Mean HQ
Mean ADD (mg/m3-day)
Mean HQ
Mean LADD (
mg/kg-day)
Mean Cancer risk
Mean LADD (mg/m3-day)
Mean Cancer risk
Cd
2.91
2.08
20.80
3.83
382.85
0.89
1.34
1.64
2.95
Pb
10.48
7.48
2.08
25.33
0.72
3.21
0.14
10.85
*
Cr
4.49
3.21
1.07
2.68
26.81
1.37
0.69
1.15
96.50
As
7.9
5.6
18.75
6.9
457.60
2.41
3.62
2.94
12.6
Hg
3.5
2.47
24.71
8.13
27.09
*
*
*
*
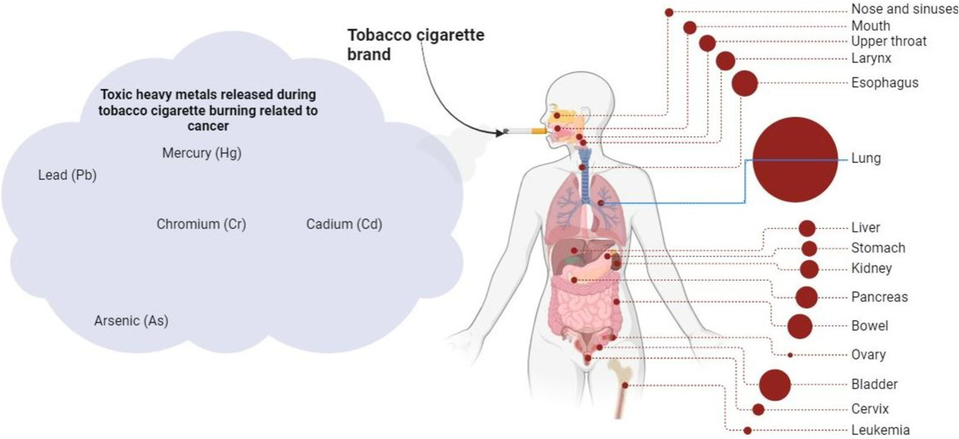
Tobacco cigarette brand, type of metals, inhalation process, and how it affects human health.
4 Conclusion
The current study reviewed articles that offered a thorough examination of the human health risk assessment associated with toxic metals found in various brands of tobacco cigarettes. The study analysed 76 articles from various continents to ascertain human risk assessment of toxic metals Cd, Pb, Cr, As, and Hg in cigarette brands manufactured worldwide. The targeted articles were those published in English from 2000 to September 2024. The result shows that HQ for all toxic metal ingestion. It signifies no health risk. However, if HQ > 1 for all metal inhalation, it signifies considerable health risks. The reviewed studies show risk ingestion for all metals is acceptable since it falls within the range of 1 to 1 . Sadly, the risk of inhalation for all metal is unacceptable since all are out of the range of 1 to 1 . The data produced in this review will establish baseline risk values for toxic heavy metals in various cigarette brands worldwide.
CRediT authorship contribution statement
Anastazia Tarimo Felix: Writing – review & editing, Writing – original draft, Visualization, Software, Resources, Methodology, Investigation, Formal analysis, Data curation, Conceptualization. Amos Vincent Ntarisa: Writing – review & editing, Validation, Supervision, Resources, Project administration, Methodology, Funding acquisition, Conceptualization.
Funding
This research received no grant from any funding agency.
Declaration of competing interest
The authors declare that they have no known competing financial interests or personal relationships that could have appeared to influence the work reported in this paper.
References
- Analysis of toxic heavy metals in cigarettes by instrumental neutron activation analysis. J. Taibah University for Sci.. 2017;11:822-829.
- [CrossRef] [Google Scholar]
- Health risk assessment of heavy metals exposure (lead, cadmium, and copper) through drinking water consumption in Kerman City, Iran. Environ. Earth Sci.. 2019;78
- [CrossRef] [Google Scholar]
- Abudu, K.A., Gbadamosi, M.R., Banjoko, O.O., Ogunbanjo, O.O., Osinaike Abiodun, 2015. Heavy metal content of different brands of cigarettes and local tobacco commonly smoked in Nigeria and its toxicological and Health implications. Conference: 1st Interdisciplinary Conference of the. University of Cape Coast and TASUED.At: University of Cape, Coast; Ghana.https://www.researchgate.net/publication/268382959_Heavy_Metal_Content_of_Different_Brands_of_Cigarettes_Commonly_Smoked_in_Nigeria_and_its_Toxicological_Implications.
- Abu-Obaid, A., Jodeh, S., Ahmad, O., Salghi, R., Warad, I., 2015. Determination and Assessment of Heavy Metals in Tobacco Sold and Smoked In Palestinian Market.t. Int J Chem 2015; 4(3): 713-723. https://staff.najah.edu/media/sites/default/files/Determination_and_Assessment_of_Heavy_Metals_in_Tobacco_Sold_and_Smoked_In_Palestinian_Market.pdf.
- Estimation of toxic elements in the samples of different cigarettes and their effect on the essential elemental status in the biological samples of Irish smoker rheumatoid arthritis consumers. Environ. Monit Assess. 2015;187:157.
- [CrossRef] [Google Scholar]
- Comparison of heavy metals contents for some cigarette brands. Am J. Pharmacol. Toxicol.. 2013;7:149-153.
- [CrossRef] [Google Scholar]
- Content of Heavy Metals in Tobacco of Commonly Smoked Cigarettes in Romania.Volume 65. Issue. 2014;9
- [Google Scholar]
- Ahmad, S.A., Gulzar, A., Un Nisa, V., Hussain, A., Aslam Khan, W., Naeem Khan, M., Ullah Khokhar, Z., Abdul Qadir, M., 2011. Study of toxic metals in different brands of study of toxic metals in different brands of cigarettes available in lahore. Sci. Int. (Lahore) 23, 205–209.https://books.apple.com/it/book/study-of-toxic-metals-in-different-brands-of/id510382419.
- Evaluation of trace metals in tobacco of local and imported cigarette brands used in Pakistan by spectrophotometer through microwave digestion. J. Toxicol Sci.. 2008;33:415-420.
- [CrossRef] [Google Scholar]
- Al-Jeboori, F.H.A., Hussain, K.I., Hammode, A.S., Znad, D.E., 2015. Analysis of Heavy Metals in Selected Cigarettes and Syrupy Tobacco (Mu’assel) Brands Smoking in Baghdad Market Iraq, Online).Vol 32,https://www.iiste.org/Journals/index.php/ALST/article/view/22238/22584.
- Anhwange, B., Yiase, S.G., 2011. Trace metals content of some Brands of cigarettes found within Makurdi Metropolis.ISSN 0974-3111 Volume 3, Number 2 (2011), pp. 143-149. http://www.irphouse.com/ijca/IJCAv3n2__4.pdf.
- Heavy metals in cigarettes for sale in Spain. Environ. Res.. 2015;143:162-169.
- [CrossRef] [Google Scholar]
- Effect of heavy metals on plants: an overview. Int. J. Application or Innovation in Eng & Management (IJAIEM). 2016
- [CrossRef] [Google Scholar]
- Levels of heavy metals in popular cigarette brands and exposure to these metals via smoking. Sci. World J. 2012:1-5.
- [CrossRef] [Google Scholar]
- Asim, M., Bano, H., Ahmed, K., Arif Aziz, A., 2017. Determination of cadmium and zinc contents in different brands of cigarettes and chewing tobaccos. INT. J. BIOL. BIOTCH.14 (2): 215-218, 2017.https://www.tehqeeqat.com/downloadpdf/28633.
- Chemical analysis of tobacco cigarettes for organochlorine insecticides and heavy metal composition. Toxicol Environ. Chem.. 2009;91:611-618.
- [CrossRef] [Google Scholar]
- Assessment of Cr, Cd and Pb levels in tobacco leaves and selected cigarette samples from Ilorin Metropolis Kwara State, Nigeria. J. Appl. Sci. Environ. Manag.. 2019;22:1937.
- [CrossRef] [Google Scholar]
- Barlas, H., Ubay, G., Soyhan, B., Bayat, C., 2001. Heavy metal concentrations of cigarettes in Turkey. Fresen. Environ. Bull. 10, 80–83.https://www.cabidigitallibrary.org/doi/full/10.5555/20013075856.
- Toxic metals in cigarettes and human health risk assessment associated with inhalation exposure. Environ. Monit. Assess. 2017;189
- [CrossRef] [Google Scholar]
- Toxic metal concentrations in cigarettes obtained from U.S. smokers in 2009: results from the International Tobacco Control (ITC) United States survey cohort. Int. J. Environ. Res. Public Health. 2013;11:202-217.
- [CrossRef] [Google Scholar]
- TRANSFER RATE OF CADMIUM, LEAD, ZINC AND IRON FROM THE TOBACCO-CUT OF THE MOST POPULAR HUNGARIAN CIGARETTE BRANDS TO THE COMBUSTION PRODUCTS. Acta Alimentaria. 2002;31(3):279-288.
- [Google Scholar]
- Assessment of different heavy metals in cigarette filler and ash from multiple brands retailed in Saudi Arabia. J. King Saud Univ. Sci.. 2021;33
- [CrossRef] [Google Scholar]
- Determination of toxic metals in Indian smokeless tobacco products. ScientificWorldJournal. 2009;9:1140-1147.
- [CrossRef] [Google Scholar]
- Mercury, cadmium, and lead in cigarettes from international markets: concentrations, distributions and absorption ability of filters. J. Toxicol. Sci.. 2021;9:401-411.
- [CrossRef] [Google Scholar]
- Trace metal concentrations in cigarette brands commonly available in Turkey: relation with human health. Toxicol. Environ. Chem.. 2012;94:1893-1901.
- [CrossRef] [Google Scholar]
- Eneji, I.S., Olalekan, S., Sha’ato, R., Eneji, Ishaq, S., Salawu, O.W., 2013. Analysis of heavy metals in selected cigarettes and tobacco leaves in Benue state, Nigeria. J. Sci. (JOS) 3 (1), 244–247..https://www.researchgate.net/profile/Ishaq-Eneji/publication/257047365_Analysis_of_Heavy_Metals_in_Selected_Cigarettes_and_Tobacco_Leaves_in_Benue_State_Nigeria/links/0046352441cba37db0000000/Analysis-of-Heavy-Metals-in-Selected-Cigarettes-and-Tobacco-Leaves-in-Benue-State-Nigeria.pdf.
- Assessment of heavy metals in tobacco of cigarettes commonly sold in Ethiopia. Chem. Int. 2017
- [CrossRef] [Google Scholar]
- Review of natural radioactivity in tobacco cigarette brands. J. Environ. Radioact. 2024;272:107348
- [CrossRef] [Google Scholar]
- Estimation of Polish cigarettes contamination with cadmium and lead, and exposure to these metals via smoking. Environ. Monit. Assess. 2008;137:481-493.
- [CrossRef] [Google Scholar]
- Heavy metal and polycyclic aromatic hydrocarbons in cigarettes: an analytical assessment. Popul Med.. 2020;2:1-4.
- [CrossRef] [Google Scholar]
- Concentrations and health risks assessment of heavy metals in cigarettes within Baghdad city. Int. J. Physical Res.. 2021;9:56-59.
- [CrossRef] [Google Scholar]
- Determination of trace elements in cigarette tobacco with the k 0-based NAA method using Es-Salam research reactor. J. Radioanal. Nucl. Chem.. 2009;281:535-540.
- [CrossRef] [Google Scholar]
- Evaluation of heavy metals in various brands of tobacco cigarettes marketed in pakistan and their implications in public health. J. Health and Rehabilitation Res.. 2024;4:1-8.
- [CrossRef] [Google Scholar]
- A review on cadmium contamination in soil and bioaccumulation by tobacco, its source, toxicity and health risk. Pelagia Research Library Asian J. Plant Sci. Res.. 2021;11:154-163.
- [Google Scholar]
- Heavy metals content and health risk assessment of the processed tobacco from malaysian cigarettes. Article Indian J. Environ. Protection. 2017
- [Google Scholar]
- Levels of selected heavy metals in some brands of cigarettes marketed in university of port harcourt, rivers state. J. Appl. Sci. Environ. Manage.. 2013;17:561-564.
- [Google Scholar]
- Toxic heavy metal (Pb and Cd) content in tobacco cigarette brands in Selangor state. Peninsular Malaysia. Environ. Monit Assess. 2019;191:637.
- [CrossRef] [Google Scholar]
- Heavy metal content of some jordanian and American cigarettes. ABHATH AL-YARMOUK: “Basic Sci. & Eng. 2003;12:231-243.
- [Google Scholar]
- Determination of major, minor and trace elements in cigarette tobacco samples from Karbala, Iraq. J. University of Kerbala 2022
- [Google Scholar]
- The relationship between cadmium contents of tobacco and their ash in cigarettes marketed under different brands. FABAD J. Pharm. Sci.. 2012;37:129-132.
- [Google Scholar]
- Evaluation of the level of some heavy metals in tobacco of domestic and imported cigarette brands used in Iraq. Baghdad Sci. J.. 2015;Vol
- [Google Scholar]
- Toxic metals distribution in different components of Pakistani and imported cigarettes by electrothermal atomic absorption spectrometer. J. Hazard Mater. 2009;163:302-307.
- [CrossRef] [Google Scholar]
- Determination of lead and arsenic in tobacco and cigarettes: an important issue of public health. Cent Eur. J. Public Health. 2012;20:62-66.
- [CrossRef] [Google Scholar]
- Human risk assessment for heavy metals and as contamination in the abandoned metal mine areas, Korea. Environ. Monit Assess. 2006;119:233-244.
- [CrossRef] [Google Scholar]
- Chromium levels in tobacco, filter and ash of illicit brands cigarettes marketed in Brazil. J. Anal Toxicol.. 2020;44:514-520.
- [CrossRef] [Google Scholar]
- Investigation of toxic metals in the tobacco of pakistani cigarettes using proton-induced X-ray emission. Ion Beam Techniques and Applications. IntechOpen 2020
- [CrossRef] [Google Scholar]
- Analysis of mexican cigarettes by INAA. J. Radioanal. Nucl. Chem.. 2008;278:365-370.
- [CrossRef] [Google Scholar]
- Determination of cadmium and lead in different cigarette brands in Jordan. Environ. Monit Assess. 2005;104:163-170.
- [CrossRef] [Google Scholar]
- Sebiawu, G.E., Etsey Sebiawu, G., Mensah, N.J., Ayiah-Mensah, F., 2014. Analysis of Heavy Metals Content of Tobacco and Cigarettes sold in Wa Municipality of Upper West Region, Ghana. Online.25(24-33).https://core.ac.uk/download/pdf/234688984.pdf.
- Determination of Copper and Zinc in different brands of cigarettes in Jordan. Acta Chim.Slov. 2003;50(375–381)
- [Google Scholar]
- Impact of North Mara gold mine on the element contents in fish from the river Mara, Tanzania. J, Radioanal Nucl. Chem.. 2016;309
- [CrossRef] [Google Scholar]
- Determination of heavy metals and health risk assessment in indoor dust from different functional areas in Neyshabur, Iran. Indoor and Built Environ.. 2021;30:1781-1795.
- [CrossRef] [Google Scholar]
- Cadmium determination in cigarettes available in Nigeria. Afr. J. Biotechnol.. 2005;4:1128-1132.
- [Google Scholar]
- Heavy metals concentration and human health risk assessment in tobacco cigarette products from Tanzania. Chin. J. Anal. Chem.. 2024;52:100428
- [CrossRef] [Google Scholar]
- Toxic metal and nicotine content of cigarettes sold. Tob. Control. 2014;24:iv55-iv59. (in China, 2009 and 2012)
- [CrossRef] [Google Scholar]
- Heavy metal content in mainstream cigarette smoke of common cigarettes sold in Kenya, and their toxicological consequences. Int. Res. J. Environ. Sci. Int. Sci. Congress Association.. 2015;4(6):75-79.
- [Google Scholar]
- Onojah, P.K., Daluba, N.E., Odin, 2019. Investigation of heavy metals in selected samples of cigarette randomly purchased from local markets in anyigba and its environment and tobacco leaves grown in kogi state. Int. J. Innovative Res. Technol & Sci..17(1).https://www.ajol.info/index.php/sa/article/view/184830.
- Distribution of heavy metal and macroelements of Indian and imported cigarette brands in Turkey. Environ. Sci. Pollut. Res.. 2019;26:28210-28215.
- [CrossRef] [Google Scholar]
- Toxic elements in tobacco and in cigarette smoke: Inflammation and sensitization. Metallomics 2011
- [CrossRef] [Google Scholar]
- Pashapour, S., Mousavi, Z., Ziarati, P., Najafabadi, K.E., 2015. Comparison of the level of cadmium and lead between the cigarette filters of different iranian and non-iranian brands, Iranian. J. Toxicology.. IJT 2015, 9(29): 1296-12300.https://ijt.arakmu.ac.ir/article-1-386-en.pdf.
- Assessment of heavy metal levels in roll-your-own cigarette and water pipe tobacco blends. BIO Web Conf.. 2023;58:01021.
- [CrossRef] [Google Scholar]
- Investigation of heavy metal content of Turkish tobacco leaves, cigarette butt, ash, and smoke. Environ. Monit Assess. 2013;185:9471-9479.
- [CrossRef] [Google Scholar]
- Evaluation of heavy metal content in main stream smoked cigarettes and non-smoked tobacco in Kenya. IOSR J. Appl. Chem. (IOSR-JAC. 2020;13:39-45.
- [CrossRef] [Google Scholar]
- Metals transfer from tobacco to cigarette smoke: evidences in smokers’ lung tissue. J. Hazard Mater. 2017;325:31-35.
- [CrossRef] [Google Scholar]
- Pourkhabbaz, A., Pourkhabbaz, H., 2012. Investigation of toxic metals in the tobacco of different iranian cigarette brands and related health issues. Toxic Metals in the Tobacco of Cigarette Brands Iran J. Basic Med. Sci..15(1):636-44.https://www.ncbi.nlm.nih.gov/pmc/articles/PMC3586865.
- Determination of Pb (Lead), Cd (Cadmium), Cr (Chromium), Cu (Copper), and Ni (Nickel) in Chinese tea with high-resolution continuum source graphite furnace atomic absorption spectrometry. J. Food Drug Anal.. 2016;24:46-55.
- [CrossRef] [Google Scholar]
- Solidum, J., 2013. Lead, cadmium and chromium in selected local cigarettes available in the Philippines. Int. J. Chemical and Environ. Eng..4(4).https://citeseerx.ist.psu.edu/document?repid=rep1&type=pdf&doi=784f2fa7516638b44a789ce2106e2da74575e84c.
- The world health organization’s world no tobacco day 2020 campaign exposes tobacco and related industry tactics to manipulate children and young people and hook a new generation of users. J. Adolesc. Health. 2020;67:334-337.
- [CrossRef] [Google Scholar]
- Strungaru, S.-A., Nicoara, M., Dacia PETROAIE, A., Plavan, G., 2018. Heavy metals in common tobacco brands from legal market and black market of iaşi-roumania. Rev. Roum. Chim.. 63(10), 903-909.https://revroum.lew.ro/wp-content/uploads/2018/10/Art%2004.pdf.
- Assessment of trace metal concentration and health risk of artisanal gold mining activities in Ijeshaland, Osun State Nigeria— Part 1. J. Geochem. Explor. 2017;177:1-10.
- [CrossRef] [Google Scholar]
- Evaluating the health risk of metals (Zn, Cr, Cd, Ni, Pb) in staple foods from Lagos and Ogun States, Southwestern Nigeria. Environ. Monit Assess. 2019;191
- [CrossRef] [Google Scholar]
- USEPA, 2023. Regional screening level (RSL) summary table [WWW Document]. USEPA. URL https://www.epa.gov/risk/regional-screening-levels-rsls-generic-tables (accessed 12.27.23).
- Biosensor for heavy metals detection in wastewater: a review. Food Chem. Toxicol.. 2022;168:113307
- [CrossRef] [Google Scholar]
- Trace metal concentration in different Indian tobacco products and related health implications. Food Chem. Toxicol.. 2010;48:2291-2297.
- [CrossRef] [Google Scholar]
- Assessment of carcinogenic heavy metal levels in Brazilian cigarettes. Environ. Monit Assess. 2011;181:255-265.
- [CrossRef] [Google Scholar]
- Neutron activation analysis of trace metals in cigarette, Nigerian. J. Chem. Res. 2010
- [Google Scholar]
- Carcinogenic and non-carcinogenic health risk assessment of organic compounds and heavy metals in electronic cigarettes. Sci. Rep.. 2023;13
- [CrossRef] [Google Scholar]
- Health risk assessment of heavy metal exposure to street dust in the zinc smelting district, Northeast of China. Sci. Total Environ.. 2010;408:726-733.
- [CrossRef] [Google Scholar]
- Analysis of heavy metals in cigarette tobacco. J. Medical Discovery. 2016;2
- [CrossRef] [Google Scholar]
- Cadmium concentration in cigarette brands, tobacco leaves, and smokers’ blood samples. Herbal Medicines J.. 2019;4:11-18.
- [CrossRef] [Google Scholar]
Appendix A
Supplementary data
Supplementary data to this article can be found online at https://doi.org/10.1016/j.jksus.2024.103484.
Appendix A
Supplementary data
The following are the Supplementary data to this article:


