

Translate this page into:
Repositioning of strongly integrated drugs against achromatopsia (CNGB3)
⁎Corresponding author. amabbasi@cuiatd.edu.pk (Arshad Mehmood Abbasi)
-
Received: ,
Accepted: ,
This article was originally published by Elsevier and was migrated to Scientific Scholar after the change of Publisher.
Abstract
Abstract
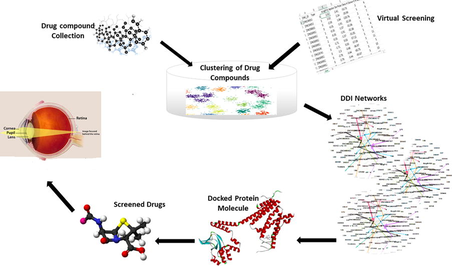
Studies shows that bioinformatics-primarily based methods have the capability to offer systematic insights into the complex relationships. Virtual screening is used, to filter and identify new compounds on the basis of their biological structures from the large set of drug compounds library. K means algorithm was used for grouping homologous drug compounds by using bioinformatics tool. The clustered drug compounds were analyzed by applying the attribute of modularity and layouts of expansion, fruchterman Reingold. Modularity based clustering technique determine the potential of drug’s interactions for treatments. DDIs reflect the intervention of several behaviors of the drug. LD50 indicates the relative intense risks of modern chemicals, particularly at the point when no other toxicology information are accessible for the chemicals. For Protein structure prediction ab initio method was used and a number of possible confirmations were generated.
Abstract
Achromatopsia (ACHM) is a genetically heterogeneous visual disorder, also known as rod monochromatism, in which human get affected due to cone cells. Mutation in five genes viz. CNGA3, CNGB3, GNAT2, PDE6C, and PDE6H have been reported in ACHM. These genes encode essential constitutes of the cone-specific photo transduction cascade. Present study was focused on CNGB3 gene that accounts 40%-50% mutations of all ACHM cases. A new approach for analyzing drug-drug interactions based on modularity was adopted. This approach depends on the behavioral relationship of drugs against CNGB3 for ACHM, particularly the ADME and toxicity between drugs. Data of 2475 compounds were retrieved, out of which 185 were selected on the basis of Lipinski rule of five. In total, eight clusters were made for which the strongly interacted DDI networks were build based on their modularity values. Strong DDI and minimum toxic values indicates that 5 drugs are effective, but on the basis of docking only 2 drugs indicated no bumps, which shows that they are most appropriate for treating ACHM. Our findings revealed that drug-drug interactions disclose the intervention of drug nature and can also successfully diagnose new indications and more convincing drugs for other diseases as well.
Keywords
Achromatopsia
CNGB3
In silico
Integrated drugs

- ACHM
Achromatopsia
- CNG
Cyclic Nucleotide-Gated Channels
- ADMET
absorption distribution metabolism excretion and toxicity
- FDA
Food and Drug Administration
- CMap
Connectivity Map Project
- LINCS
Integrated Network-Based Cellular Signatures
- GEO
Gene Expression Omnibus
- DDI
Drug-drug interactions
- PDE6H
Phosphodiesterase 6H
- CNGA3
cyclic nucleotide gated channel alpha 3
- GNAT2
G Protein Subunit Alpha Transducin 2
- CNGB3
cyclic nucleotide gated channel beta 3
- PDE6C
Phosphodiesterase 6c
Abbreviations
1 Introduction
Vision of the photons or images is accomplished by photoreceptor cells viz. cone and rod cells (Schnapf and Baylor, 1987). Achromatopsia (or rod monochromatism), is a visual disorder in which eye gets affected due to cone cells’ abnormality. ACHM is an autosomal recessive inactive cone dystrophy that occurs in complete and incomplete forms (Chiang et al., 2017), which is characterized by a limited or complete absence of color vision (Johnson, 2004). The rate of ACHM prevalence is approximately 1 in 30,000 (Zobor et al., 2017). Some major symptoms of achromatopsia, are hyperopia, nearsightedness (myopia), an enlarged sensitivity to light and brightness, involuntary back and forth eye movements of eyeballs, and expressively reduced perceptiveness of vision (Chen et al., 2015). In addition to these defects, ACHM patients also experience different degrees of cone photoreceptor degeneration (Michalakis et al., 2005).
ACHM is inherited in an autosomal recessive manner with varying percentages in different regions. Probability of ACHM inheritance to get affected is 25% and the chances of being unaffected is also 25%, while 50% chances of being an asymptomatic carrier in individuals (Kohl and Jägle, 1993). Mutations in these five genes CNGA3 ‘cyclic nucleotide-gated cation channel alpha-3′, CNGB3 ‘cyclic nucleotide-gated cation channel beta-3′, GNAT2 ‘guanine nucleotide-binding protein G(t) subunit alpha-2′ PDE6C ‘the catalytic alpha-subunit of the cone cyclic nucleotide phosphodiesterase', and PDE6H ‘the inhibitory gamma-subunit of the cone photoreceptor PDE’ have been reported in ACHM. Mutations in CNGB3 represents 40 to 50% of all ACHM cases, representing the most recognized cause of this disorder. Another most common reason is the mutations of CNGA3, which is around 25% of the Achromats (Chen et al., 2015). Mutation in CNG genes are anticipated in majority of ASHM cases. Mutations in the four non-CNG channel encoding ACHM qualities are significantly less, with a record of about 6% of the cases. Cyclic nucleotide gated channel beta 3 (CNGB3) encodes the beta subunit of a cyclic nucleotide-gated molecule channel (Biel et al., 1999). The beta subunit encoded by CNGB3 assume a vital part in the working of cone photoreceptor (Mühlfriedel et al., 2014). The CNG channels positioned in the plasma membrane remain open in darkness by cyclic guanosine monophosphate (cGMP), creating an inward positive current (Zein et al., 2014). Approximately 80% of the mutations in the CNGA3 and CNGB3 of all complete ACHM cases have been reported.
Arrangement of a particular set of objects/items based on their characteristics and similarities in such a way that data points in the same groups are more similar to other data points in the same group than those in other groups (Udrescu et al., 2016). Clustering is an important region of utility for the arrangement of fields which includes statistics mining, statistical evaluation, compression, and vector quantization. Clustering has been formulated as a successful approach for getting to know about sample recognition, optimization, and data literature. Gephi25, a leading tool in visualization and analysis of large networks that process cluster based drug-drug interaction networks, including computation of statistics, modularity clustering, and graphical layouts. Drug-drug interactions can motive early improvement, refusal of endorsement, recommending limitations, and withdrawal of medications from the commercial center (Bjornsson et al., 2003).
Repositioning of the existing drugs ought to increase the productiveness efficiently. The costs for bringing a drug to the marketplace are 60% lesser than the development of a novel drug, which charges around one thousand million US dollars (Haupt and Schroeder, 2011). With the successful clinical advent of number of remedies, drug repositioning now has become an effective alternative approach to find out and increase novel anticancer drug applicants (Shim and Liu, 2014). Recent studies have shown that bioinformatics-primarily based methods have the capability to offer systematic insights into the complex relationships for a successful repositioning. The gene therapy being used against ACHM mutated genes are not effective enough therefore there is a need to identify better drugs for it. The focus of the research study is to reposition a effective drugs against CNGB3 gene based on clustering based drug-drug interaction networks.
2 Materials and methods
A clustering based methodology for drug repositioning against achromatopsia was applied. It comprises of clustering the properties of drug data for the development of strongly interacted DDIs, which leads to the repositioning of drugs and the toxicity of the selected drugs are checked to make the final recommendation of the drugs against achromatopsia.
2.1 Collection and mining of drug property data
ZINC Database was used for the collection of compounds against CNGB3 and approximately 2475 compounds were collected along with their structures and chemical properties such as Drug’s Zinc ID, LogP, Molecular weight, Hydrogen bond Donors (HBD), Hydrogen Bond Acceptors (HBA), Rotatable bonds, a-polar dissociation and polar dissociation. Virtual screening was used, a computer-based method to filter and identify new compounds on the basis of their biological structures from the large set of compounds library (Shoichet, 2004). The large set of drug data were obtained from ZINC database, through virtual screening.
To get the desired subset of data from a large set of data, mining was performed. Lipinski rule of five was used for the mining of the data which is an important step in drug discovery process. Lipinski rule of five delineates that value for hydrogen bond donor <5, hydrogen bond acceptors <10, subatomic weight is under 500 g/mol, segment coefficient log P esteem is under 5, number of rotatable bonds ought to be more prominent than 10. Drug compounds that fulfill the Lipinski rule were selected while the rest were discarded.
2.2 Clustering of drugs using WEKA tool
Weka (Waikato Environment for Knowledge Analysis) is based on machine learning calculations for settling genuine information, mining issues and a suitable way for machine learning programming (Hall et al., 2009). Weka tool was used for clustering on the drug’s information data by simple K means clustering. This process follows a simple and easy way to classify a given set of data (x1, x2, x3…… xn) into a no of K clusters (K ≤ N) according to their properties. The optimal number of cluster K(n) was determined using Elbow method given by Kodinariya and Makwana (2013) where K is the number of clusters and n is the data set.
2.3 DDI networks generation
Drug-Drug interaction networks were built which are based on K means clustering to find out the strong associations between drug compounds within each cluster by using Gephi tool. Gephi is a principal tool for analyzing the data, exhibit the feature of fastest graph visualization, potential to work with complex data and layout algorithms for the large networks (Bastian et al., 2009). Each network consists of the set of vertices V and edge E, average path length L, degree D of nodes, Network Density, and modularity classes.
2.4 Identification of strongly interacted DDI
The single cluster was identified from the set of other strongly drug-drug interactions so that the research move ahead from general to specific. A single cluster was identified so that the drugs can be selected which are strongly interacted to achromatopsia.
2.5 ADME and toxicity of the drugs
To determine the mode of action of the obtained drugs ADMET predictor and ProTox was used. The ProTox web server has a simple to utilize interface (Drwal et al., 2014) and the main necessity was the 2D structure of the atom for which the danger is to be anticipated. Those drug compounds whose toxicity level was <4 were neglected. Only 5 drug compounds were considered for repositioning against achromatopsia.
2.6 Repositioning of drugs
The drug compounds, which lie in a low toxic classes, were suggested to be used in combination with each other to achieve maximal results during the treatment. DDIs reflect the intervention of several behaviors of the drug. The drug-repositioning analysis was based on a systematic approach. The strategy explained in this research is based on the behavioral interactions between drugs rather than the structural similarities characterized by chemical-structures interactions or drug-target interactions.
3 Results
ZINC database was used to retrieve the data of 2475 drug compounds and those which followed the rules of Lipinski were considered (184 drugs) while others were discarded.
3.1 Cluster formation
WEKA tool was used to identify and generate the clusters. 8 clusters were identified based on Elbow method for 184 drug compounds. Furthermore, K means algorithm was used for grouping homologous drug compounds. The Clusters were generated for those drug compound which follow the Lipinski rule of five as shown in Figs. 1–10.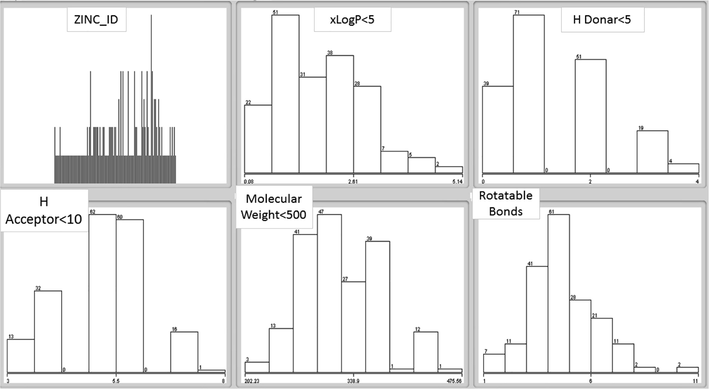
Bar graph representation of each clusters along with attributes.
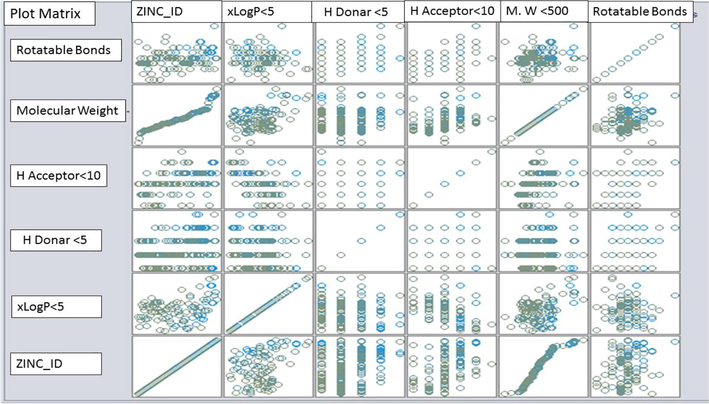
Plot matrix representation of the clusters along with their attributes.
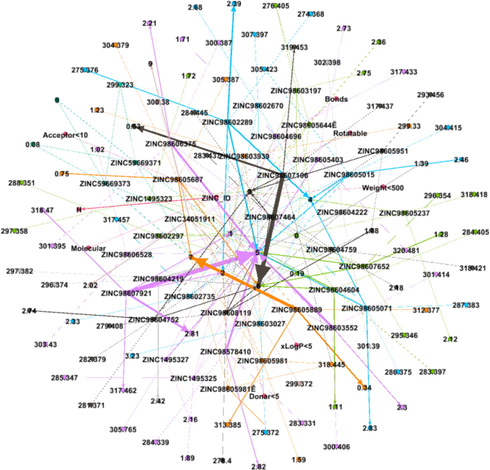
DDI Network 1 showing strong interactions of 1st cluster consisting of 29 drug compounds, interactions between the drugs compounds are shown by dotted lines, while the strong interactions are represented by solid lines.

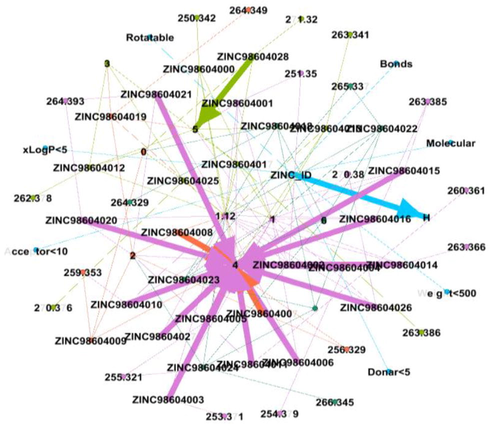
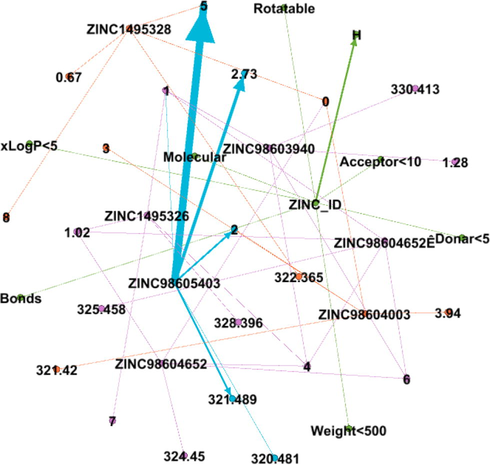
DDI Network 2 showing strong interactions of 2nd cluster consisting of 5 drug compounds, interactions between the drugs compounds are shown by dotted lines, while the strong interactions are represented by solid lines.
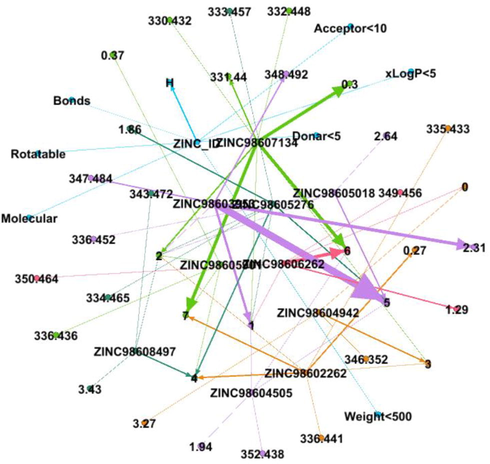
DDI Network 3 showing strong interactions of 3rd cluster consisting of 62 drug compounds, interactions between the drugs compounds are shown by dotted lines, while the strong interactions are represented by solid lines.
DDI Network 4 showing strong interactions of 4th cluster consisting of 9 drug compounds, interactions between the drugs compounds are shown by dotted lines, while the strong interactions are represented by solid lines.
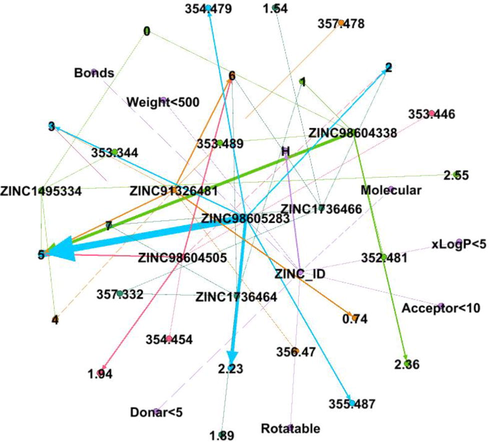
DDI Network 5 showing strong interactions of 5th cluster consisting of 19 drug compounds, interactions between the drugs compounds are shown by dotted lines, while the strong interactions are represented by solid lines.
DDI Network 6 showing strong interactions of 6th cluster consisting of 19 drug compounds, interactions between the drugs compounds are shown by dotted lines, while the strong interactions are represented by solid lines.
DDI Network 7 showing strong interaction of 6th cluster consisting of 13 drug compounds, interactions between the drugs compounds are shown by dotted lines, while the strong interactions are represented by solid lines.
DDI Network 8 showing strong interactions of 8th cluster consisting of 37 drug compounds, interactions between the drugs compounds are shown by dotted lines, while the strong interactions are represented by solid lines.
Fig. 1 shows the bar graph representation of clusters having attributes along with the values of xLogP < 5, H Donor < 5, H Acceptor < 10, Molecular weight < 500 and those having rotatable bonds. Each cluster possess those drug compounds with similar properties.
Fig. 2 shows the clusters by plot matrix having dot representations along with their attributes of xLogP < 5, H Donor < 5, H Acceptor < 10, Molecular weight (M.W) < 500 and rotatable bonds.
3.2 Drug-drug interaction network generation
DDI method is used which is based on the clustering approach to recognize the best drug compounds (Langlo et al., 2015) which can be utilized to treat CNGB3 mutations. The clustered drug compounds were analyzed in GEPHI by applying the attribute of modularity, layouts of expansion and Fruchterman rein gold to visualize the interactions of modules in the network. 8 distinct DDI’s were built. Each cluster comprised of nodes and edges where nodes symbolizes unique drug.
There were 8 distinct DDI’s, developed by GEPHI. The network 1 consist of 68 nodes and 137 edges with Average Degree of 4.029 and Average Path length 1.0, network 2 consist of 26 nodes and 27 edges with Average Degree of 2.077 and Average Path length 1.0, whereas network 3 comprises of 144 nodes and 228 edges with Average Degree of 3.167 and Average Path length 1.0, 38 nodes and 44 edges in network 4 with Average Degree of 2.316 and Average Path length 1.0, 53 nodes and 65 edges in network 5 with Average Degree of 2.453 and Average Path length 1.0, 41 nodes and 49 edges in network 6 with Average Degree of 2.390 and Average Path length 1.0, 81 nodes and 125 edges in network 7 with Average Degree of 3.086 and Average Path length 1.0 similarly network 8 possess 34 nodes and 35 edges with Average Degree of 2.059 and average path length 1.0 as shown above in Fig (3, 4, 5, 6, 7, 8, 9, 10) respectively.
3.3 Modularity and degree distribution analysis
Modularity classes of all drug-drug interaction networks were retrieved by using Gephi tool (Table 1). Modularity and degree distribution are an important parameter of any network. Nodes of the networks were colored on the basis of its modularity class. This outcome determines that modularity being a decent indicator of properties and usefulness of chemical compounds.
Networks
Average degree
Average weighted degree
Network diameter
Density
Modularity
Average path length
Network 1
4.029
2.265
1
0.030
0.403
1.0
Network 2
2.077
1.308
1
0.042
0.581
1.0
Network 3
3.167
2.215
1
0.011
0.539
1.0
Network 4
2.316
1.421
1
0.031
0.648
1.0
Network 5
2.453
1.962
1
0.024
0.587
1.0
Network 6
2.390
1.805
1
0.030
0.505
1.0
Network 7
3.086
2.395
1
0.019
0.534
1.0
Network 8
2.059
1.294
1
0.031
0.629
1.0
3.4 Repositioning of strongly interacted drug
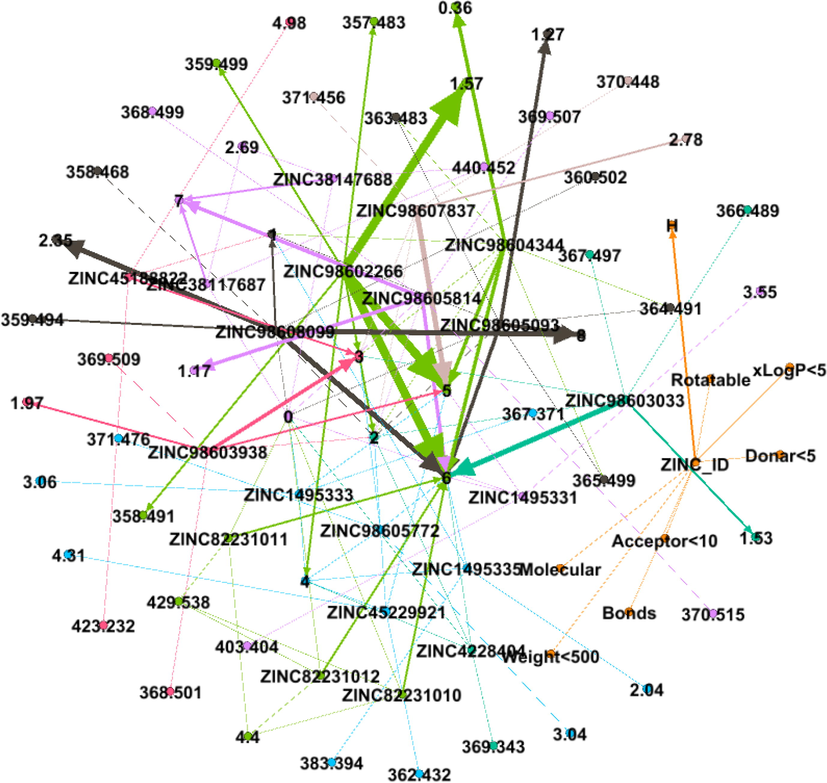
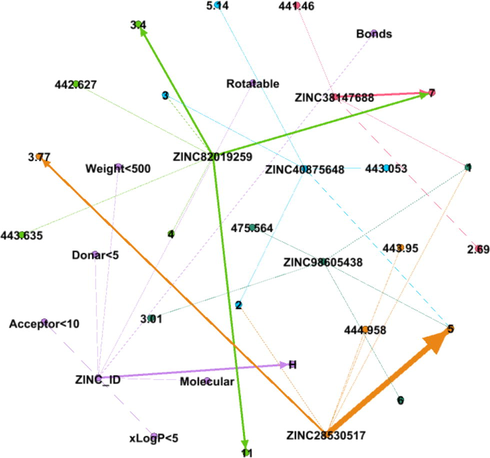
Out of 8 DDI networks, drugs with strong interactions and having a modularity class greater than 4 were selected and final strongly interacted network was built. GEPHI was used to make the strongly interacted cluster. Out of 184, 46 drugs have greater modularity value. Final strongly interacted DDI network is depicted in Fig. 11.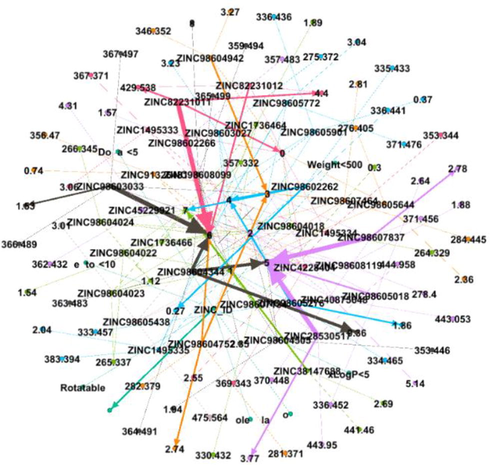
Final Strongly Interacted drug network, interactions between the drugs compounds are shown by dotted lines, while the strong interactions are represented by solid lines.
The final strongly interacted network consist of 126 nodes and 129 edges. All the parameters i.e. Average path length, graph density, network diameter, modularity class, average degree of the network were calculated and the drugs that were having strong interactions were selected. 31 drug compounds were strongly interacted to one another. The Average degree, average weighted degree, network diameter, density, modularity, average path length are shown in Table 2.
Average degree
Average weighted degree
Network diameter
Density
Modularity
Average path length
Final strongly interacted network
3.111
1.857
1
0.012
0.541
1
The chemical properties of selected drugs that were strongly interacted to each other and fulfilling the Lipinski rule of 5 are shown below in Table 3.
ZINC ID’s
XLogP
Hydrogen donor
Hydrogen Acceptor
Molecular weight
Rotatable bonds
ZINC98603033
1.53
3
6
367.497
6
ZINC98604505
1.94
2
6
353.446
5
ZINC1495335
2.04
1
6
383.394
4
ZINC98607134
0.3
1
6
330.432
7
ZINC98605438
3.01
1
6
475.564
5
ZINC98604024
0.89
1
4
295.428
3
ZINC1736466
1.54
2
6
357.332
7
ZINC4228404
2
0
6
369.343
4
ZINC91326481
0.74
3
6
356.47
5
ZINC98604344
0.36
1
6
363.483
5
ZINC98607464
2.18
0
3
283.437
6
ZINC98602266
1.57
2
6
357.483
5
ZINC82231011
4.4
0
6
429.538
6
ZINC98605772
3.04
3
4
371.476
6
ZINC98604018
1.13
1
6
316.429
5
ZINC98604022
1.12
2
6
351.515
6
ZINC98608099
2.35
0
6
358.468
8
ZINC1736464
1.89
1
6
357.332
7
ZINC98604752
2.74
1
3
281.371
6
ZINC98605772
3.04
3
4
371.476
6
ZINC40875648
5.14
2
5
443.053
3
ZINC98605018
2.64
2
5
336.452
5
ZINC28530517
3.77
1
5
443.950
5
ZINC1495333
3.06
0
5
367.371
4
ZINC98607837
2.78
2
5
370.448
5
ZINC45229921
4.31
2
5
362.432
4
ZINC98605276
1.86
1
5
333.457
4
ZINC1495334
2.55
0
5
353.344
4
ZINC98603027
3.23
0
4
274.364
5
ZINC98602262
0.27
2
7
335.433
4
ZINC98605644
2.36
0
3
276.405
1
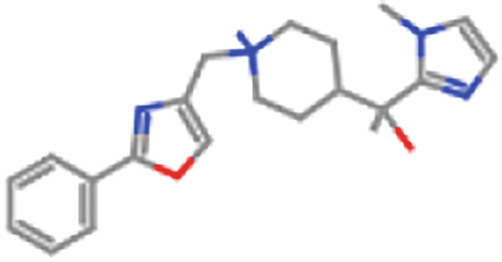
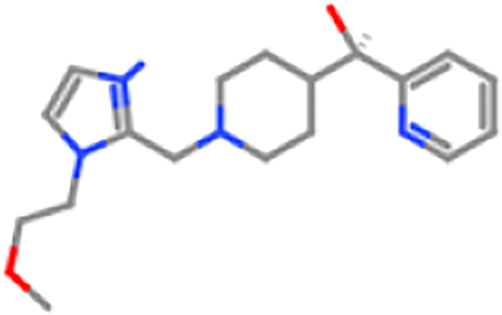
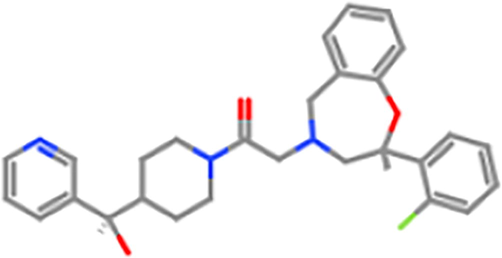
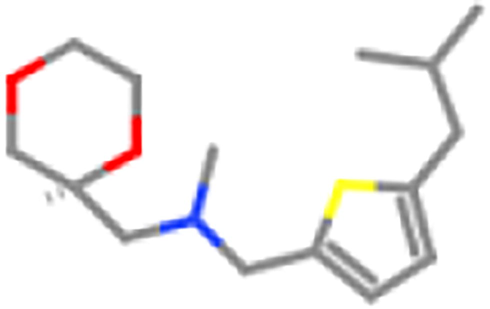
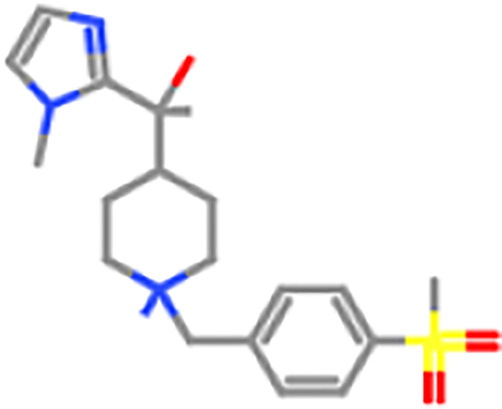
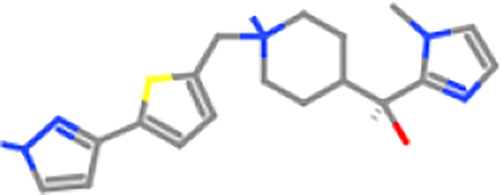
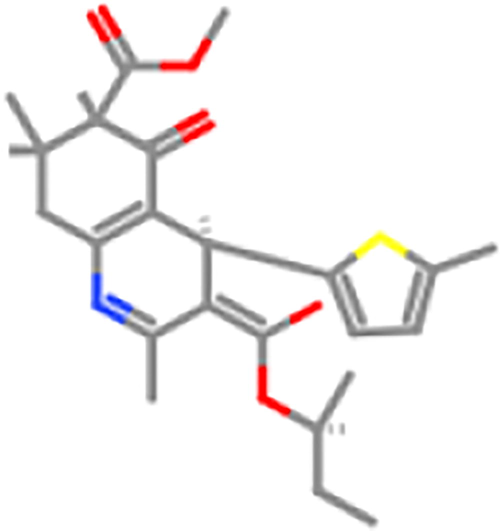
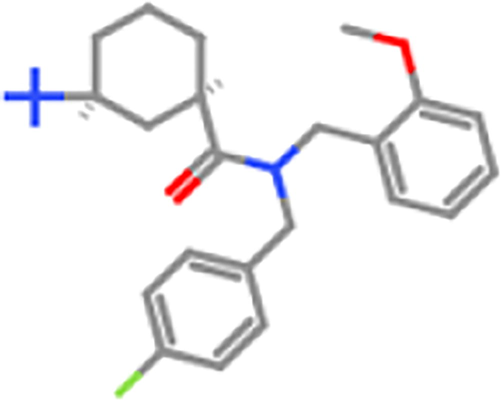
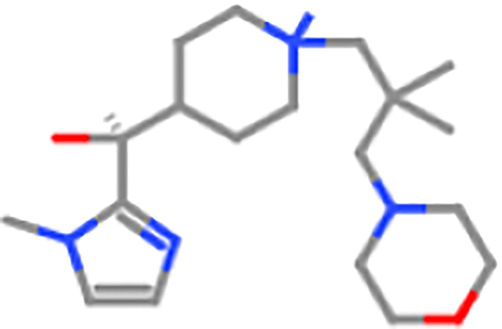
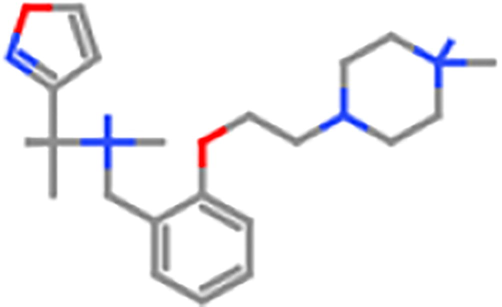
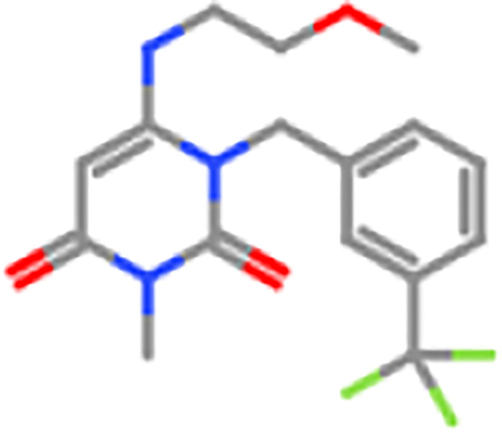
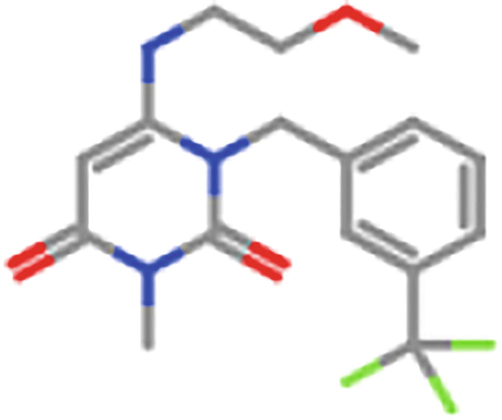
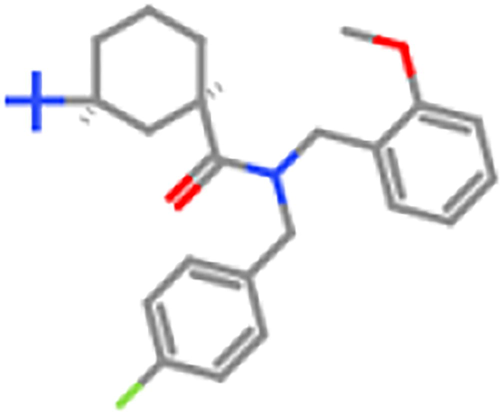
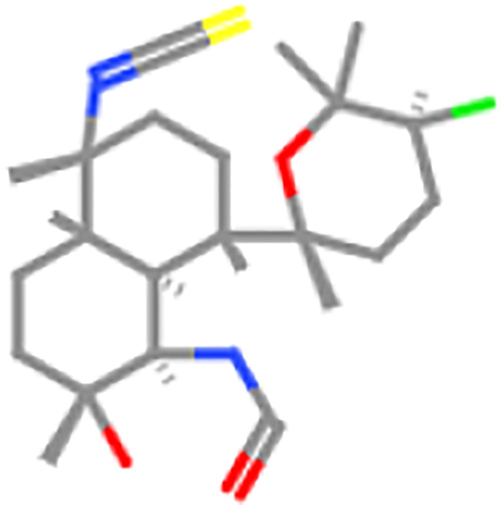
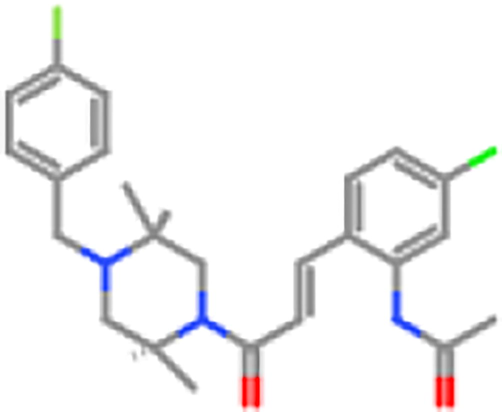
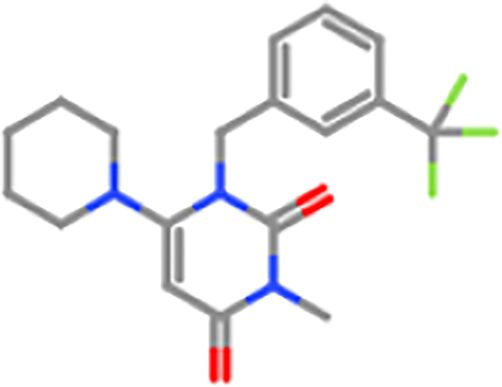
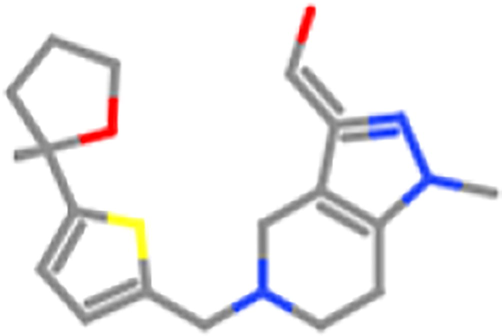
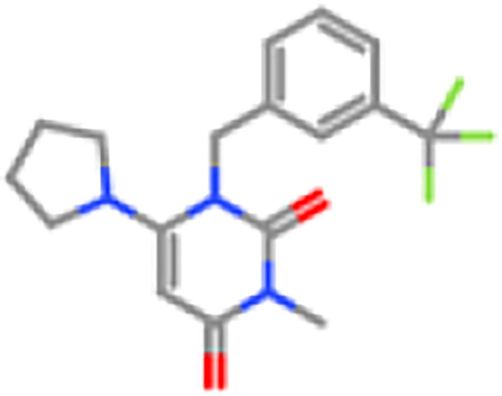
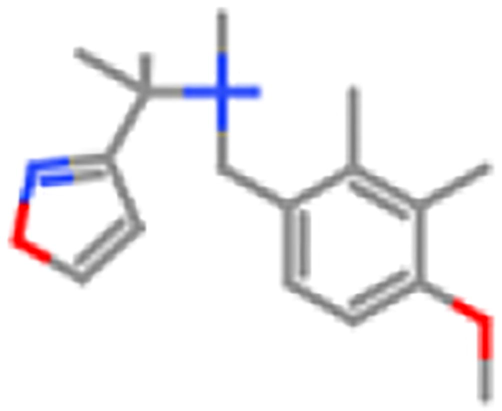
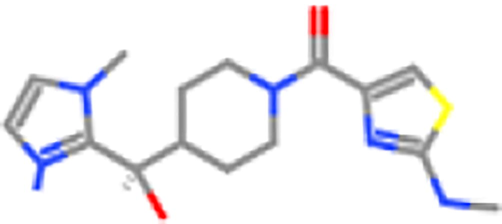
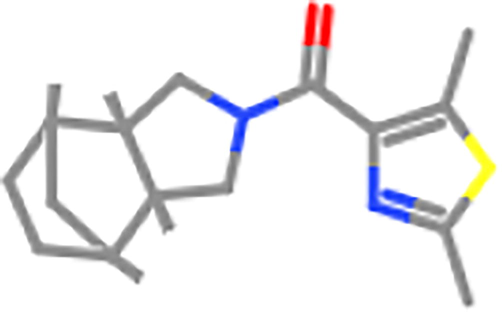
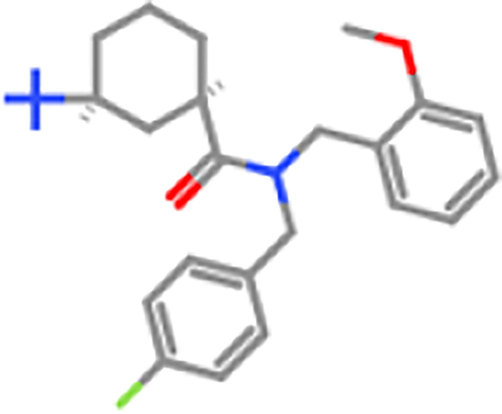
In final network total 37 strongly interacted drugs were determined. Then toxicity class of these drugs were examined. Toxic doses are often managed as LD50 values in mg/kg of the body weight. Some intense harmfulness tests, (for example, the “established” LD50 test) are intended to decide the mean lethal dosage of the test substance (Dastmalchi et al., 2016). The middle lethal measurements is characterized as the dosage of a test substance that is lethal for half of the creatures in a measurements gathering (Toxicity–Up, 2001).
LD50 esteems have been utilized to ensure about relative intense risks of modern chemicals, particularly at the point when no other toxicology information are accessible for the chemicals. In any case, numerous imperative perceptions of poisonous quality are not spoken to by LD50 esteems or by inclines of dosage reaction bends for lethality. The oral toxicity of selected drugs that lie under acceptable toxic class are shown in Table 4.
S. #
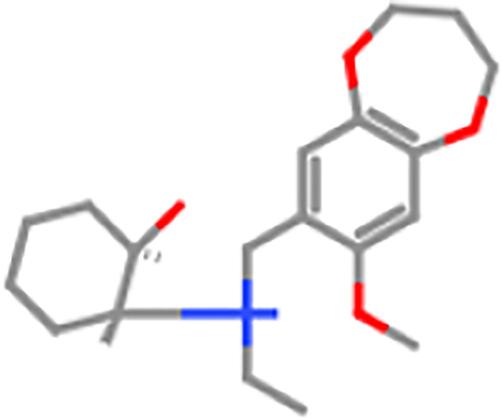
Structures
Zinc ID
LD50
Toxicity class
1
ZINC98603033
500 mg/kg
4
2
ZINC98604505
500 mg/kg
4
3
ZINC98607134
303 mg/kg
4
4
ZINC98605438
550 mg/kg
4
5
ZINC98604024
1250 mg/kg
4
6
ZINC1495335
660 mg/kg
4
7
ZINC1736466
1000 mg/kg
4
8
ZINC4228404
1000 mg/kg
4
9
ZINC91326481
400 mg/kg
4
10
ZINC98607464
1000 mg/kg
4
11
ZINC98604344
4000 mg/kg
5
12
ZINC98602266
500 mg/kg
4
13
ZINC82231011
1000 mg/kg
4
14
ZINC98605772
5000 mg/kg
5
15

ZINC98604018
3500 mg/kg
5
16
ZINC98604022
3500 mg/kg
5
17
ZINC98608099
700 mg/kg
4
18
ZINC1736464
1000 mg/kg
4
19
ZINC98604752
750 mg/kg
4
20
ZINC98605772
5000 mg/kg
5
21
ZINC40875648
1240 mg/kg
4
22
ZINC98605018
3500 mg/kg
5
23
ZINC28530517
500 mg/kg
4
24
ZINC1495333
1000 mg/kg
4
25
ZINC98607837
370 mg/kg
4
26
ZINC45229921
400 mg/kg
4
27
ZINC98605276
640 mg/kg
4
28
ZINC1495334
1000 mg/kg
4
29
ZINC98603027
1400 mg/kg
4
30
ZINC98602262
1250 mg/kg
4
31
ZINC98605644
1250 mg/kg
4
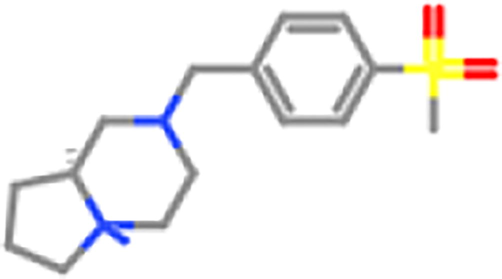
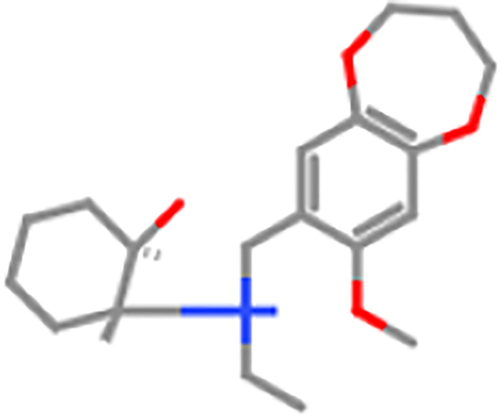
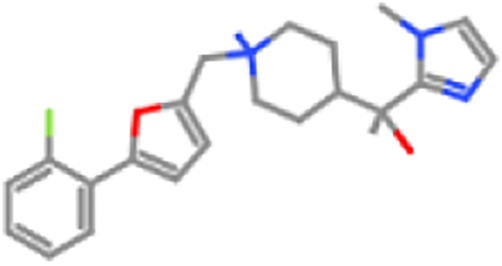
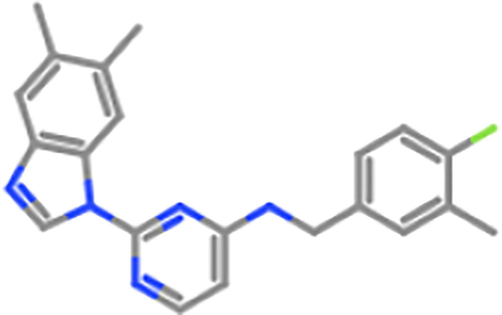
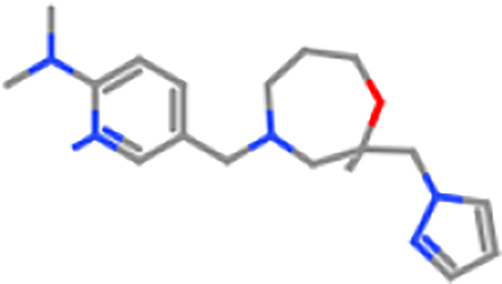
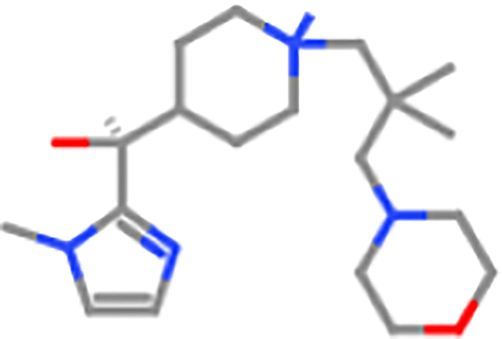
Out of 37 drugs, 31 drugs were selected. This selection was completely based on toxicity class of the drugs and 6 drugs were discarded because of their high toxicity. 5 drugs were lying on toxicity class 5 while 25 drugs were lying on toxicity class 4, both of which are nontoxic classes. As 6 drugs were lying on toxicity class 5, were selected and as these drugs can have synergic effect, so can be given to patients in combination to one another for achieving more efficient and maximal results. These 6 drug can be furthermore examined with in vivo and in vitro methods, to confirm the suggestedrepositioning or interactions. The toxicity of selected drugs are shown below in Table 5.
S #
Structures
Zinc ID
Predicted LD50
Toxicity class
1

ZINC98604344
4000 mg/kg
5
2
ZINC98605772
5000 mg/kg
5
3
ZINC98604018
3500 mg/kg
5
4
ZINC98604022
3500 mg/kg
5
5
ZINC98605018
3500 mg/kg
5
3.5 Molecular docking analysis
Structure of CNGB3 (Fig. 12) is not reported yet. Ab initio method was used to generate a number of possible confirmations and the final model is selected from them, which depends on energy function, conformational search and selection of native. Phyre 2 server fallowed by ab initio approach was used to make computational structure prediction of CNGB3. Phyre2 (http://www.sbg.bio.ic.ac.uk/phyre2) is a web server for protein modeling, prediction and analysis.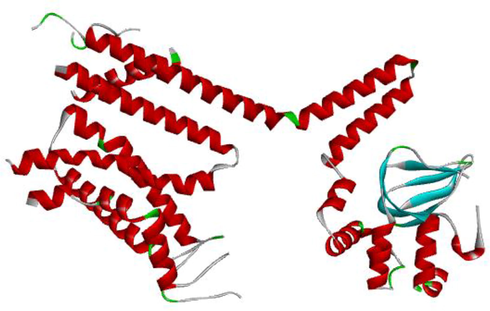
Predicted structure of CNGB3 by Phyre2.
The selected drugs (5) having minimum toxicity, were submitted to patchdock along with CNGB3 structure, having .pdb format. Patchdock (http://bioinfo3d.cs.tau.ac.il/PatchDock/patchdock.html) is an algorithm for molecular docking which may be of proteins, DNA, peptides or drugs.
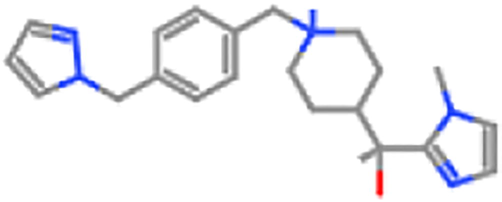
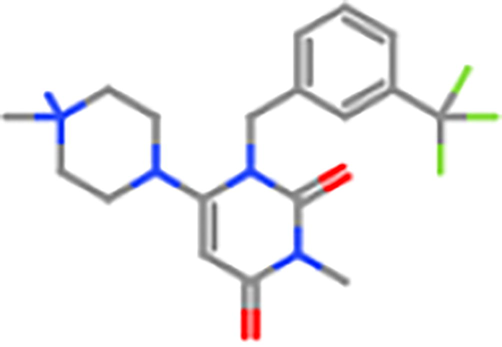
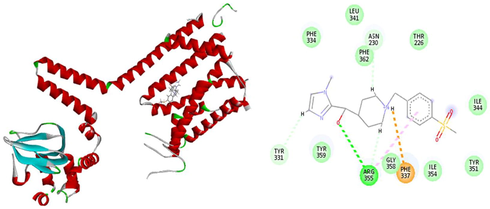
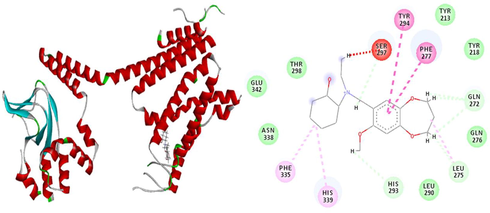
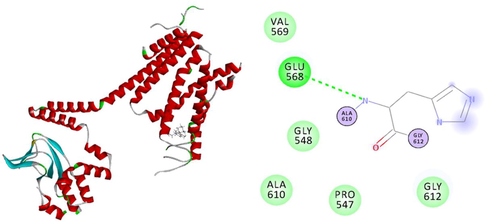
The results of patchdock having list of potential complexes were sorted by shape complementarity criteria. Top results of patchdock were interpreted in discovery studio to check their bumps and 2D structures as shown in Figs. 13–17. Bumps are un-favorable collusions between proteins and the ligands and those having minimum no of bumps are considered as the best.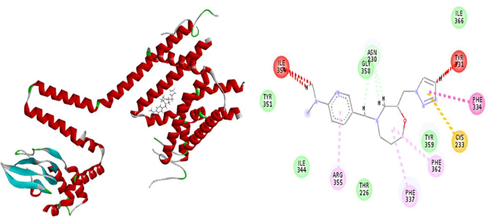
a) D Receptor-Ligand Interaction b) 2D Receptor-Ligand Interaction along with bumps (3 in red dottedline).
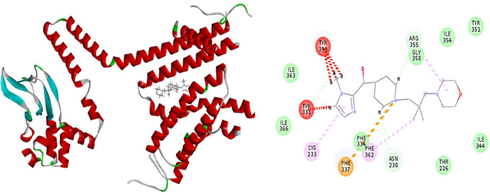
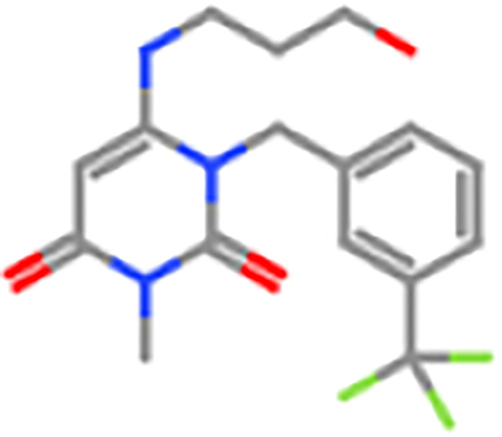
a) 3D Receptor-Ligand Interaction b) 2D Receptor-Ligand Interaction along with bumps (4 in red dotted line).
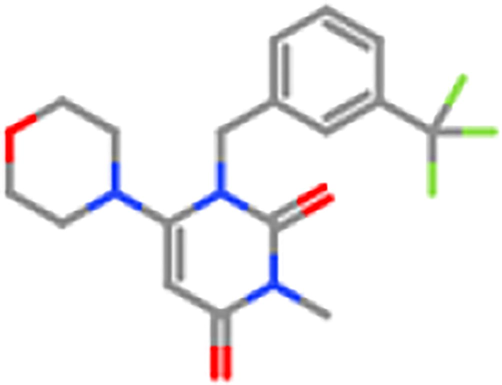
a) 3D Receptor-Ligand Interaction b) 2D Receptor-Ligand Interaction having no bump.
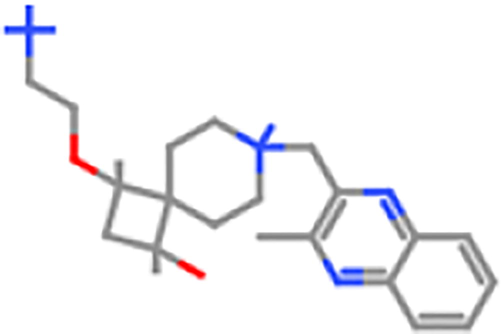
a) 3D Receptor-Ligand Interaction b) 2D Receptor-Ligand Interaction along with bump (1 in red dotted line).
a) 3D Receptor-Ligand Interaction b) 2D Receptor-Ligand Interaction having no bump.
4 Discussion
Achromatopsia results from changes in one of these genes i.e: CNGA3, CNGB3, GNAT2, PDE6C, or PDE6H (Chen et al., 2015). The CNG channel gene (CNGA3, CNGB3) mutations are considered to be the majority of reported cases of ACHM. The CNG channels negatively affect the cones on the outer segment membrane (Johnson, 2004). These, CNG channels are heterotetramers that are composed of homologous alpha and beta subunits (CNGA3 and CNGB3 in cones). Mutations in the genes CNGA3 and CNGB3 which encodes the alpha and beta subunits of cone photoreceptor, CNG channels have been described as main reason to cause ACHM. The medical diagnosis of ACHM is based on the electrophysiological, psychophysical (visual acuity, visual field, and color vision), and morphological examinations and medical history of a patient. Achromats see only with their rods, the clinical findings arise certainly from missing cone and intact rod functions (Johnson, 2004). The gene therapies already in used to treat mutated genes of ACHM are not effective enough.
So far there is no effective medication available for Achromatopsia which can target the disease at genomic level. To develop a single efficient, cost effective drug and make it available to the market, approximately 15 years are required for tests and trials with huge amount of budget. By considering all the circumstances and for rapid development of medication, repositioning/repurposing is one of the advanced approach being used. The goal of this study is to induce conceivable repositioning. This technique is not based on structural resemblances but it depends on the behavioral relationship characterized by drug target relationships.
Modularity based clustering technique determine the potential of drug’s interactions for treatments. The results of modularity being a good predictor of properties and functionality. Moreover, modularity is directly associated to the dissemination and density of links, which represent drug interactions in this research. In this study, methodology based on drug-drug interaction network analysis, have identified and ranked candidate novel drugs against CNGB3. Identified characteristics i.e. Modularity, Avg Degree, Avg Weighted Degree, Network Diameter, Density, Avg path length suggest that these characteristics are paramount in defining, interpreting and finding novel treatment for ACHM. The efficacy of clustering drug compounds according to specific pharmacological properties is confirmed for 31 drugs, by cross-checking with other drug databases and extensive literature survey. The validations carried out shows that the ranked list of drugs produced by our method is enriched for CNGB3.
Number of network based interactions have been established (Jahchan et al., 2013) and these techniques are being used to differentiate drug candidates that are more appropriate for repurposing/repositioning. The predictions made for a strongly interacted drugs revealed that this approach can successfully diagnose new indications and more convincing drugs to treat CNGB3 mutations. The predicted 6 strongly interacted drug compounds can be also examined with in vivo and in vitro methods, to confirm the conceivable repositioning or new interactions.
5 Conclusion
This research work predicts the novel drugs for achromatopsia and representing bio-medical drug-drug interaction networks using clustering and repositioning methodology. Thisstudy is an attempt towards repositioning the effective drugs for achromatopsia. Methodology focused on the achromatopsia highly mutated gene i-e CNGB3. Drugs were repositioned on the bases of their on the behavioral relationship and interactions characterized by drug target relationships. Research engine (ZINC Database) was used to retrieve the drug compounds of CNGB3 and different desktop applications were applied on retrieved drug compounds to make their clusters. 8 clusters were made from 2475 drug compounds and for each cluster separate DDI was generated and strong DDI was developed from the 8 DDI’s based on their modularity values. The toxicity value helps to reduce the venomous effects of the drugs, by discarding them and selecting those drugs whose toxicity ranges in a safest zone. Only 5 drugs were suggested to be effective for achromatopsia based on their strong DDI and minimal toxic values. Repositioning methodology is a newly innovated technique and is rapidly evolving in the research due to its evoking additional knowledge as well as it takes shorter time for its development with minimal toxic effects. A newly developed drug takes a lot of time to be introduced in the market and catch a lot of budget. While repositioning technique made a breakthrough in the world of medicine by minimizing budget as well as time.
Acknowledgements
Authors extend their appreciation to Researchers Supporting Project (RSP-2019/108) King Saud University Riyadh Saudi Arabia for financial support. We are also grateful to Department of Bioinformatics and Bioinformatics research club, Government Post Graduate College Mandian for facilitation to conduct research work.
References
- Selective loss of cone function in mice lacking the cyclic nucleotide-gated channel CNG3. Proceed. Natl. Acad. Sci.. 1999;96(13):7553-7557.
- [Google Scholar]
- Gephi: an open source software for exploring and manipulating networks. Icwsm. 2009;8(2009):361-362.
- [Google Scholar]
- The conduct of in vitro and in vivo drug-drug interaction studies: a Pharmaceutical Research and Manufacturers of America (PhRMA) perspective. Drug Metabol. Dispos.. 2003;31(7):815-832.
- [Google Scholar]
- Achromatopsia caused by novel missense mutations in the CNGA3 gene. Int. J. Ophthalmol.. 2015;8(5):910.
- [Google Scholar]
- Achromatopsia mutations target sequential steps of ATF6 activation. Proceed. Natl. Acad. Sci.. 2017;114(2):400-405.
- [CrossRef] [Google Scholar]
- Dastmalchi, S., Hamzeh-Mivehroud, M., Sokouti, B., 2016. Methods and algorithms for molecular docking-based drug design and discovery. Hershey, PA, USA: Medical Information Science Reference, an imprint of IGI Global.
- ProTox: a web server for the in silico prediction of rodent oral toxicity. Nucl. Acids Res.. 2014;42(W1):W53-W58.
- [Google Scholar]
- Old friends in new guise: repositioning of known drugs with structural bioinformatics. Brief. Bioinform.. 2011;12(4):312-326.
- [CrossRef] [Google Scholar]
- A drug repositioning approach identifies tricyclic antidepressants as inhibitors of small cell lung cancer and other neuroendocrine tumors. Cancer Discovery. 2013;3(12):1364-1377.
- [CrossRef] [Google Scholar]
- Achromatopsia caused by novel mutations in both CNGA3 and CNGB3. J. Med. Genet. 2004:41.
- [Google Scholar]
- Review on determining number of Cluster in K-Means Clustering. Int. J. Adv. Res. Comp. Sci. Manag. Stud.. 2013;1(6):90-95.
- [Google Scholar]
- Kohl, S., Jägle, H., 1993. MSc, PhD, and Ditta Zobor, MD, PhD, Dhabil, FEBO 3.
- CNGB3-achromatopsia clinical trial With CNTF: diminished rod pathway responses with no evidence of improvement in cone function. Investigat. Ophthalmol. Visu. Sci.. 2015;56(3) 1505 1505
- [CrossRef] [Google Scholar]
- Impaired opsin targeting and cone photoreceptor migration in the retina of mice lacking the cyclic nucleotide-gated channel CNGA3. Investigat. Opthalmol. Visual Sci.. 2005;46(4):1516.
- [CrossRef] [Google Scholar]
- Genersatztherapie bei genetisch bedingter Zapfenblindheit. Klinische Monatsblätter für Augenheilkunde. 2014;231(03):232-240.
- [CrossRef] [Google Scholar]
- Recent advances in drug repositioning for the discovery of new anticancer drugs. Int. J. Biol. Sci.. 2014;10(7):654-663.
- [CrossRef] [Google Scholar]
- Toxicity–Up, A.O., 2001. OECD Guidelines for testing of Chemicals.
- Clustering drug-drug interaction networks with energy model layouts: community analysis and drug repurposing. Scient. Rep.. 2016;6(1)
- [CrossRef] [Google Scholar]
- CNGB3-Achromatopsia Clinical Trial With CNTF: diminished rod pathway responses with no evidence of improvement in cone function CNGB3-achromatopsia clinical trial With CNTF. Investig. Ophthalmol. Visual Sci.. 2014;55(10):6301-6308.
- [Google Scholar]
- The clinical phenotype of CNGA3-related achromatopsia: pretreatment characterization in preparation of a gene replacement therapy trial. Invest. Ophthalmol. Visual Sci.. 2017;58(2):821-832.
- [Google Scholar]


