

Translate this page into:
Relationship between single nucleotide polymorphism studies in ghrelin gene with obesity subjects
-
Received: ,
Accepted: ,
This article was originally published by Elsevier and was migrated to Scientific Scholar after the change of Publisher.
Peer review under responsibility of King Saud University.
Abstract
Background
Obesity is one of the hereditary metabolic conditions that have been recognized in humans which is associated with visceral fat. Ghrelin (GHRL) is mainly linked to obesity as lipid metabolism. The rs626917, rs34911341 and rs20755356 single nucleotide polymorphisms (SNP) were extensively investigated in multiple human diseases including obesity. There are no studies were studied in the Saudi population with GHRL gene and obesity and the current study was aimed to investigate the genetic association between rs626917, rs34911341 and rs20755356 SNPs in GHRL gene in obesity population.
Methodology
Ninety patients with obesity and ninety healthy individuals served as controls in this case-control study. Genomic DNA was extracted from the collected EDTA blood and genotyping was performed with qPCR analysis using VIC and FAM probes. Clinical and biochemical data was collected from 180 subjects and statistical analysis was performed using SPSS software (25th Version, USA).
Results
Age, weight, BMI, WC, SBP, DBP, HDLC, and TG levels all showed statistical significance with obesity (p < 0.05) when compared with controls. Genotype analysis in rs696217 SNP confirmed no association in allele, genotypes or any other forms of genetic models. A positive association was observed in both rs34911341 and rs2075356 SNPs (p < 0.05). The Anova analysis confirmed the significant association with weight, BMI and SBP in rs696217 SNP, weight and BMI in rs34911341 SNP and SBP in rs2075356 SNP in GHRL gene (p = 0.01).
Conclusion
This study confirms the significant association with rs34911341 and rs20755356 SNPs was associated with obesity in the Saudi population.
Keywords
Ghrelin (GHRL) gene
Obesity
rs696217
rs34911341
rs20755356

1 Introduction
Obesity, the accumulation of extra fat in the human body, has become a widespread disease for the development of future human diseases. Obesity is a symptom of having too much fat on your body, which has been related to a decreased life expectancy and more serious health conditions (Alshammary and Khan, 2021). The future complications of obesity are mainly connected with cardiovascular diseases (CVD), diabetes and cancers (Al-Nbaheen, 2020). According to WHO, the global obesity prevalence has triplicated, with an estimated 1.9 billion people overweight or obese (Alharbi et al., 2021). Specifically, in the Gulf states, the incidence of overweight is between 25 and 50 %, and obesity is 13–50 % (Aljefree et al., 2022). Overweight and obese people are more common in Kingdom of Saudi Arabia (KSA) which results obesity to a leading cause of death, accounting for 8–18 %. In response to the tremendous health and social repercussions of the obesity epidemic, the KSA government is executing a broad variety of programs under its Vision 2030 plan for a healthy population. Obesity treatment methods have evolved in KSA, such as the early use of day case bariatric surgeries (Salem et al., 2022). Environmental and genetic factors will have a significant impact on chronic and metabolic disorders (Khan, 2021), mainly obesity. Around 200 genetic variations in humans have been found by genome wide association studies (GWAS) obesity in mixed population based on monogenic, syndromic and polygenic classifications of obesity and variants can be explained only in 3 % as heritability, which is associated with body mass index (BMI) (Younes et al., 2021). Obesity has common genetic effects, indicating a common genetic contribution. Several metabolic diseases are frequently connected with mutations in specific genes, which explains aberrant expressions, and some single nucleotide polymorphisms (SNPs) also play an important role in human obese population (Rahati et al., 2022). Ghrelin (GHRL) gene was discovered to be one of them, and it has been linked to obesity as a chronic disease in humans. Involvement of the ghrelin gene in food intake, energy homeostasis, and lipid metabolism has been well-documented for obesity disease. When we eat food, we release a hormone called ghrelin that has a physiological purpose in initiating a meal. GHRL levels rise during periods of fasting and decrease after we eat. Due to its role in energy balance and weight regulation, ghrelin deficiency could play a role in human obesity (Martin et al., 2008). The human GHRL gene is located on chromosome 3p25-26 and has five exons and four introns. The GHRL coding and noncoding areas contain at least 300 SNPs, four of which have been linked to pathogenicity. GHRL expression can be affected by high-fat diet, somatostatin, and parasympathetic stimulation. Several phenotypes and human diseases have been associated with elevated serum levels of ghrelin and its variants. Body weight and fat mass in mice have been discovered to be inversely related to serum ghrelin concentration; GHRL has been reported to play a role in the pathophysiology of obesity in humans. Some of these gene polymorphisms are well-known (Monteleone et al., 2007; Kalli et al., 2021). Limited genetic studies with specific SNPs have been conducted in the KSA population, and no investigations using GHRL gene have been reported. Based on prior SNPs (rs696217, rs3491341, and rs2075356) explored in the global obesity population, this study was designed to investigate the three SNPs in GHRL gene. The purpose of this study is to explore at the function of three SNPs in the GHRL gene in obese subjects from capital city of KSA.
2 Materials and methods
2.1 Obesity population
This case-control study consists of 180 Saudi population which was categorized as 90 obesity cases and 90 non-obesity subjects (controls). All 180 participants were considered as 91 males and 89 females. Finally, obesity cases consist of 48 females and 42 males and controls involve 43 males and 47 females. All subjects were collected during the routine visit to the patient clinic of King Khalid University Hospital. The obesity cases were recruited under the age of 31–76 years and controls were selected between 40 and 60 years of age.
2.2 Selection criteria
Based on simple criteria(s) 180 subjects were recruited. The initial criteria were to sign the patient consent form and to draw the blood samples to enroll in this study. The inclusion criteria of obesity case recruitment for this study were based on BMI levels and Saudi nationality. The patient with low BMI levels with non-Saudi nationality were excluded from this study. Patient with <30 kg/m2 is confirmed as inclusion criteria for control of this study and exclusion is as per elevated BMI levels. The categorization of BMI was described in the prior study (Al-Nbaheen, 2020).
2.3 Ethical details
The Institutional Review Board of the College of Medicine at King Saud University granted authority for this research to proceed. Each patient has given their authorization to obtain a sample by signing our informed consent form. In accordance with the Declaration of Helsinki, this study was carried out.
2.4 Anthropometric data and biochemical analysis
In this study, age and waist circumference was recorded. BMI was calculated based on weight and height. Details concerning hypertension, such as systolic and diastolic blood pressure (SBP and DBP), were also assessed. Three milliliters of coagulant blood were utilized for biochemical testing of lipid profiles such as total cholesterol (TC), triglycerides (TG), HDLC (High Density Lipoprotein cholesterol), and LDLC (Low Density Lipoprotein cholesterol) (Low Density Lipoprotein cholesterol) (Alharbi et al., 2015).
2.5 DNA amplification
DNA was isolated using DNA extraction kit for 180 subjects using peripheral blood which was collected in an EDTA tubes. NanoDrop spectrophotometer was used to measure the quality of DNA. All DNA samples were finalized for 20 ng/µL and 180 samples were genotyped by allelic discrimination test using Taqman analysis (TaqMan Probes and TaqMan master mix) using 7500 Real-Time Polymerase Chain Reaction detection system. In this study, 3 SNPs (rs696217, rs34911341 and rs2075356) were genotyped with 90 obesity cases and 90 controls using VIC and FAM probes. Table 1 provides the primer sequences and probes details for three SNPs used in this study. PCR conditions for genotyping analysis was finalized for 40 cycles, 95⁰C-10mins, 95⁰C-15 s and 60⁰C for 60 s. During the amplification process, the DNA polymerase will engage with the wild-type probe and knock off its fluorescent dye, freeing it from the quencher and allowing a signal to be created and recorded. However, if the mutant sequence is present, the mutant probe will attach and create its specific fluorescence signal (Flanagan et al., 2021). The complete assay was followed as per the documented study (Alharbi et al., 2021). Obesity cases were repeated twice to reconfirm the analysis.
S. No
rs number
SNPs
Amino acid substitution
Primers
Probes
1
rs696217
C408A
Leu-Met
F: GGACCCTGTTCACTGCCAC
R: GAGCCCTGAACACCAGAGAGF: VIC
R: FAM
2
rs34911341
G346A
Arg-Gln
F: GCTGGGCTCCTACCTGAGC
R: GGACATGGGGGCTTAGAGTF: VIC
R: FAM
3
rs2075356
T3056C
–
F: CACCTTCCCACTCACCATCT
R: GCCATTGGTGACTCAACCTTF: VIC
R: FAM
2.6 Statistics
In this study, the complete statistics was calculated using SPSS software (version 25.0). Qualitative data represents the number and percentages whereas Quantitative data indicates median for non-parametric data and mean ± SD for parametric data. Both Qualitative and Quantitative data were used in this study. Table 2 was used to compare the anthropometric and biochemical values using t-tests between cases vs controls. Table 3 was used to measure the control groups, which were analyzed using a Chi-square test in Hardy Weinberg Equilibrium (HWE). Table 4 displays the odds ratio (OR), 95 % confidence intervals (CI), and P values for the association between alleles and genotypes. Table 5 shows the results of an Anova test applied to the anthropometric and lipid profile data based on the various SNPs of genotypes (Khan et al., 2019). Linkage disequilibrium coefficient analysis was conducted using Haploview (version 4.2) on three SNPs in Ghrelin gene (Fig. 1) (Saif and Khan, 2022). P value <0.05 is regarded statistically significant (p < 0.05).
Characteristics
Controls (n = 90)
Obesity (n = 90)
P value
Age (Years)
45.21 ± 7.87
49.54 ± 10.46
0.001
Gender (M: F)
47.8 %: 52.2 %
53.3 %: 46.7 %
0.76
Weight (Kgs)
72.41 ± 10.45
108.97 ± 14.49
<0.0001
Height (cms)
157.16 ± 5.34
157.28 ± 5.33
0.15
BMI (Kg/m2)
29.31 ± 4.57
44.22 ± 6.71
<0.0001
WC (cms)
81.46 ± 5.89
93.27 ± 9.44
<0.0001
SBP (mmHg)
132.76 ± 6.32
140.65 ± 8.32
0.001
DBP (mmHg)
80.75 ± 1.47
88.65 ± 3.13
<0.0001
HDLC (mmol/L)
0.78 ± 0.21
1.21 ± 0.30
0.002
LDLC (mmol/L)
2.88 ± 0.69
3.08 ± 0.73
0.59
TC (mmol/L)
4.18 ± 1.03
4.34 ± 1.05
0.30
TG (mmol/L)
1.56 ± 1.65
3.46 ± 1.89
<0.0001
SNPs
Minor Allele
MAF
χ2
HW P-value
rs696217
T
0.03
8.66
0.003
rs34911341
T
0.08
4.57
0.032
rs2075356
C
0.23
17.50
0.00002
Genotypes
Cases (n = 90)
Controls (n = 90)
Odds Ratios
95 %CI
P values
rs696217
GG
79 (87.8 %)
85 (94.5 %)
–
–
–
GT
10 (11.1 %)
04 (4.4 %)
2.69
0.81–8.92
0.09
TT
01 (1.1 %)
01 (1.1 %)
1.07
0.06–17.49
0.95
GT + TT vs GG
11 (12.2 %)
05 (5.5 %)
2.36
0.78–7.11
0.11
GT vs GG + TT
10 (11.1 %)
04 (4.4 %)
2.68
0.81–8.91
0.09
TT vs GT + GG
01 (1.1 %)
01 (1.1 %)
1.00
0.06–16.24
0.99
G allele
168 (0.93)
174 (0.97)
–
–
–
T allele
12 (0.07)
06 (0.03)
2.07
0.76–5.64
0.14
rs34911341
CC
55 (61.1 %)
78 (86.7 %)
–
–
–
CT
31 (34.5 %)
10 (11.1 %)
4.39
1.99–9.71
0.0001
TT
04 (4.4 %)
02 (2.2 %)
2.83
0.50–16.03
0.22
CT + TT vs CC
35 (38.9 %)
12 (13.3 %)
4.13
1.97–8.67
0.0004
CT vs TT + CC
31 (34.5 %)
10 (11.1 %)
4.20
1.91–9.24
0.0001
TT vs CC + CT
04 (4.4 %)
02 (2.2 %)
2.04
0.36–11.46
0.40
C allele
141 (0.78)
166 (0.92)
–
–
–
T allele
39 (0.22)
14 (0.18)
3.28
1.71–6.28
0.0002
rs2075356
–
–
–
TT
41 (45.6 %)
60 (66.7 %)
TC
28 (31.1 %)
18 (20 %)
2.27
1.11–4.64
0.02
CC
21 (23.3 %)
12 (13.3 %)
2.56
1.13–5.77
0.02
TC + CC vs TT
49 (54.4 %)
30 (33.3 %)
2.39
1.31–4.37
0.004
TC vs TT + CC
28 (31.1 %)
18 (20 %)
1.80
0.91–3.57
0.08
CC vs TT + TC
21 (23.3 %)
12 (13.3 %)
1.97
0.90–4.31
0.08
T allele
110 (0.61)
138 (0.77)
–
–
–
C allele
70 (0.39)
42 (0.23)
2.09
1.32–3.31
0.001
rs696217
GG (n = 79)
GT (n = 10)
TT (n = 01)
P value
Age (Years)
50.15 ± 10.54
44.20 ± 8.91
55.00 ± 1.00
0.20
Weight (cms)
106.86 ± 13.96
122.60 ± 5.89
140.00 ± 1.00
0.003
BMI (Kg/m2)
43.09 ± 6.23
51.45 ± 2.89
60.60 ± 1.00
0.0001
WC (cms)
93.17 ± 9.72
94.8 ± 7.33
86.00 ± 1.00
0.65
SBP (mmHg)
139.49 ± 7.49
149.7 ± 9.71
142.00 ± 1.00
0.008
DBP (mmHg)
88.43 ± 3.12
90.3 ± 2.91
90.00 ± 1.00
0.18
HDLC (mmol/L)
1.21 ± 0.29
1.14 ± 0.26
1.70 ± 1.00
0.17
LDLC (mmol/L)
3.13 ± 0.72
2.70 ± 0.62
3.60 ± 1.00
0.15
TC (mmol/L)
4.34 ± 1.03
4.15 ± 1.03
6.30 ± 1.00
0.14
TG (mmol/L)
3.46 ± 1.86
3.20 ± 2.15
5.43 ± 1.00
0.53
rs34911341
CC (n = 55)
CT (n = 31)
TT (n = 04)
P value
Age (Years)
49.70 ± 10.42
49.77 ± 10.90
45.50 ± 8.81
0.73
Weight (cms)
105.92 ± 14.24
111.93 ± 13.15
128.00 ± 10.42
0.003
BMI (Kg/m2)
42.62 ± 6.23
45.57 ± 6.17
55.72 ± 3.30
0.0001
WC (cms)
94.18 ± 9.45
92.25 ± 9.66
88.75 ± 6.81
0.41
SBP (mmHg)
139.50 ± 7.46
141.58 ± 9.13
149.25 ± 9.10
0.055
DBP (mmHg)
88.52 ± 2.94
88.90 ± 3.59
88.50 ± 1.91
0.86
HDLC (mmol/L)
1.25 ± 0.30
1.15 ± 0.28
1.20 ± 0.33
0.32
LDLC (mmol/L)
3.11 ± 0.82
3.01 ± 0.56
3.27 ± 0.25
0.72
TC (mmol/L)
4.33 ± 1.10
4.23 ± 0.94
4.65 ± 1.13
0.73
TG (mmol/L)
3.39 ± 1.98
3.58 ± 1.78
3.45 ± 1.76
0.90
rs2075356
TT (n = 41)
TC (n = 28)
CC (n = 21)
P value
Age (Years)
50.65 ± 11.74
47.21 ± 8.93
50.47 ± 9.60
0.36
Weight (cms)
110.12 ± 13.72
105.28 ± 13.65
111.66 ± 16.63
0.24
BMI (Kg/m2)
44.01 ± 6.18
42.83 ± 6.42
46.48 ± 7.72
0.16
WC (cms)
93.97 ± 9.70
93.6 ± 9.18
91.47 ± 9.47
0.60
SBP (mmHg)
140.36 ± 7.70
138.32 ± 8.06
144.33 ± 8.89
0.03
DBP (mmHg)
88.87 ± 2.96
87.85 ± 3.08
89.28 ± 3.42
0.23
HDLC (mmol/L)
1.29 ± 0.30
1.13 ± 0.27
1.16 ± 0.28
0.054
LDLC (mmol/L)
3.04 ± 0.69
3.06 ± 0.88
3.21 ± 0.56
0.66
TC (mmol/L)
4.41 ± 1.02
4.30 ± 1.10
4.28 ± 1.05
0.86
TG (mmol/L)
3.35 ± 2.07
3.24 ± 1.75
3.98 ± 1.66
0.35
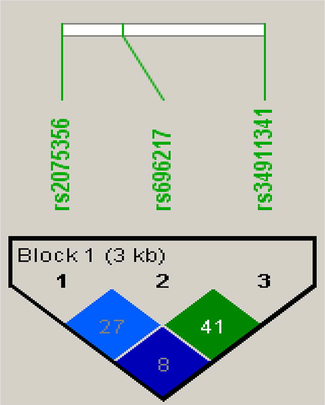
Analysis of linkage disequilibrium in 3 SNPs present in GHRL gene.
3 Results
3.1 Characteristics of obesity and control subjects
A total of 180 participants (90 cases of obesity and 90 controls) were included in the study; their baseline demographic and clinical features are shown in Table 1. This study determined that the average age of those who are obese is 49.54 ± 10.46 and controls were documented with 45.21 ± 7.87. The prevalence of male subjects in obesity cases and controls was confirmed with 53.3 % and 47.8 %, whereas in females, 46.7 % and 52.2 % was confirmed in obesity cases and controls. In this study, weight (108.97 ± 14.49 vs 72.41 ± 10.45), BMI (44.22 ± 6.71 vs 29.31 ± 4.57) and WC (93.27 ± 9.44 vs 81.46 ± 5.89) was found to be very high in obesity cases when compared with controls. Both SBP (140.65 ± 8.32 vs132.76 ± 6.32) and DBP (88.65 ± 3.13 vs 80.75 ± 1.47) levels were found to be high in obesity cases. Lipid profile analysis confirms the elevated levels in obesity when compares with control subjects. The overall analysis from Table 2 confirms as age, weight, BMI, WC, SBP, DBP, HDLC and TG were significantly associated and found elevated levels in obesity cases in comparison with controls (P < 0.05). However, gender, height, LDLC and TC were not associated (P greater than 0.05).
3.2 HWE analysis
The HWE analysis confirmed the significant association with 3SNPs involved in this study. The MAF of rs696217 SNP showed 0.03 (χ2 = 8.66 and P = 0.003). In rs34911341 SNP showed 0.08 as MAF with χ2 = 4.57 and P = 0.03 and in rs2075356 SNP, 0.23 was the MAF with χ2 = 17.50 and P = 0.00002. The details have been shown in Table 3.
3.3 Genetic association with 3 SNPs in ghrelin gene
A total of 3 SNPs (rs696217, rs34911341 and rs2075356) were genotyped successfully in obesity cases and controls. The call success rate of three loci was greater than 90 %. The detailed information about genotypes, alleles and genetic models such as dominant, recessive and co-dominant models for three SNPs were shown in Table 3. In rs696217 SNP, genotype frequencies for GG and GT was 87.8 % and 11.1 % in obesity cases and 94.5 %, and 4.4 % in controls and in TT both groups have received 1.1 %. There is no statistical significance difference between allele, genotypes or any of the genetic models. The rs34911341 SNP was strongly associated with allelic form (T vs C: OR-3.28, 95 %CI:1.71–6.28; p = 0.0002), heterozygous genotype (CT vs CC; OR-4.39, 95 %CI:1.99–9.71; p = 0.0001) and a couple of genetic models (CT + TT vs CC: OR-4.13, 95 %CI:1.97–8.67; p = 0.0004 and CT vs CC + TT: OR-4.20, 95 %CI: 1.91–9.24; p-0.0001). In obesity cases, CT and TT genotypes was observed to be 34.5 % and 4.4 %. In controls, 11.1 % and 2.2 % of CT and TT genotypes were observed. Among control genotypes, 86.7 % and 61.1 % of CC genotypes were observed in obesity cases and controls. The T allele frequencies was higher in obesity cases with 0.22 % than in controls with 0.18 %, whereas in controls, 0.92 % of C allele frequencies were observed when compared with obesity cases as 0.78 %. In the third SNP rs2075356, allele (C vs T: OR-2.09, 95 %CI:1.32–3.31; p = 0.001), heterozygous and variant genotypes (TC vs TT: OR-2.27, 1.11–4.64; p = 0.02 and CC vs TT: OR-2.56, 95 %CI: 1.13–5.77, p = 0.02) and dominant model (OR-2.39, 95 %CI:1.31–4.37, p = 0.004) were associated in obesity cases. Both TC and CC genotypes in obesity cases were high with 31.1 % and 23.3 %, while controls had 20 % of TC and 13.3 % CC genotypes. The TT genotypes in controls was 66.7 % and 45.6 % in obesity cases. The high frequencies of C alleles were found in obesity cases with 39 % and 23 % in controls and T allele frequencies was found to be low in obesity cases with 61 % and high in controls with 77 %.
3.4 Anova analysis with 3 SNPs in ghrelin gene
Table 5 defines the Anova analysis with three SNPs and anthropometric analysis such as age, weight, BMI, WC, SBP and DBP. Biochemical analysis includes the lipid profile such as HDLC, LDLC, TC and TG in obesity cases. The rs696217 SNP was categorized into GG, GT and TT genotypes with baseline characteristics involves the elevated of age (55.00 ± 1.00), weight (140.00 ± 1.00), BMI (60.60 ± 1.00), HDLC (1.70 ± 1.00), LDLC (3.60 ± 1.00), TC (6.30 ± 1.00) and TG (5.43 ± 1.00) levels in TT genotype and GT genotype had higher levels of WC (94.8 ± 7.33), SBP (149.7 ± 9.71) and DBP (90.3 ± 2.91). None of the abnormal levels were found in GG genotype. The Anova analysis confirmed weight (P = 0.003), BMI (P = 0.0001) and SBP (P = 0.008) were significantly associated. The CC, CT and TT genotypes in rs34911341 SNP confirmed only weight (P = 0.003) and BMI (P = 0.0001) were associated with Post-hoc analysis. WC (94.18 ± 9.45) and HDLC (1.25 ± 0.30) has high levels in CC genotypes. Age (49.77 ± 10.90), DBP (88.90 ± 3.59) and TG (3.58 ± 1.78) had elevated levels in CT genotypes and in TT genotypes, weight (128.00 ± 10.42), BMI (55.72 ± 3.30), SBP (149.29 ± 9.10), LDLC (3.27 ± 0.25) and TC (4.65 ± 1.13) levels were elevated. In rs2075356 SNP, only SBP (P = 0.03) showed the significant analysis. The elevated levels were documented only in TT and CC genotypes. Age (50.65 ± 11.74), WC (93.97 ± 9.70), HDLC (1.29 ± 0.30) and TC (4.41 ± 1.02) levels were risen in TT genotypes, while weight (111.66 ± 16.63), BMI (46.48 ± 7.72), SBP (144.33 ± 8.89), DBP (89.28 ± 3.42), LDLC (3.21 ± 0.56) and TG (3.98 ± 1.66) levels were elevated in CC genotypes.
3.5 Analysis of linkage disequilibrium
In this study, rs696217, rs34911341 and rs2075356 SNPs in GHRL gene were used for an analysis of LD plot generated delta coefficient values in obesity cases and control subjects.
4 Discussion
A total of 180 Saudi subjects were involved in this case-control study including 90 obesity cases and 90 controls. Based on the google data, this is the initial study has carried out with 3 SNPs (rs696217, rs34911341 and rs2075356) in the GHRL gene in obesity population of Saudi Arabia. The current study results confirmed the positive association with age, weight, BMI, WC, SBP, DBP, HDLC and TG (P < 0.05). Genotype analysis in rs696217 SNP confirmed no association in allele (T vs G: p = 0.14), genotype (GT vs GG: p = 0.09) and genetic models (GT + TT vs GG: p = 0.11 and GT vs GG + TT: p = 0.09). A positive association was observed in both rs34911341 (T vs C: p = 0.0002; CT vs CC; p = 0.0001; (CT + TT vs CC: p = 0.0004 and CT vs CC + TT: p-0.0001) and rs2075356 SNPs (C vs T: p = 0.001; TC vs TT: p = 0.02 and CC vs TT: p = 0.02; p = 0.004). The Anova analysis revealed the significant association between rs696217 SNP and weight, BMI, and SBP, as well as weight and BMI in rs34911341 SNP and SBP in rs2075356 SNP in the GHRL gene. Excluding the genetic factors, advanced age, biochemical and clinical factors which includes elevated BMI levels, family history of diabetes, HTN and obesity, uncontrolled diet and lack of irregular activities are associated with obesity. A recent study by Okati-Aliabad et al confirmed the prevalence of obesity has been increased in Middle East countries since 2000–2020 and study reports documented the obesity frequency in KSA has been elevated by 24.95 (95 %CI: 21.02–29.61) and overweight frequency has been grown by 31.80 (95 %CI: 29.56–34.21) (Okati-Aliabad et al., 2022). A couple of studies previously carried out in KSA has been predicted the prevalence of obesity by 2022 will be increased to 41 % in men and 78 % in women (Al-Quwaidhi et al., 2014) and overall prevalence will be 59.5 % in which 41.4 % will be men and 77.6 % will be women (Ss, m. a., 2016).
Both the stomach and the pancreas secrete a peptide called ghrelin, which regulates metabolism (Hamdy et al., 2018). Kojima identified ghrelin in 1999 as a peptide hormone generated by stomach A-like cells and other organs. The effects of GHRL, which plays an important role in energy homeostasis, are expected to impact the actions of insulin, growth hormone, and other hormones. GHRL effects are assumed to be mediated via growth hormone secretagogue receptors (GHSRs) in the brain, heart, and adipose tissue (Joatar et al., 2017). Ghrelin is known to be the bulk of the 28-amino acid peptide generated by endocrine cells in the mucosal folds of the stomach. The rat stomach had an endogenous ligand for the growth hormone secretagogue receptor (GHS-R), which was subsequently revealed to boost food intake by triggering orexigenic peptides in the hypothalamic arcuate nucleus and to promote weight gain (Chen et al., 2020). Obese people had lower levels of ghrelin in their bloodstreams than lean ones, indicating that ghrelin may have a role in weight regulation. The GHRL gene has been identified as a possible contributor to human obesity. 12 SNPs have been found in the GHRL gene, although their functional ramifications have not yet been fully understood (Llamas-Covarrubias et al., 2017). Previous studies have been carried out in obesity with the global population (Martin et al., 2008; Giudice et al., 2004; Gueorguiev et al., 2009; Ukkola et al., 2002; Bai et al., 2021; Gjesing et al., 2010; Leskelä et al., 2009; Takezawa et al., 2013; Takezawa et al., 2009; Zhu et al., 2010). The SNPs of GHRL gene is studies in various human diseases including meta-analysis studies in type 2 diabetes (Huang et al., 2018), gestational diabetes (Madkour et al., 2022), HTN (Berthold et al., 2010; Mager et al., 2006), metabolic syndrome (Mora et al., 2015), NAFLD (Tabaeian et al., 2021), eating disorder (Monteleone et al., 2007; Manfredi et al., 2021) and many other human diseases.
Interestingly, one-way Anova analysis constructed the relation between baseline characteristics and different genotypes in 3 SNPs. Unfortunately, rs696217 (P = 0.008) and rs2075356 (P = 0.03) showed the statistical association with SBP. There is a borderline association was present in SBP with the rs34911341 SNP (P = 0.055). Overall, Anova analysis concludes there is a relation between SBP levels and GHRL gene in obesity subjects. Previous studies have an association between GHRL gene and HTN (Berthold et al., 2010; Mager et al., 2006).
The main limitation of this study was to skip the collection of serum sample from which Elisa analysis was missed out. The sample size was also found to be in limited size. The control subjects for all 3 SNPs were not repeated. Furthermore, because replication studies are required, the current study findings should be interpreted with caution. Missing of family history of obesity was the final limitations of this study. The strength of this study was to perform qPCR analysis and all obesity cases were repeated twice. In this study, 3SNPs were selected to analyse with obesity subjects. This study used a single tertiary hospital with a limited sample, thus false correlations should be very low due to ethnic similarities. Furthermore, genetic linkages may not account for the condition or obesity disease. Based on sample size calculation, case-control study was conducted with 180 Saudi subjects.
In conclusion, genotyping analysis indicated that the SNPs rs34911341 and rs2075356 SNPs in GHRL gene was associated with allele, genotype, and dominant models. The Anova analysis concluded with weight, BMI, and SBP in rs696217 and weight, and BMI in rs34911341 and SBP in rs2075356 SNPs. Based on Anova analysis, a prediction can be assumed as these 3 SNPs can be act as biomarker for central and morbid obesity. To rule out this analysis, global studies should be replicated mainly with these 3 SNPs in obese and morbid obese subjects. This study can be used as a small platform to further analyse the genetic factors associated with obesity and future comorbidities can be affected with a significant impact on uncontrolled weight gain in obesity subjects.
Declaration of Competing Interest
The author declare that they have no known competing financial interests or personal relationships that could have appeared to influence the work reported in this paper.
References
- Apolipoprotein C3 gene variants and risk of developing type 2 diabetes in Saudi subjects. Metab. Syndr. Related Disorders. 2015;13:298-303.
- [Google Scholar]
- Relationship between serum amyloid A1 (SAA1) gene polymorphisms studies with obesity in the Saudi population. Diabetes, Metab. Syndr. Obesity: Targets Therapy. 2021;14:895.
- [Google Scholar]
- Amino-acid amendment of arginine-325-tryptophan in rs13266634 genetic polymorphism studies of the SLC30A8 gene with type 2 diabetes-mellitus patients featuring a positive family history in the Saudi population. J. King Saud Univ.-Sci.. 2021;33(1):101258.
- [Google Scholar]
- Impact of the intake of snacks and lifestyle behaviors on obesity among university students living in Jeddah. Healthcare. 2022;10(2):400.
- [Google Scholar]
- Impact of weight loss predictors in severe-morbid obesity patients in the Saudi population. Saudi J. Biol. Sci.. 2020;27:2509-2513.
- [Google Scholar]
- Trends and future projections of the prevalence of adult obesity in Saudi Arabia, 1992–2022. Eastern Mediterranean Health J.. 2014;20
- [Google Scholar]
- Screening of obese offspring of first-cousin consanguineous subjects for the angiotensin-converting enzyme gene with a 287-bp Alu sequence. J. Obesity Metab. Syndr.. 2021;30:63.
- [Google Scholar]
- Distribution and effect of ghrelin genotype on plasma lipid and apolipoprotein profiles in obese and nonobese Chinese subjects. Hormones. 2021;20:527-535.
- [Google Scholar]
- Influence of ghrelin gene polymorphisms on hypertension and atherosclerotic disease. Hypertens. Res.. 2010;33:155-160.
- [Google Scholar]
- Ghrelin gene single nucleotide polymorphisms and their effects on Nile tilapia (Oreochromis niloticus) growth. Aquacult. Rep.. 2020;18:100469
- [Google Scholar]
- Development of a real-time PCR assay to detect the single nucleotide polymorphism causing Warmblood Fragile Foal Syndrome. PLoS ONE. 2021;16:e0259316.
- [Google Scholar]
- Molecular screening of the ghrelin gene in Italian obese children: the Leu72Met variant is associated with an earlier onset of obesity. Int. J. Obesity. 2004;28:447-450.
- [Google Scholar]
- Family and population-based studies of variation within the ghrelin receptor locus in relation to measures of obesity. PLoS ONE. 2010;5:e10084.
- [Google Scholar]
- Association studies on ghrelin and ghrelin receptor gene polymorphisms with obesity. Obesity. 2009;17(4):745-754.
- [Google Scholar]
- Ghrelin gene polymorphism as a genetic biomarker for prediction of therapy induced clearance in Egyptian chronic HCV patients. Gene. 2018;649:74-79.
- [Google Scholar]
- Ethnicity-specific association between ghrelin Leu72Met polymorphism and type 2 diabetes mellitus susceptibility: An updated meta-analysis. Front. Genet.. 2018;9:541.
- [Google Scholar]
- Leu72Met and other intronic polymorphisms in the GHRL and GHSR genes are not associated with Type 2 diabetes mellitus, insulin resistance, or serum ghrelin levels in a saudi population. Endocr. Metabol.. 2017;32:360-369.
- [Google Scholar]
- Ghrelin gene polymorphisms in irritable bowel syndrome. Digestion. 2021;102:313-318.
- [Google Scholar]
- Do second generation sequencing techniques identify documented genetic markers for neonatal diabetes mellitus? Heliyon. 2021;7:e07903.
- [Google Scholar]
- Genetic confirmation of T2DM meta-analysis variants studied in gestational diabetes mellitus in an Indian population. Diab. Metabol. Syndr.: Clin. Res. Rev.. 2019;13:688-694.
- [Google Scholar]
- Fasting plasma total ghrelin concentrations in monozygotic twins discordant for obesity. Metabolism. 2009;58:174-179.
- [Google Scholar]
- Association of A-604G ghrelin gene polymorphism and serum ghrelin levels with the risk of obesity in a mexican population. Mol. Biol. Rep.. 2017;44:289-293.
- [Google Scholar]
- Impact of gene polymorphism of glutathione S-transferase and ghrelin as a risk factor in Egyptian women with gestational diabetes mellitus. Egypt. J. Med. Hum. Genet.. 2022;23:1-8.
- [Google Scholar]
- Association between ghrelin gene variations and blood pressure in subjects with impaired glucose tolerance. Am. J. Hypertens.. 2006;19:920-926.
- [Google Scholar]
- A systematic review of genetic polymorphisms associated with binge eating disorder. Nutrients. 2021;13:848.
- [Google Scholar]
- Lack of association of ghrelin precursor gene variants and percentage body fat or serum lipid profiles. Obesity. 2008;16:908-912.
- [Google Scholar]
- The Leu72Met polymorphism of the ghrelin gene is significantly associated with binge eating disorder. Psychiatr. Genet.. 2007;17:13-16.
- [Google Scholar]
- Ghrelin gene variants influence on metabolic syndrome components in aged Spanish population. PLoS ONE. 2015;10:e0136931.
- [Google Scholar]
- Prevalence of obesity and overweight among adults in the middle east countries from 2000 to 2020: A systematic review and meta-analysis. J. Obesity. 2022;2022:1-18.
- [Google Scholar]
- Association between CLOCK 3111 T/C polymorphism with ghrelin, GLP-1, food timing, sleep and chronotype in overweight and obese Iranian adults. BMC Endocr. Disorders. 2022;22:1-12.
- [Google Scholar]
- Association of genetic variants of the vitamin D receptor gene with vitiligo in a tertiary care center in a Saudi population: a case-control study. Ann. Saudi Med.. 2022;42(2):96-106.
- [Google Scholar]
- Prevalence, risk factors, and interventions for obesity in Saudi Arabia: A systematic review. Obes. Rev.. 2022;23(7)
- [Google Scholar]
- A review of prevalence of obesity in Saudi Arabia. J. Obes. Eat. Disord.. 2016;2:1-6.
- [Google Scholar]
- The Leu72Met (rs696217 G> T) polymorphism of the ghrelin gene might be a protective factor for nonalcoholic fatty liver disease. J. Gastrointest. Liver Dis.. 2021;30
- [Google Scholar]
- Preproghrelin gene polymorphisms in obese Japanese: association with diabetes mellitus in men and with metabolic syndrome parameters in women. Obesity Res. Clin. Pract.. 2009;3:179-191.
- [Google Scholar]
- Preproghrelin gene polymorphisms in obese Japanese women. Minor homozygotes are light eaters, do not prefer protein or fat, and apparently have a poor appetite. Appetite. 2013;63:105-111.
- [Google Scholar]
- Role of ghrelin polymorphisms in obesity based on three different studies. Obes. Res.. 2002;10:782-791.
- [Google Scholar]
- Genetic polymorphisms associated with obesity in the Arab world: a systematic review. Int. J. Obesity. 2021;45:1899-1913.
- [Google Scholar]
- Plasma ghrelin levels and polymorphisms of ghrelin gene in Chinese obese children and adolescents. Ir. J. Med. Sci.. 2010;179:345-349.
- [Google Scholar]


