

Translate this page into:
Reinterpreting aeromagnetic data of the Agadir Melloul region (Morocco) for delineating structural lineaments: A new look
⁎Corresponding authors. luanpt@hus.edu.vn (Luan Thanh Pham), ahmed.eldosouky@sci.suezuni.edu.eg (Ahmed M. Eldosouky), m.abioui@uiz.ac.ma (Mohamed Abioui)
-
Received: ,
Accepted: ,
This article was originally published by Elsevier and was migrated to Scientific Scholar after the change of Publisher.
Peer review under responsibility of King Saud University.
Abstract
Aeromagnetic data of the Agadir Melloul region (Morocco) has been previously interpreted to delineate structural lineaments using the tilt angle method. In this study, we show the limitations of the tilt angle method in extracting the boundaries of magnetic sources and reinterpret aeromagnetic data of the Agadir Melloul region using the improved logistic method. Initially, the tilt angle and improved logistic methods are tested on 3D synthetic magnetic models where the results obtained from the improved logistic method show improvements in the delineation of the actual edges of sources compared to the tilt angle method. Then, aeromagnetic data from the Agadir Melloul region has been enhanced by the improved logistic method for delineating structural features. The obtained result provides a new look at the structural lineaments of the study area.
Keywords
Aeromagnetic data
Tilt angle
Improved logistic
Lineaments
Agadir Melloul region
Morocco

1 Introduction
The Agadir Melloul region is within the southeastern portion of the Igherm region which is known as one of the important mining areas containing some world-renowned ore deposits. These deposits consist of a variety of metallic minerals including valuable metals such as silver, copper, and cobalt. The major metal in the area is copper with over 200 mines. Interpretation of magnetic data to identify lineaments has been used for a long time to study structural controls of mineralization in many ore deposits. Information of such structural features can help in optimizing the choice of areas for exploration by targeting more precisely structures related to metallogenic deposits (e.g., Abia et al., 2020; Echogdali et al., 2021; Ouchchen et al., 2021, Ouchchen et al., 2022).
Subsurface geology can be investigated using potential field surveys based on measuring the variations in both gravity and magnetic fields arising from density/susceptibility differences between subsurface rocks (Ekinci et al., 2013; Duong et al., 2021; Long et al., 2021; Hang et al., 2019; Ghomsi et al., 2022a, b; Pham et al., 2022a, b; Ekwok et al., 2022). Locating the edges of transformed anomalies provides an effective perspective to detect lateral changes of subsurface structures (e.g., Hang et al., 2017; Kha et al., 2018; Oksum et al., 2019, 2021; Sehsah and Eldosouky, 2022; Eldosouky et al., 2020a, 2021a, 2022a,c; Saada et al., 2021a,b). Information on the edges of potential field sources has an important role in estimating potential mineral deposits (Elkhateeb and Abdellatif, 2018; Pham, 2020, 2021; Shebl et al., 2021; Elkhateeb et al., 2021). Many different interpretation methods have been introduced to estimate the edges of the causative sources from potential field data (Eldosouky et al., 2020b, c, 2020d; Melouah et al., 2021). Cordell and Grauch (1985) introduced the gradient amplitude method that is based on the first-order horizontal derivatives of potential field data. Roest et al. (1992) suggested using the total gradient method that is formed through a combination of the first-order vertical and horizontal derivatives of the field. To improve the resolution of the edges, Fedi and Florio (2001) and Beiki (2010) have developed the modified versions of the horizontal gradient and total gradient methods. One of the disadvantages of these methods is that the obtained results are dominated by the signals due to the shallow sources, therefore, it becomes difficult to identify deep geological structures (Dung and Minh, 2017; Pham et al., 2018a, Pham et al., 2020a, Pham et al., 2020b, Pham et al., 2021a, Pham et al., 2021b, Pham et al., 2021c). Some authors have developed balanced methods to detect the edges of the shallow and deep sources at the same time. Miller and Singh (1994) introduced the tilt angle method that normalizes the vertical gradient by the gradient amplitude. Wijns et al. (2005) introduced the theta map method that uses the gradient amplitude to normalize the total gradient. Although these balanced methods are effective in estimating all edges of sources located at different depths, they can produce secondary edges and complicate the delineating of real geological structures (Pham et al., 2021d, e,f,g; Prasad et al., 2022; Eldosouky et al., 2022b). To solve this problem, Pham et al. (2018b), Pham et al. (2019), Pham et al. (2020c) introduced the logistic filters that are based on the gradients of the gradient amplitude or total gradient.
Ouchchen et al. (2021) interpreted aeromagnetic data of the Agadir Melloul region to estimated structural lineaments using the tilt angle method. Using synthetic magnetic data, we review the effectiveness of the tilt angle method. We found that this method produces artifacts around sources. In addition, we reinterpreted aeromagnetic data of the Agadir Melloul region using the improved logistic filter. The obtained result from this filter provides a new look at the structural features of the area.
2 Geological setting
The Agadir Melloul region is part of the Central Moroccan anti-Atlas at the northern margin of the West African Craton (Fig. 1a). The studied sector is located at the western end of the Agadir Melloul inlier (Fig. 1b). Eburnean-metamorphosed metasedimentary rocks include mica-schists and orthogneiss, and multiple plutons of granitoids (e.g., Choubert, 1963; Choubert and Faure Muret, 1973; Hafid, 1992). The base is covered by a Neoproterozoic blanket (Choubert and Faure Muret, 1973) subdivided into three large groups: i) a group of Cryogenic age (Taghdout Group) represented by quartzites and limestones injected with veins, or even packed in small massifs of dolerites or micro-gabbros; ii) a terrigenous sedimentary ensemble (Tiddiline Group) attributed to the Lower Ediacaran and iii) a volcano-sedimentary ensemble (Ouarzazate Group) attributed to the Upper Ediacaran (Kouyaté et al., 2013) (Fig. 1c). The major phase of the Pan-African orogeny that structured the first set is dated to 685 ± 15 Ma (Rb/Sr, Clauer, 1974). It is a compressive ductile strain of NW-SE direction (Oudra et al., 2005). It generates synschistous isoclinal folds and overlapping and declining tectonic accidents (Leblanc, 1975; Hassenforder, 1987). The late Pan-African phase is essentially extensional and results in i) the tilting of the blocks of the Ouarzazate Group, ii) the impressive dislocation of quartzites from the Taghdout group, and iii) the establishment of mafic lavas (Kouyaté et al., 2013).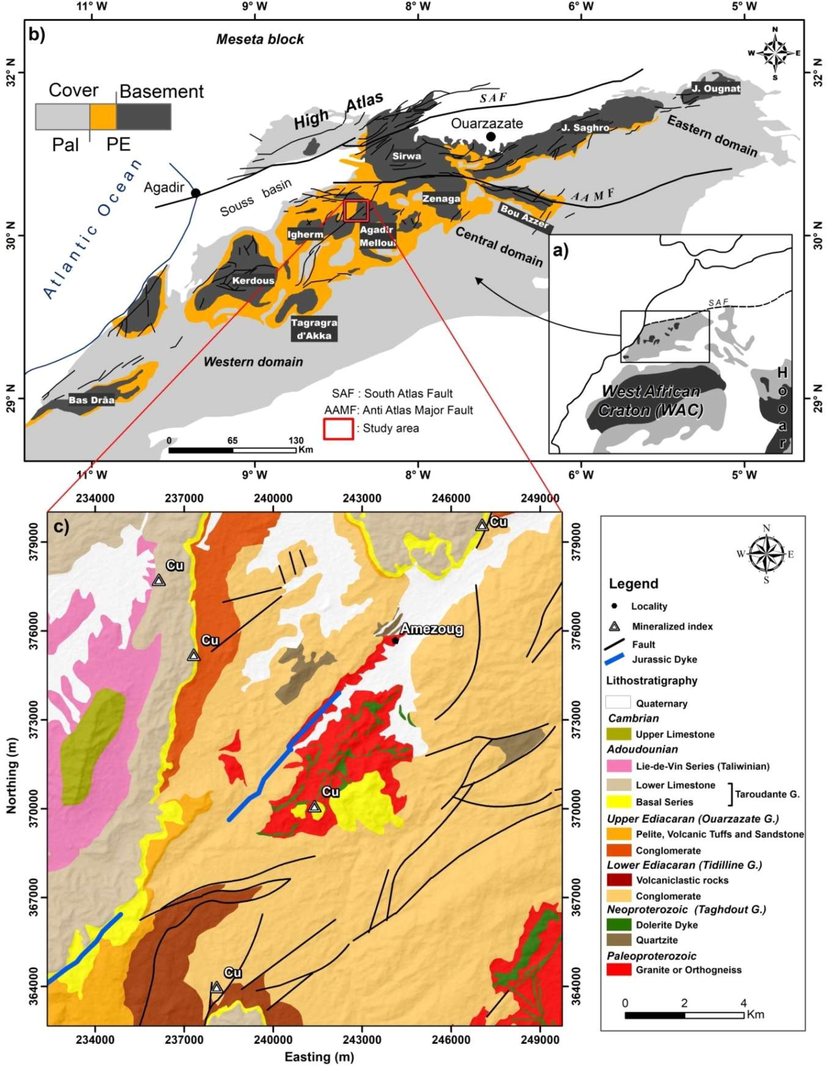
(a) Location map of the anti-Atlas, (b) General geological map of the anti-Atlas and location of the study area (modified from Gasquet et al., 2008), (c) Geological map of the study area (modified from Ouchchen et al., 2021).
The late-Neoproterozoic (Adoudounien) Cambrian cover outcrops on the Neoproterozoic sites. It began with the volcano-sedimentary and siliciclastic deposits of the “Base Series”, evolving into increasingly carbonate content deposits of dolomite from the addition of “Lower Limestone”, topped by purplish-red pelites interspersed with carbonate beds of the “Lie de vin Series”, followed by carbonate deposits from “Upper Limestone” (e.g., Choubert, 1963; Algouti et al., 2001; Benssaou and Hamoumi, 2001, 2003; Benssaou et al., 2017). Hercynian tectonics, linked to the reactivation of deep faults in the basement, is responsible for the structuring of these terrains and the development of folds with a large radius of curvature and submeridian deformation corridor (Chèvremont et al., 2013) (Fig. 1c).
In the Mesozoic, veins of dolerites vertically cut both the Precambrian substratum and its folded Paleozoic cover (Choubert, 1963; Leblanc, 1975), and are linked to the contemporary Triassic extension associated with the opening of the Atlantic ocean (Ait Brahim et al., 2002; Youbi et al., 2013) (Fig. 3c).
The Neogene inversion reactivates the old basement accidents. The resulting uplift took place in two episodes: (i) in the first episode, the anti-Atlas underwent kilometer-scale vertical movements that bring the Precambrian basement back to subsurface conditions causing it to cool to temperatures <60 °C in the Lower Cretaceous (133 Ma) (Sebti et al., 2009); and (ii) in the second episode dated Neogene, the chain of the Anti Atlas underwent an exhumation responsible for the rejuvenation of these reliefs. This last uplift is the result of a combined effect between atlas compressions and an asthenospheric rise (Missenard et al., 2006).
3 Methods
The tilt angle method was introduced by Miller and Singh (1994). It is known as the first phase-based filter and is given by:
Since the tilt angle method uses the ratio of the gradients, it can equalize the amplitude of different anomalies. The method uses the zero value to extract the lateral boundaries of the sources.
Pham et al. (2018b) introduced a new method based on the logistic function of the total gradient for determining the source edges. To improve the effectiveness of this method for thin sources, Pham et al. (2020c) suggested using an improved logistic filter that is given by:
with
The Euler deconvolution method is used to estimate the depth and location of the potential field sources. This method was developed by Thompson (1982) and has been applied to magnetic data along with profiles. Reid et al. (1990) extended the Euler deconvolution method for interpreting gridded data. The 3-D equation of Euler deconvolution is defined by Reid et al. (1990) as:
4 Synthetic examples
In this section, the efficiency of the tilt angle and improved logistic methods are compared. In this context, these methods were applied to two synthetic magnetic models. The 3D view of the first model is shown in Fig. 2a. This synthetic model consists of three prismatic sources with the parameters given in Table 1. Fig. 2b shows the synthetic magnetic data of the model with the true boundaries of the sources are shown by the dashed lines. Fig. 2c shows the result obtained from applying the tilt angle method. Although the source edges can be detected by the zero contours, the tilt angle method produces a false zero contour around the source 1B. Fig. 2c shows the edges detected by the improved logistic method. Clearly, this method is more effective in producing a clear image of the edges than the tilt angle method. In addition, the improved logistic method does not bring any false information to the edge map.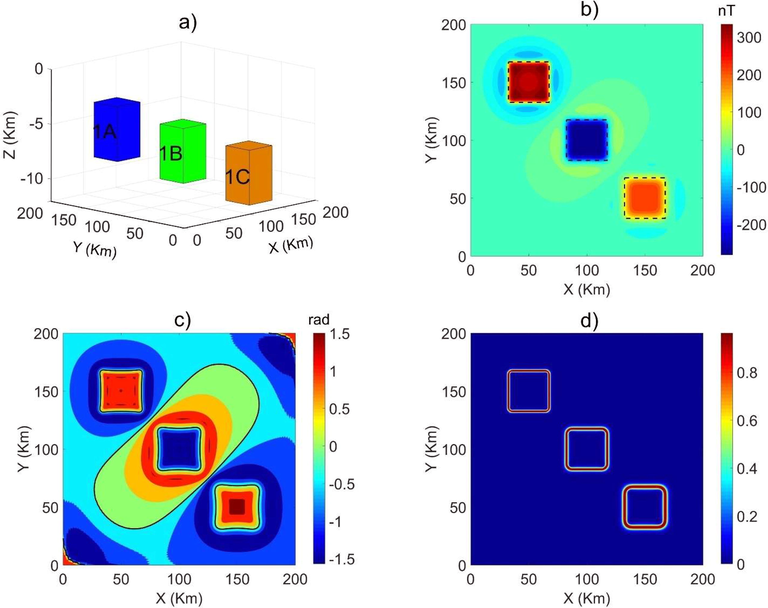
(a) 3D view of the first model, (b) magnetic anomalies of the model, (c) tilt angle, (d) improved logistic.
Parameters / Prism ID
1A
1B
1C
Center coordinates (km; km)
50; 150
100; 100
150; 50
Width (direction x) (km)
35
35
35
Length (direction y) (km)
35
35
35
Depth of top (km)
3
5
7
Depth of bottom (km)
8
10
12
Declination (°)
0
0
0
Inclination (°)
90
90
90
Magnetization (A/m)
2
−2
2
In the second synthetic example, a more complex model consisting of three prismatic sources was used to estimate the effectiveness of the methods. The 3D view of the second synthetic model, whose parameters are given in Table 2, is shown in Fig. 3a. The synthetic anomaly of the model is shown in Fig. 3b where the true boundaries of the sources are shown by the dashed lines. Fig. 3c shows the tilt angle of data in Fig. 3b. We can see that the tilt angle method produces false edges around sources 2A and 2B. Fig. 3d shows the edges determined by the improved logistic method of data in Fig. 3b. As can be observed from this figure, the improved logistic method produces a result with high resolution avoiding bringing false edges around the sources.
Parameters / Prism ID
2A
2B
2C
Center coordinates (km; km)
100; 100
100; 100
100; 100
Width (direction x) (km)
20
60
100
Length (direction y) (km)
20
60
100
Depth of top (km)
3
5
8
Depth of bottom (km)
5
8
12
Declination (°)
0
0
0
Inclination (°)
90
90
90
Magnetization (A/m)
2
2
2
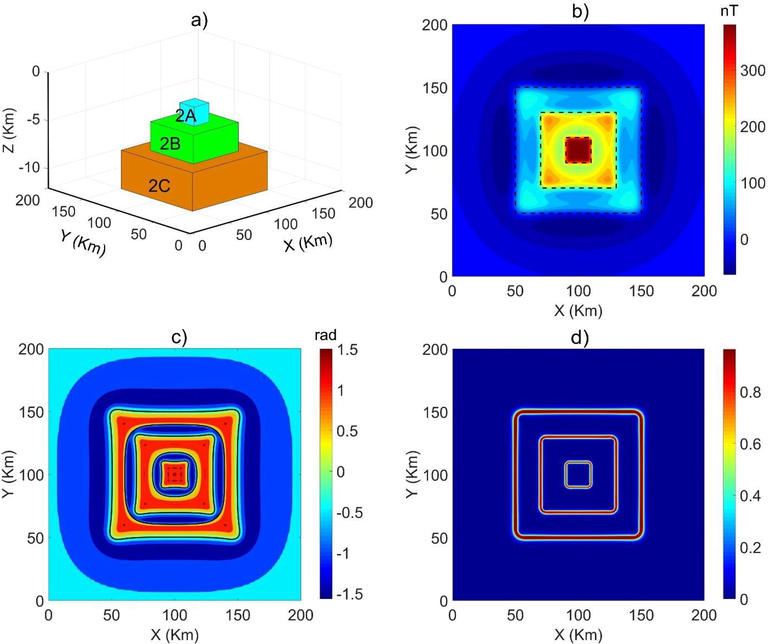
(a) 3D view of the second model, (b) magnetic anomalies of the model, (c) tilt angle, (d) improved logistic.
5 Application to aeromagnetic data of the Agadir Melloul region
5.1 Data
The high-resolution aeromagnetic data used in this note were acquired by the Canadian company “Géoterrx-Dighem” in 1998 on behalf of the Ministry of Energy, Mines, and Sustainable Development (Rabat, Morocco). Data were collected with a flight altitude of ∼30 m, line spacing of ∼500 m, and a flight orientation of ∼N15°. The data were corrected and leveled by the base station. The international geomagnetic reference field (IGRF) was subsequently subtracted from the corrected total field. The values of the magnetic anomaly thus obtained were interpolated on a grid with 125 m resolution (Fig. 4a). The magnetic anomaly data was reduced to the pole (RTP) using a magnetic tilt of 41.1° and a declination of −4.3°, to reposition the anomalies from their causal sources (Baranov and Naudy, 1964). The RTP signature of the studied area contains anomalies of different amplitudes (Fig. 4b).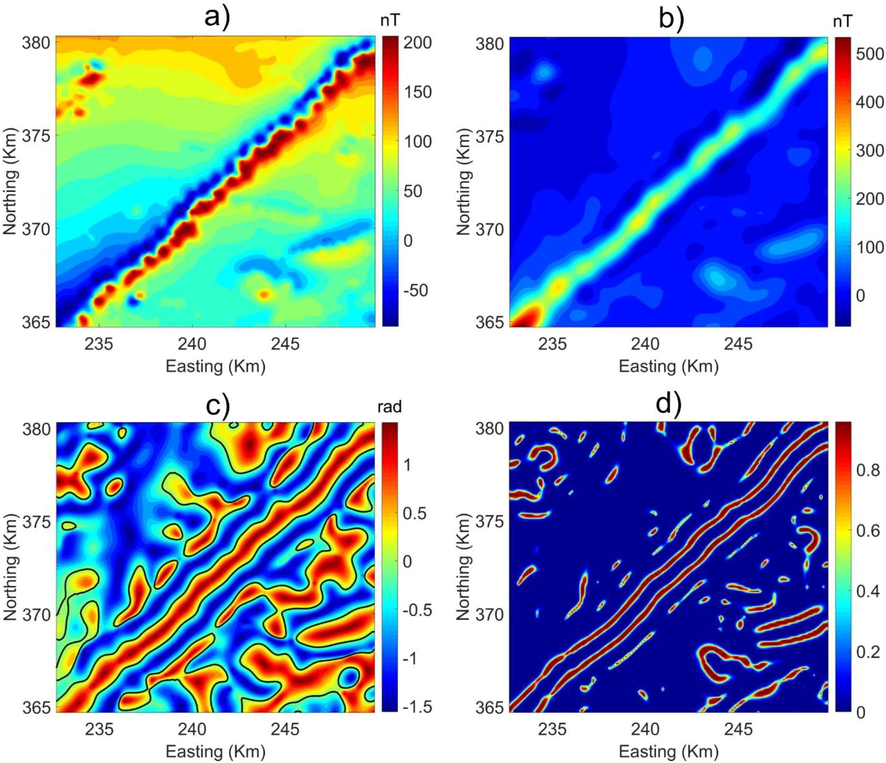
(a) Aeromagnetic map, (b) RTP aeromagnetic map, (c) tilt angle, (d) improved logistic.
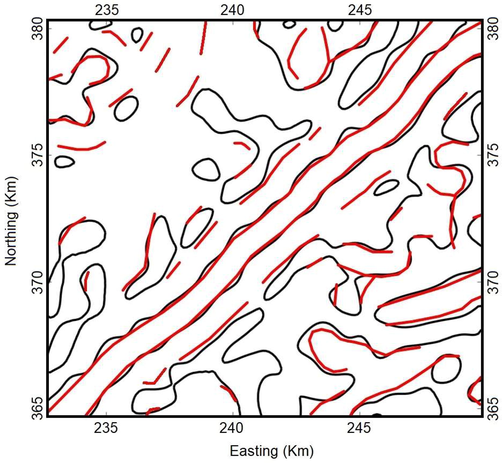
Magnetic lineaments (red lines) detected by the improved logistic method and magnetic lineaments (black lines) determined by the tilt angle method.
5.2 Results
Similar to the study of Ouchchen et al. (2021), we have applied the tilt angle method to the RTP data of the Agadir Melloul region for mapping of magnetic lineaments affecting the area. Fig. 4c shows the results of the tilt angle method applied to the RTP map. The zero-crossing of the tilt angle is used to outline the boundaries of geologic structures. We can see that the zero-crossing of the tilt angle map indicates that there are several different trends in the data with NE-SW trend being dominant (Fig. 4c). Apart from the tilt angle method, the improved logistic method has also been applied to the RTP data of the study area to map structural lineaments. Fig. 4d depicts the result obtained from applying the improved logistic method to the RTP map. The peaks of the improved logistic function are used for mapping geological features. As can be seen from Fig. 4d, the improved logistic map also reveals geological structures with a predominant NE-SW trending lineament. The depths of magnetic sources in the Agadir Melloul region are computed by the Euler deconvolution method. The Euler deconvolution was performed using a 10 × 10 grid window which lies on the range of sizes that are typically used, and a structural index of 0 to locate and determine the contact depth. The Euler depth solutions are shown in Fig. 6. The histogram of the Euler solutions is shown in Fig. 7. We can see that the calculated depth solutions range from 20 to 650 m.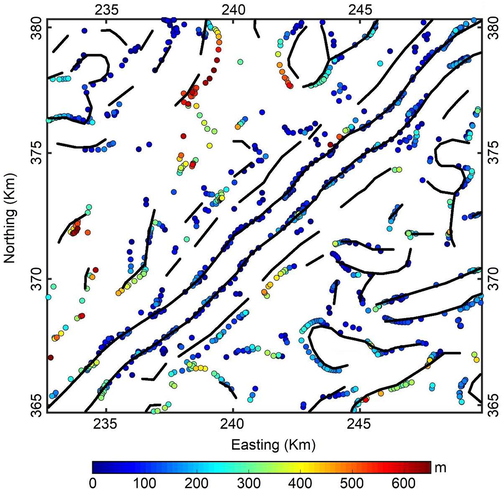
Depths obtained from the Euler deconvolution method. The black lines show magnetic lineaments detected by the improved logistic method.
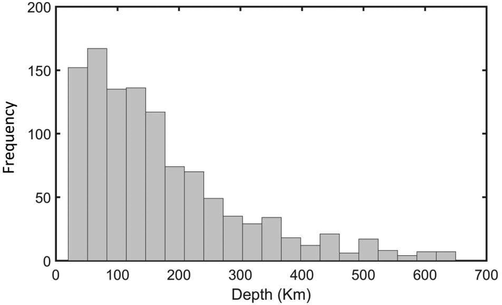
Histogram of the Euler solutions.
5.3 Discussion
In general, the Agadir Melloul region is characterized by a weak magnetic signal (Ouchchen et al., 2021). The negative anomalies detected are associated either with the Precambrian basement formations (conglomerates, pelites, and ignimbrite rocks) or with the non-magnetic sedimentary formations of the cover (the lower series, lower limestones, and the Lie de vin series). In addition, the strong magnetic signal oriented northeast coincides with the doleritic dyke of the Jurassic age, vertically cutting the sector. On the other hand, magnetic data can help in mapping linear systems linked to regional tectonic events and therefore provide a better understanding of the structure of the study area (Archibald et al., 1999; Austin and Blenkinsop, 2009; Salem et al., 2008; Henson et al., 2010). The cause of these lineaments could be the edges of the magnetic bodies, lithological and structural changes, faults, folds, and lateral variations in the magnetization contrast of the basement (Milligan and Gunn, 1997).
Ouchchen et al. (2021) used the tilt angle method for the mapping of magnetic lineaments affecting the region. As can be seen from Fig. 4c, the method can equalize the amplitudes of large and small anomalies, but many adjacent boundaries obtained from this method are connected, making it difficult to detect the geological structures. The obtained result in Fig. 4d shows that the improved logistic method is effective in detecting a wide range of magnetic structures in the Agadir Melloul region. Moreover, it is worth noting that the improved logistic method provides results with higher resolution compared to the tilt angle method. For comparison, Fig. 5 shows the magnetic structures extracted from the tilt angle and improved logistic maps. As can be observed from this figure, many magnetic structures can be detected by both methods. However, the tilt angle method produces more boundaries than the improved logistic method. As shown in the synthetic examples, these additional boundaries in the tilt angle map are artifacts, which are connected to other edges, complicating the geological interpretation. The theoretical examples also showed that the improved logistic method allows for a more accurate estimation of the source edges compared to the tilt angle method. The mapping lineaments in the improved logistic map are oriented NE-SW and E-W. As elucidated in section 2, the geological history of the study area is characterized by the succession of several orogenies; Eburnean, Pan-African, Hercynian, and Alpine. Each of these orogenies was a long-term work in which geological events generated varied geodynamic contexts (oceanic expansion, subduction, active margins, island arcs, rifts, metamorphic orogenic roots, distensive sedimentary basins, etc.). Consequently, these lineaments can be directed by different tectonic events. In the basement area, these lineaments may correspond to overlapping and stall-overlapping accidents of the major Pan-African phase (for a summary see Gasquet et al., 2008). But these accidents can be replayed as normal faults trending NNE-SSW to NE-SW affecting the Ouarzazate Group during the late to post-orogenic event (Oudra et al., 2005). In the area of the cover, they can be interpreted as geological structures previously described at the level of the Anti Atlas as the result of a regional shortening relating to the Hercynian Orogeny of major NW-SE direction (e.g., Hassenforder, 1987; Belfoul et al., 2001, Faik, et al., 2001; Caritg et al., 2004; Helg et al. 2004; Burkhard et al., 2006; Soulaimani and Burkhard, 2008). According to these authors, the folded and brittle geological structures have a NE-SW orientation. However, other orientations (—e.g. E-W and N-S) have been highlighted on the buttonhole borders. From the Trias and to the opening of the central Atlantic, the anti-Atlas is subject to a NNW-SSE extension (Robert-Charrue and Burkhard, 2008) with the establishment of the magmatic of the CAMP (Province Magmatic Central Atlantic) represented basic veins of NE-SW direction. The latter is well expressed in the study area by a mega dolerite vein.
On the other hand, the lineaments mapped near the basement/cover contact which hosts copper mineralization in stratiform clusters (e.g., Tizert copper deposit; Oummouch et al., 2017), deserve to be explored more, because they are defined as a guide to exploring for new copper deposits. For another comparison, the lineaments extracted from the improved logistic map are plotted on the Euler solutions map to measure the degree of similarity between them (Fig. 6). Most of the magnetic sources are found to be located in a depth range of 20 m to 250 m, with major trends of the Euler solutions being NE-SW and E-W. These trends match reasonably with the result from the improved logistic method. It is also noted that the use of the improved logistic method produces more continuous lineaments compared to the Euler deconvolution. Consequently, the improved logistic method can enhance magnetic data, which shows the boundaries of magnetization sources with higher resolution and permits a more precise interpretation of magnetic data than the tilt angle method. The improved logistic map brings a new look at the structural lineaments in the Agadir Melloul area.
6 Conclusions
We aimed to reinterpret the aeromagnetic dataset of the Agadir Melloul area. First, we compared the performances of the tilt angle and improved logistic methods through two synthetic models. The synthetic examples demonstrated that the improved logistic method can detect all edges with higher precision compared to the tilt angle method. In addition, the improved logistic method brings higher resolution edge maps without any false information. The result obtained from the application of the improved logistic method to aeromagnetic data of the Agadir Melloul area was found to be in good agreement with some structural lineaments in the tilt angle map. This result also helps to remove false information in the tilt angle map, so it brings a new look at the structural lineaments in the Agadir Melloul area.
Acknowledgments
This research was supported by Researchers Supporting Project number (RSP-2021/249), King Saud University, Riyadh, Saudi Arabia. This paper is a contribution to IGCP 683: “Pre-Atlantic geological connections among northwest Africa, Iberia and eastern North America: Implications for continental configurations and economic resources”. Finally, Mohamed Abioui would like to dedicate this paper and express his best wishes to Professor Moulid Oudra (Ibn Zohr University, Morocco) for a happy retirement full of excellent health, excitement, and prosperity. The authors are much obliged to the Elsevier proofreading team for handling the work, sending reviews, and preparing the proof.
Data and materials availability
All data needed to evaluate the conclusions in the paper are presented in the paper.
Declaration of Competing Interest
The authors declare that they have no known competing financial interests or personal relationships that could have appeared to influence the work reported in this paper.
References
- The Ordovician iron ore of the Anti-Atlas, Morocco: environment and dynamics of process deposition. Ore Geol. Rev.. 2020;120:103447
- [CrossRef] [Google Scholar]
- Paleostress evolution in the Moroccan African margin from Triassic to present. Tectonophysics. 2002;357(1–4):187-205.
- [CrossRef] [Google Scholar]
- Sedimentation et volcanisme synsédimentaire de la série de base de l’Adoudounien infra-cambrien à travers deux exemples de l’Anti-Atlas du Maroc [Sedimentation and syn-sedimentary volcanism of the infra-Cambrian Adoudounian Basal series interpreted from two areas in the Moroccan Anti-Atlas mountains] J. Afr. Earth Sci.. 2001;32(4):541-556.
- [CrossRef] [Google Scholar]
- Multiscale edge analysis of potential field data. Explor. Geophys.. 1999;30(2):38-44.
- [CrossRef] [Google Scholar]
- Local to regional scale structural controls on mineralization and the importance of a major lineament in the eastern Mount Isa Inlier, Australia: Review and analysis with autocorrelation and weights of evidence. Ore Geol. Rev.. 2009;35(3–4):298-316.
- [CrossRef] [Google Scholar]
- Numerical calculation of the formula of reduction to the magnetic pole. Geophysics. 1964;29(1):67-79.
- [CrossRef] [Google Scholar]
- Analytic signals of gravity gradient tensor and their application to estimate source location. Geophysics. 2010;75(6):159-174.
- [CrossRef] [Google Scholar]
- Mise en évidence d’une tectonique tangentielle antérieure au plissement majeur dans la chaîne hercynienne de l’Anti-Atlas occidental, Maroc [Evidence of a tangential tectonic event prior to the major folding in the Variscan belt of the western Anti-Atlas, Morocco] J. Afr. Earth Sci.. 2001;32(4):723-739.
- [CrossRef] [Google Scholar]
- L’Anti-Atlas occidental du Maroc: étude sédimentologique et reconstitutions paléogéographiques au Cambrien inférieur [The western Anti-Atlas of Morocco: sedimentological and palæogeographical formation studies in the Early Cambrian] J. Afr. Earth Sci.. 2001;32(3):351-372.
- [CrossRef] [Google Scholar]
- Le graben de l’Anti-Atlas occidental (Maroc): contrôle tectonique de la paléogéographie et des séquences au Cambrien inférieur [The Lower-Cambrian western Anti-Atlasic graben: tectonic control of palaeogeography and sequential organisation] C. R. Geosci.. 2003;335(3):297-305.
- [CrossRef] [Google Scholar]
- Geodynamic significance of studying Lower Cambrian Sequence units in the western Anti-Atlas. Int. J. Mater. Sci.. 2017;6(3):142-147.
- [CrossRef] [Google Scholar]
- Tectonique de l’Anti-Atlas marocain [Tectonics of the Anti-Atlas of Morocco] C. R. Geosci.. 2006;338(1–2):11-24.
- [CrossRef] [Google Scholar]
- Fold interference patterns in the Late Palaeozoic Anti-Atlas belt of Morocco. Terra Nova. 2004;16(1):27-37.
- [CrossRef] [Google Scholar]
- Carte géologique Maroc (1/50 000), feuille Ighriy. Notes Mém. Serv. Géol. Maroc, No 2013 548 bis
- [Google Scholar]
- Histoire géologique de l’Anti Atlas de l’Archéen à l’aurore des temps primaires. Notes Mém. Serv. Géol. Maroc. 1963;62:352p.
- [Google Scholar]
- Nouvelles données sur les massifs précambriens des Ida Ou-Zeddoute et des Ida Ou-Zekri; NW d’Igherm; Anti-Atlas (Maroc) C. R. Acad. Sci. Paris. 1973;276(4):477-480.
- [Google Scholar]
- Utilisation de la méthode Rubidium-Strontium pour la datation d’une schistosité de sédiments peu métamorphisés: application au Précambrien II de la boutonnière de Bou-Azzer-El Graara (Anti-Atlas, Maroc) Earth Planet. Sci. Lett.. 1974;22(4):404-412.
- [CrossRef] [Google Scholar]
- Mapping basement magnetization zones from aeromagnetic data in the San Juan basin, New Mexico. In: Hinze W.J., ed. The Utility of Regional Gravity and Magnetic Anomaly Maps. Tulsa, Oklahoma: Society of Exploration Geophysicists; 1985. p. :181-197.
- [CrossRef] [Google Scholar]
- Eruptive-volcanic-basalt structures in the Truong Sa-Spratly Islands and adjacent areas from interpreting gravity and magnetic data. Vietnam J. Earth Sci.. 2017;39(1):1-13.
- [CrossRef] [Google Scholar]
- Relationship between seismicity and active faults in Thanh Hoa province detected by local seismic network. Vietnam J. Earth Sci.. 2021;43(2):199-219.
- [CrossRef] [Google Scholar]
- Echogdali, F.Z., Boutaleb, S., Abia, E.H., Ouchchen, M., Dadi, B., Id-Belqas, M., Abioui, M., Pham, L.T., Abu-Alam, T., Mickus, K.L., 2021. Mineral prospectivity mapping: a potential technique for sustainable mineral exploration and mining activities – a case study using the copper deposits of the Tagmout basin, Morocco. Geocarto Int. https://doi.org/10.1080/10106049.2021.2017006.
- Ekinci, Y.L., Ertekin, C., Yigitbas¸ E., 2013. On the effectiveness of directional derivative based filters on gravity anomalies for source edge approximation: synthetic simulations and a case study from the Aegean graben system (western Anatolia, Turkey). J. Geophys. Eng. 10(3), 035005. https://doi.org/10.1088/1742-2132/10/3/035005.
- Depth estimation of sedimentary sections and basement rocks in the Bornu Basin, Northeast Nigeria Using High-Resolution Airborne Magnetic Data. Minerals. 2022;12(3):285.
- [CrossRef] [Google Scholar]
- Eldosouky, A.M., Pham, L.T., El-Qassas, R.A.Y., Hamimi, Z., Oksum, E., 2021a. Lithospheric Structure of the Arabian–Nubian Shield Using Satellite Potential Field Data. In: Hamimi, Z., Fowler, A.R., Liégeois, J.P., Collins, A., Abdelsalam, M.G., Abd EI-Wahed, M. (Eds.), The Geology of the Arabian-Nubian Shield. Regional Geology Reviews. Springer, Cham, pp. 139-151. https://doi.org/10.1007/978-3-030-72995-0_6.
- Eldosouky, A.M., Pham, L.T., Henaish, A., 2022b. High precision structural mapping using edge filters of potential field and remote sensing data: A case study from Wadi Umm Ghalqa area, South Eastern Desert, Egypt. Egypt. J. Remote. Sens. Space Sci. https://doi.org/10.1016/j.ejrs.2022.03.001.
- A comparative study of THG, AS, TA, Theta, TDX and LTHG techniques for improving source boundaries detection of magnetic data using synthetic models: a case study from G. Um Monqul, North Eastern Desert, Egypt. J. Afr. Earth Sci.. 2020;170:103940
- [CrossRef] [Google Scholar]
- Enhancing linear features in aeromagnetic data using directional horizontal gradient at Wadi Haimur area, South Eastern Desert, Egypt. Carpathian J. Earth Environ. Sci.. 2020;15(2):323-326.
- [CrossRef] [Google Scholar]
- Mapping main structures and related mineralization of the Arabian Shield (Saudi Arabia) using sharp edge detector of transformed gravity data. Minerals. 2022;12(1):71.
- [CrossRef] [Google Scholar]
- Structural analysis and basement topography of Gabal Shilman area, South Eastern Desert of Egypt, using aeromagnetic data. J. King Saud Univ. – Science. 2022;34(2):101764
- [CrossRef] [Google Scholar]
- Integrating aeromagnetic data and Landsat-8 imagery for detection of post-accretionary shear zones controlling hydrothermal alterations: the Allaqi-Heiani Suture zone, South Eastern Desert. Egypt. Adv. Space Res.. 2020;65(1):1008-1024.
- [CrossRef] [Google Scholar]
- Delineation potential gold mineralization zones in a part of Central Eastern Desert, Egypt using Airborne Magnetic and Radiometric data. NRIAG J. Astron. Geophys.. 2018;7(2):361-376.
- [CrossRef] [Google Scholar]
- Probability of mineral occurrence in the Southeast of Aswan area, Egypt, from the analysis of aeromagnetic data. Arab. J. Geosci.. 2021;14(15):1514.
- [CrossRef] [Google Scholar]
- Les structures de la couverture Néoprotérozoïque terminal et Paléozoïque de la région de Tata, Anti-Atlas centre-occidental, Maroc : déformation polyphasée, ou interactions socle/couverture pendant l’orogenèse hercynienne? [The structures of the Late Neoproterozoic and Early Palæozoic cover of the Tata area, western Anti-Atlas, Morocco: polyphased deformation or basement/cover interactions during the Variscan orogeny?] J. Afr. Earth Sci.. 2001;32(4):765-776.
- [CrossRef] [Google Scholar]
- Detection of potential fields source boundaries by enhanced horizontal derivative method. Geophys Prospect.. 2001;49(1):40-58.
- [CrossRef] [Google Scholar]
- The Pan-African belt. In: Michard A., Saddiqi O., Chalouan A., Frizon de Lamotte D., eds. Continental Evolution: the Geology of Morocco (Lecture Notes Earth Sciences. Vol vol. 116. Springer, Berlin-Heidelberg; 2008. p. :33-64.
- [CrossRef] [Google Scholar]
- Main structural lineaments of the southern Cameroon volcanic line derived from aeromagnetic data. J. Afr. Earth Sci.. 2022;186:104418
- [CrossRef] [Google Scholar]
- Mapping of fracture zones and structural lineaments of the Gulf of Guinea passive margins using marine gravity data from CryoSat-2 and Jason-1 satellites. Geocarto Int. 2022
- [CrossRef] [Google Scholar]
- Hafid, A., 1992. Granites et dolérites protérozoïques de la boutonnière d’Igherm (Anti-Atlas Occidental) : Pétrologie, géochimie et signification géodynamique. Ph.D Dissertation, Pierre & Marie Curie University.
- Application of directional derivative method to determine boundary of magnetic sources by total magnetic anomalies. Vietnam J. Earth Sci.. 2017;39(4):360-375.
- [CrossRef] [Google Scholar]
- An improved space domain algorithm for determining the 3-D structure of the magnetic basement. Vietnam J. Earth Sci.. 2019;41(1):69-80.
- [CrossRef] [Google Scholar]
- Hassenforder, B., 1987. La tectonique panafricaine et varisque de l’Anti-Atlas dans le massif du Kerdous, Maroc. Ph.D Dissertation, University of Strasbourg.
- Folding and inversion tectonics in the Anti-Atlas of Morocco. Tectonics. 2004;23(4):TC4006.
- [CrossRef] [Google Scholar]
- 4-D architecture and tectonic evolution of the Laverton region, eastern Yligarn Craton, West Australia. Precambrian Res.. 2010;183(2):338-355.
- [CrossRef] [Google Scholar]
- Improving a maximum horizontal gradient algorithm to determine geological body boundaries and fault systems based on gravity data. J. Appl. Geophys.. 2018;152:161-166.
- [CrossRef] [Google Scholar]
- U-Pb baddeleyite and zircon ages of 2040 Ma, 1650 Ma and 885 Ma on dolerites in the West African Craton (Anti-Atlas inliers): Possible links to break up of Precambrian supercontinents. Lithos. 2013;174:71-84.
- [CrossRef] [Google Scholar]
- Leblanc, M., 1975. Ophiolites précambriennes et gîtes arseniés de cobalt (Bou-Azzer, Maroc). Ph.D Dissertation, Pierre and Marie Curie University.
- Holocene sedimentation offshore Southeast Vietnam based on geophysical interpretation and sediment composition analysis. Vietnam J. Earth Sci.. 2021;43(3):336-379.
- [CrossRef] [Google Scholar]
- Crustal architecture, heat transfer modes and geothermal energy potentials of the Algerian Triassic provinces. Geothermics. 2021;96:102211
- [CrossRef] [Google Scholar]
- Potential field tilt-a new concept for location of potential field sources. J. Appl. Geophys.. 1994;32(2–3):213-217.
- [CrossRef] [Google Scholar]
- Enhancement and presentation of airborne geophysical data. AGSO J. Aust. Geol. Geophys.. 1997;17(2):63-75.
- [Google Scholar]
- Crustal versus asthenospheric origin of the relief of the Atlas mountains of Morocco. J. Geophys. Res.. 2006;111(B3):B03401.
- [CrossRef] [Google Scholar]
- Inverting gravity anomalies over the Burdur sedimentary basin, SW Turkey. Acta Geod. Geophys.. 2019;54(4):445-460.
- [CrossRef] [Google Scholar]
- Oksum, E., Le, D.V., Vu, M.D., Nguyen, T.H.T., Pham, L.T., 2021. A novel approach based on the fast sigmoid function for interpretation of potential field data. Boll. Geofis. Teor. Appl. 62(3), 543-556. https://doi. org/10.4430/bgta0348.
- Airborne magnetism of the Ighrem region (Western Anti-Atlas, Morocco): geological interpretation and prospecting of new copper zones. J. Afr. Earth Sci.. 2021;176:104140
- [CrossRef] [Google Scholar]
- Mineral exploration of copper deposits using factor analysis, geochemical mapping prospectivity index, and fractal model (Western Anti-Atlas, Morocco) Ore Geol. Rev.. 2022;143:104762
- [CrossRef] [Google Scholar]
- La tectonique panafricaine du secteur d’Igherm : Implication des dômes extensifs tardi à post-orogéniques (Anti-Atlas occidental, Maroc) Estud. Geol.. 2005;61(3–6):177-189.
- [CrossRef] [Google Scholar]
- Geology and metallogenesis of the sediment-hosted Cu-Ag deposit of Tizert (Igherm inlier, Anti-Atlas Copperbelt, Morocco) Geofluids. 2017;2017:7508484.
- [CrossRef] [Google Scholar]
- A comparative study on different filters for enhancing potential field source boundaries: synthetic examples and a case study from the Song Hong Trough (Vietnam) Arab. J. Geosci.. 2020;13(15):723.
- [CrossRef] [Google Scholar]
- A high-resolution edge detector for interpreting potential field data: a case study from the Witwatersrand basin, South Africa. J. Afr. Earth Sci.. 2021;178:104190
- [CrossRef] [Google Scholar]
- Determination of maximum tilt angle from analytic signal amplitude of magnetic data by the curvature-based method. Vietnam J. Earth Sci.. 2018;40(4):354-366.
- [CrossRef] [Google Scholar]
- New method for edges detection of magnetic sources using logistic function. Geofzicheskiy Zhurnal. 2018;40(6):127-135.
- [CrossRef] [Google Scholar]
- LAS: a combination of the analytic signal amplitude and the generalised logistic function as a novel edge enhancement of magnetic data. Contrib. Geophys. Geod.. 2019;49(4):425-440.
- [CrossRef] [Google Scholar]
- A new high resolution filter for source edge detection of potential field data. Geocarto Int. 2020
- [CrossRef] [Google Scholar]
- An improved approach for detecting ridge locations to interpret the potential field data for more accurate structural mapping: a case study from Vredefort dome area (South Africa) J. Afr. Earth Sci.. 2020;175:104099
- [CrossRef] [Google Scholar]
- Enhancement of potential field source boundaries using an improved logistic filter. Pure Appl. Geophys.. 2020;177(11):5237-5249.
- [CrossRef] [Google Scholar]
- On the performance of phase-based filters for enhancing lateral boundaries of magnetic and gravity sources: a case study of the Seattle Uplift. Arab. J. Geosci.. 2021;14(2):129.
- [CrossRef] [Google Scholar]
- Performance evaluation of amplitude- and phase based methods for estimating edges of potential field sources. Iran. J. Sci. Technol. Trans. Sci.. 2021;45(4):1327-1339.
- [CrossRef] [Google Scholar]
- Application of the improved parabola-based method in delineating lineaments of subsurface structures: A case study. J. King Saud Univ. Sci.. 2021;33(7):101585
- [CrossRef] [Google Scholar]
- Edge detection of potential field sources using the softsign function. Geocarto Int. 2021
- [CrossRef] [Google Scholar]
- Mapping subsurface structural lineaments using the edge filters of gravity data. J. King Saud Univ. Sci.. 2021;33(8):101594
- [CrossRef] [Google Scholar]
- Comparison of different approaches of computing the tilt angle of the total horizontal gradient and tilt angle of the analytic signal amplitude for detecting source edges. Bull. Miner. Res. Explor.. 2021;165(165):53-62.
- [CrossRef] [Google Scholar]
- Delineation of structural lineaments of the Southwest Sub-basin (East Vietnam Sea) using global marine gravity model from CryoSat-2 and Jason-1 satellites. Geocarto Int. 2021
- [CrossRef] [Google Scholar]
- Determining the Moho interface using a modified algorithm based on the combination of the spatial and frequency domain techniques: a case study from the Arabian Shield. Geocarto Int. 2022
- [CrossRef] [Google Scholar]
- Determination of subsurface lineaments in the Hoang Sa islands using enhanced methods of gravity total horizontal gradient. Vietnam J. Earth Sci.. 2022;44:1-16.
- [Google Scholar]
- Structural mapping of potential field sources using BHG filter. Geocarto Int. 2022
- [CrossRef] [Google Scholar]
- Magnetic interpretation in three dimensions using Euler deconvolution. Geophysics. 1990;55(1):80-91.
- [CrossRef] [Google Scholar]
- Inversion tectonics, interference pattern and extensional fault-related folding in the Eastern Anti-Atlas, Morocco. Swiss J. Geosci.. 2008;101(2):397-408.
- [CrossRef] [Google Scholar]
- Magnetic interpretation using the 3-D analytic signal. Geophysics. 1992;57(1):116-125.
- [CrossRef] [Google Scholar]
- New insights into the contribution of gravity data for mapping the lithospheric architecture. J. King Saud Univ. – Sci.. 2021;33(3):101400
- [CrossRef] [Google Scholar]
- Insights on the tectonic styles of the Red Sea rift using gravity and magnetic data. Mar. Pet. Geol.. 2021;105253
- [CrossRef] [Google Scholar]
- Interpretation of magnetic data using tilt-angle derivatives. Geophysics. 2008;73(1):L1-L10.
- [CrossRef] [Google Scholar]
- Vertical movements at the fringe of the West African Craton: First zircon fission track datings from the Anti Atlas Precambrian basement [Mouvements verticaux à la bordure du Craton Ouest-Africain. Premiers âges par traces de fission sur zircon dans le socle précambrien de l’Anti-Atlas (Maroc)] C. R. Geosci.. 2009;341(1):71-77.
- [CrossRef] [Google Scholar]
- Neoproterozoic hybrid forearc-MOR ophiolite belts in the northern Arabian-Nubian Shield: No evidence for back-arc tectonic setting. Int. Geol. Rev.. 2022;62(2):151-163.
- [CrossRef] [Google Scholar]
- Multisource data analysis for gold potentiality mapping of atalla area and its environs, Central Eastern Desert, Egypt. Minerals. 2021;11(6):641.
- [CrossRef] [Google Scholar]
- Soulaimani, A., Burkhard, M., 2008. The Anti-Atlas Chain (Morocco): the southern margin of the Variscan Belt along the edge of the West African Craton. In: Ennih, N., Liégeois, J.P. (Eds.), The Boundaries of the West African Craton. Geol. Soc. London, Spec. Publ. 297(1), pp. 433-452. https://doi.org/10.1144/SP297.20.
- EULDPH: A new technique for making computer-assisted depth estimates from magnetic data. Geophysics. 1982;47(1):31-37.
- [CrossRef] [Google Scholar]
- Theta map: Edge detection in magnetic data. Geophysics. 2005;70(4):39-43.
- [CrossRef] [Google Scholar]
- The 1750 Ma magmatic event of the West African Craton (Anti-Atlas, Morocco) Precambrian Res.. 2013;236:106-123.
- [CrossRef] [Google Scholar]


