

Translate this page into:
Quercetin has a protective impact on human umbilical vein endothelial cells against tungsten carbide cobalt nanoparticle-induced cytotoxicity, oxidative stress, apoptosis
⁎Corresponding author at: Department of Zoology, College of Science, King Saud University, BOX 2455, Riyadh 11451, Saudi Arabia. salarifi@ksu.edu.sa (Saud Alarifi)
-
Received: ,
Accepted: ,
This article was originally published by Elsevier and was migrated to Scientific Scholar after the change of Publisher.
Abstract
Oxidative stress is a pivotal factor in the pathogenesis of various cancer diseases. In fact, oxidative DNA damage is described as the type of damage probably to occur in cancer cells. This study examined the protective impact of the polyphenolic compound quercetin on human umbilical vein endothelial (HUVEC) cells against tungsten carbide cobalt nanoparticles (WC-Co NPs)-induced oxidative stress, cytotoxicity, and apoptosis. One of the most often used models for studying endothelial cells in vitro is the human umbilical vein epithelial cell. Scanning electron microscope (SEM) and transmission electron microscopy (TEM) were used to measure the size of the NPs prior to WC-Co NPs treatment. WC-Co NPs had a polygonal form and measured 45.26 ± 1 nm in size. Using 3-(4,5-dimethylthiazol-2-yl)-2,5-diphenyltetrazolium bromide (MTT), neutral red uptake (NRU) and lactate dehydrogenase (LDH) assays, the cytotoxicity of WC-Co NPs on HUVECs cells was assessed. The cytotoxicity of NPs increased in a concentration-dependent way. The MTT result was used to calculate the median inhibitory concentration (IC50) for HUVEC cells at 24 h, which came out to be 23.14 μg/ml. Intracellular reactive oxygen species (ROS) and lipid peroxidation (LPO) levels were elevated at 17 g/ml WC-Co NPs and then reduced in HUVECs cells upon immediate exposure to 150 µM quercetin (QR). Using JC-1 staining, the loss of mitochondrial membrane potential (MMP) in control, WC-Co NPs alone and WC-Co NPs plus QR exposed cell were evaluated. In HUVECs cells, maximum apoptotic cells were seen at increasing NPs concentrations. Based on the impacts of NPs on HUVECs cells, the data suggests that QR may work on the process of scavenging ROS, which is responsible for DNA repair. Consequently, the above findings highlight the significance of these QR as defenses against DNA damage brought on by oxidative stress, which frequently happens in a number of cancer disorders.
Keywords
Tungsten carbide cobalt nanoparticle
ROS
HUVECs cells
Apoptosis

Data availability
Data will be made available on request.
This article contains all the data generated or analyzed during this study. Further enquiries can be directed to the corresponding author.
1 Introduction
Products based on nanotechnology have been sold and used on humans and living animals, including adhesives, medicines, cosmetics, and artificial organs and tissue. Nonetheless, prior reports suggested that these nanomaterials could be used in the healthcare industry and/or other fields without risk; therefore, it is important to thoroughly assess their toxicity. Research is still being conducted to validate the safety and exposure route of nanoparticles. Because of the disparity in sizes, there is particular debate regarding the toxicity of nanoscale materials. However, recently, there has been growing interest in the use of bimetallic NPs for treatment of contaminated groundwater and soils and antimicrobial effects (Kim et al., 2014). Tungsten carbide nanoparticles are now being considered for the manufacture of hard metals to achieve extreme hardness and wear resistance, and mixing with cobalt is thought to improve toughness and strength of the material (Bastian et al., 2009). However, the so-recent report indicated that there was a lack of systematic assessment of the DNA damaging and carcinogenic potential of bimetallic NPs in spite of their extensive use in nanotechnological applications (Arora et al., 2020). Based on insufficient data in people and sufficient evidence in experimental animals, the International Agency for Research on Cancer has officially classed the hard metal tungsten carbide as potentially carcinogenic to humans (IARC 2006).
Human umbilical vein endothelial cells, or HUVECs, have been a key model system in the study of endothelial cell function regulation and the function of the endothelium in the blood vessel wall's response to shear forces, stretch, and the formation of atherosclerotic plaques and angiogenesis. In nanotoxicological and/or nanomedicine studies, endothelial cells are of particular interests for two main reasons. First, it serves as the first contact for NPs entering the blood before NPs are delivered to targets (Cao et al., 2017). Therefore, although only some of the NPs are intended to target the blood vessels, it has been suggested that the interactions between endothelial cells and NPs should be carefully assessed to better understand the potential in vivo effects of NPs (Setyawati et al., 2015).
Since quercetin affects glutathione, enzymes, signal transduction pathways, and ROS generation, it is useful in the treatment and prevention of human diseases. According to recent research, quercetin's antioxidant properties mostly show up as effects on signal transduction pathways, glutathione, enzymatic activity, and reactive oxygen species brought on by toxicological and environmental variables. Particle size, content, and associated reactivity all affect the toxic effects on human endothelial cells (Mirowsky et al., 2013). Experimental study has revealed a larger mutagenesis potential of the WC-Co mixture when compared with its individual components, according to van Goethem et al. (1997). This finding has been connected to increased ROS production.
Thus, in this experiment, we examined the cytotoxicity and apoptotic characteristics of WC-Co NPs on 24-hr-on HUVEC cells. NPs mediated toxicity involves various mechanisms, specifically, the over production of ROS in living tissue under stress. Cells primarily produce reactive oxygen species from mitochondria, and the electron transport chain is where most of the ROS is produced. Oxidative stress, apoptotic responses and genotoxicity reactions are the principal mechanisms of toxicity in WC-Co NPs. The objective of this study was to investigate the toxic effects of WC-Co NPs on HUVECs cells. Furthermore, our results will be useful in assessing the environmental friendliness and safety of WC-Co NP use in industry.
2 Materials and methods
2.1 Chemicals and reagents
The chemicals such as quercetin (≥95 % (HPLC grade, cat no. Q4951), 4,5-dimethyl-2-thiazolyl)-2,5 diphenyl-2H-tetrazolium bromide (MTT), Dimethyl sulfoxide (DMSO), Hoechst 33,258 fluorescent dye, 2′,7′-dichlorodihydrofluorescein diacetate (H2DCFDA), Dulbecco’s Modified Eagle Medium (DMEM), Phosphate Buffered Saline (PBS), Fetal Bovine Serum (FBS), Trypsin- EDTA solution 1x etc. were purchased from Sigma-Aldrich. From US Research Nanomaterial Inc., tungsten carbide cobalt nanopowder (WC/Co)–Co-5 wt%,99 %,40–80 nm was acquired. Other chemicals related to the current experiment were bought at local markets.
2.2 Physiochemical characterization of tungsten carbide cobalt nanoparticle (WC-Co NPs)
The physical characterization of WC-Co NPs was done by SEM and TEM (JEOL Inc., Tokyo, Japan). We have determined the size of WC-Co NPs in water by using dynamic light scattering instruments (Malvern, UK). Using an X-ray source of (CuKα, λ = 0.15406 nm) radiations as a Ni filter, a PANalytical X'Pert X-ray diffractometer was used to record the powder X-ray diffraction pattern of WC-Co nano powder.
2.3 Cell culture
Human umbilical vein endothelial (HUVECs) cell lines were purchased from an American type culture collection (Manassas, VA, USA) and its accession no. is ATCC No. CRL-1730 ™. Cells were grown in Dulbecco 's modification of eagle’s medium (DMEM), supplemented with 10 % fetal bovine serum (FBS) and 1 % antibiotic, cells were maintained in a CO2 (5 %) incubator at 37 °C.
2.4 Exposure of WC-Co NPs and QR
WC-Co NPs were suspended in a cell culture medium and diluted to appropriate concentrations (0, 5, 10, 25, 50, 100, and 150 µg/ml) to treatment for 24 h. The appropriate dilutions of WC-Co NPs were then sonicated using a sonicator probe. The following treated cells were harvested to determine cytotoxicity, oxidative stress, apoptotic, proinflammatory responses, and gene expression. Cells not exposed to WC-Co NPs served as a control in each experiment. The QR (150 µM) was used as a protective effect against WC-Co NPs toxicity on HUVECs cells for 24 h.
2.5 MTT assay and determination of IC50 24 h of WC-Co NPs and QR
The MTT assay was used to investigate mitochondrial function as described by Mossman (Mossman, 1983, Almutairi et al., 2021). HUVECs cells were seeded into a 96‑well plate (8 × 10⁴ cells/well) in the complete medium at the volume of 100 µl/well. After overnight incubation, the medium was removed and 100 µL growth culture containing a series of different concentrations of WC-Co NPs (0, 5, 10, 25, 50, 100, and 150 µg/ml) at 24 hr. The medium was replaced by MTT solution (5 mg/ml), at a volume of 20 µL to each well and incubated for 4 h at 37 °C in a dark. After incubation, the MTT solution was removed, and formazan crystals formed by mitochondrial reduction of MTT were solubilized in (100 µl/well) DMSO and gently shacked for 15 min. The plates were read using a microplate reader (Synergy-H1; BioTek) at a wavelength of 570 nm. The assay was performed in triplicate with four replicates per sample. The survival rate of the cells was calculated using the following formula:
Cell viability rate (%) = Optical density (OD) values of the treated samples /OD value of control *100
Based on the IC50-24 h value, the three test concentrations of WC-Co NPs were calculated viz., concentration I (1/4th of LC50 = ∼6 µg/ml), concentration II (1/2nd of LC50 = ∼11 µg/ml) and concentration III (3/4th of LC50 = ∼17 µg/ml). After establishing the IC50 values for WC-Co NPs alone and 150 µM quercetin was used as a protective effect against WC-Co NPs toxicity on HUVECs cells.
2.6 Neutral red uptake (NRU) assay
The lysosomal activity was measured by the NRU assay according to the method of Ali et al., (2010).
The cytotoxicity rate of the cells was calculated using the following formula: Cytotoxicity (%) = (OD in control cells − OD in treated cells)/(OD in control cells)*100.
2.7 LDH assay
The release of cytoplasmic LDH enzyme into the culture, the medium was determined (Ali et al., 2011). The rate of NADH oxidation was determined by the absorbance was measured at 490 nm using a spectrophotometric microtiter plate reader (Synergy-H1; BioTek) and was calculated using this formula: Cytotoxicity (%) =(Test sample- Low control)/(High control-Low control)*100.
2.8 Measurement of intracellular reactive oxygen species
Reactive oxygen species (ROS) generation was assessed in HUVECs cells after exposure to different concentrations by using 2,7-dichlorofluorescin diacetate (DCFH-DA) dye as a fluorescence agent based on the method demonstrated. ROS generation was studied by two methods: fluorometric analysis and microscopic fluorescence imaging. For fluorometric analysis, cells (7 × 10⁴ per well) were seeded in 96-well black bottom culture plates and allowed to adhere them for 24 h in a CO2 incubator at 37C. After discarding the old medium, the HUVECs cells were incubated in the medium containing various concentrations (Control, QR 150 µM alone, 6 µg/ml, 11 µg/ml, 17 µg/ml of WC-Co NPs and 17 µg/ml of WC-Co NPs + QR) for 24 hr. On the completion of respective exposure periods, cells were incubated with pre-prepared 1X DCFH-DA (10 mM) by adding µL of dye solution to 99 µL of DMEM in dark for 60 min at 37C. The reaction mixture was aspirated and replaced by 200 mL of PBS in each well. The plates were kept in a shaker for 10 min at room temperature in the dark. Fluorescence intensity was measured using a microplate reader at excitation wavelength 485 nm and at emission wavelength 535 nm and values were expressed as a percent of fluorescence intensity relative to control wells. A parallel set of cells (7 × 10⁴ per well) was analyzed for intracellular fluorescence using an upright fluorescence microscope equipped with CCD cool camera (Nikon Eclipse 80i equipped with Nikon DS-Ri1 12.7-megapixel camera).
2.9 Oxidative stress biomarkers
HUVECs cells were seeded in 25 cm2 culture flasks at a concentration of (5 × 10⁵/flask) and incubated at 37° and exposed with (Control, QR 150 µM alone, 6 µg/ml, 11 µg/ml, 17 µg/ml of WC-Co NPs and 17 µg/ml of WC-Co NPs + QR) for 24 hr. Next, cells were rinsed three times with cold PBS and buffer solution was added according to each assay protocol and scraped by scraper (Fisher Brand Cell scrapers, Fisher Scientific, USA) and collected in a glass tube after scraping. Then, the cell suspension was sonicated for 10 min at 4 °C by a Q700 sonicator. After sonication, lysis buffer was mixed in scrapped cells and centrifuged at 4500 rpm for 15 min at 4C and the supernatant (cell lysate) was put on ice to determine CAT activity and LPO.
2.9.1 Measurement of catalase level
The CAT activity was determined using the commercially available enzyme assay kit Cayman’s. According to the manufacturer’s protocol. Absorbance was read at 540 nm using a microplate reader (Synergy-H1; BioTek).
2.9.2 Measurement of LPO level
The extent of membrane LPO was estimated by measuring the formation of malondialdehyde (MDA) using the ‘Cayman’s lipid hydroperoxide experiment kit’. according to the manufacturer. absorbance was read at 500 nm using a microplate reader (Synergy-H1; BioTek).
2.10 Determination of MMP
The fluorescence dye 5,5′,6,6′-tetrachloro-1,1′,3,3′-tetraethylbenzimi-dazolylcarbocyanine iodide (JC-1) was used to evaluate the effect of compounds on the potential permeabilization of the mitochondrial membrane in HUVECs cells. MMP was determined using the commercially available enzyme assay kit Cayman’s. According to the manufacturer’s protocol.
2.11 Assessment of gene expression using q RT-PCR
2.11.1 RNA Extraction
The cells were seeded in T-25 flask at a density of 5 × 10⁶ cells/ flask for 24 hr at 37 °C in CO2 incubator. At 80–90 % confluence, the cells were exposed to different concentrations of WC-Co nanoparticles and QR as follows (150 µM QR, 6 µg/ml, 11 µg/ml, 17 µg/ml of WC-Co NPs, 17 µg/ml WC-Co NPs + 150 µM QR) for 24 hr. After 24 hr of incubation media were removed and cells were then rinsed twice with cold PBS and then harvested by adding 800 µl of TRIzol™ Reagent (cat no. 15596026, Thermo Fisher) directly in each flask the flask was incubated on ice for 5 min. Next, the cell lysate was then transferred to a 1.5 ml Eppendorf tube, and 200 µl of cold chloroform was added to the tube for phase separation. After that, the tube was gently shaken by hand for 10 s. The tube was then centrifuged at 4200 RCF for 15 min at 4 °C. After centrifugation, the upper aqueous phase containing total RNA was transferred to a new tube. For RNA precipitation, 500 µl of isopropyl alcohol was added, and were kept on ice for 10 min before being centrifuged at 4200 RCF for 10 min at 4 °C. The supernatant was then carefully removed, leaving a white gel-like pellet containing RNA attached to the bottom of the tube. The RNA pellet was rinsed with 1000 µl of cold absolute ethanol and centrifuged at 3500 RCF for 5 min at 4 °C. Thereafter, the supernatant was discarded, and the RNA pellet was air-dried for 10 min. After, 22 μl of DEPC-treated water was added to the tube. The RNA concentration and purity were measured using a Nanodrop 8000 spectrophotometer. The RNA purity absorbance ratio (260 A / 280 A=1.5–2) and the contamination and precipitation absorbance ratios (260 A / 230 A=1.5–2).
2.11.2 cDNA synthesis
After determining the quantity and purity of RNA, a high-capacity cDNA reverse transcriptase kit (Cat. No. 4368814, Thermo Fisher Scientific, USA) was used to create cDNA from 1000 ng/µl of each RNA sample. All cDNA preparation steps were performed on ice.
The preparation of the cDNA reverse transcription reaction was done by carefully mixing 10 µl of reverse transcription master mix with 10 µl of diluted RNA samples into microcentrifuge tubes and placed in a Thermal cycler (TECHNE, UK); according to the technique listed in Table 1. Then, cDNA was diluted with 180 µl nuclease-free water or DEPC and kept at 4 °C.
Step 1
Step 2
Step 3
Step 4
Temperature (°C)
25
37
85
4
Time
10 min
120 min
5 min
∞
Small amounts of the cDNA sequences were amplified exponentially throughout a series of temperature changes using PCR techniques, and the resulting copies were then kept at 4 °C. Agarose gel electrophoresis was used to validate the presence of cDNA in the samples. By passing the charged molecules through an agarose matrix with the help of an electric field, the cDNA fragments were divided into different sizes.
2.11.3 Quantification of mRNA expression by qRT-PCR
Quantification analysis of reference gene, GAPDH, and apoptosis-associated genes (caspase-3, p53, Bax, Bcl2) was performed by real-time RT-PCR. On the ice, a reaction mixture was prepared as per Table 2. First, 17.5 μl of the reaction mixture was pipetted into the wells of a 96-well PCR plate. Then, 2.5 μl of cDNA was added to the wells to contain a total reaction volume of 20 μl. The reaction plate was sealed and centrifuged into the real-time PCR instrument (Prime Q). Afterward, the plate was analyzed by Techne® Prime Q, a Real-time PCR System. Table 3 shows the primer sequence for the genes. To obtain more accurate results, all samples were run in duplicate.
Component
Volume needed per sample (ul)
GoTaq qPCR Master Mix (syber green 2x)
10 μl
Primers reverse, forward
1.6 μl
DEPC water
11.9 μl
cDNA Sample
2.5 μl
Total per reaction
20 μl
Gene
Forward
Reverse
Size(bp)
Bax
5-ATGTTTTCTGACGGCAACTTC-3′
5′-AGTCCAATGTCCAGCCCAT-3
134
Bcl-2
5-ATGTGTGTGGAGACCGTCAA-3
5-GCCGTACAGTTCCACAAAGG-3′
195
p53
5′-AGAGTCTATAGGCCCACCCC-3′
5′-GCTCGACGCTAGGATCTGAC-3
882
Caspase-3
5′-TGTTTGTGTGCTTCTGAGCC-3′
5′-CACGCCATGTCATCATCAAC-3
125
GAPDH
5′-CTTTTGCGTCGCCAGGTGAA-3′
5′- AGGCGCCCAATACGACCAAA-3′
189
The comparative threshold cycle (2 − ΔΔCT) approach was utilized to evaluate the mRNA abundance (Laila et al., 2020). Every sample was measured using a minimum of two independent experiments, and the comparison analysis's mean ± SE is used to express the results.
2.12 Analysis of data
Statistical analysis was performed by GraphPad Prism Software (version 8.0.1, La Jolla California USA) using one-way ANOVA, followed by post hoc Tukeýs multiple comparison tests, as suggested by the software. Data were shown as mean ± SE of at least three independent experiments. Differences were considered significant at p < 0.05 (*); p < 0.01 (**), p < 0.001 (***), and p < 0.0001 (****). Minimum 3 independent experiments were done in duplicate for each experiment.
3 Results
3.1 Physical characterization of WC-Co NPs
SEM-EDS results confirmed the presence of tungsten, carbon, cobalt in NPs and of other elements (Fig. 1A, B). Such as C at 0.15 keV, W at 2.12 keV and Co at 6.840 to confirm the formation of WC-Co nanoparticles (Fig. 1A). The typical size of WC-Co NPs is 45.26 ± 1 nm (Fig. 1C). The production of WC-Co NPs is confirmed by the XRD result (Fig. 1D).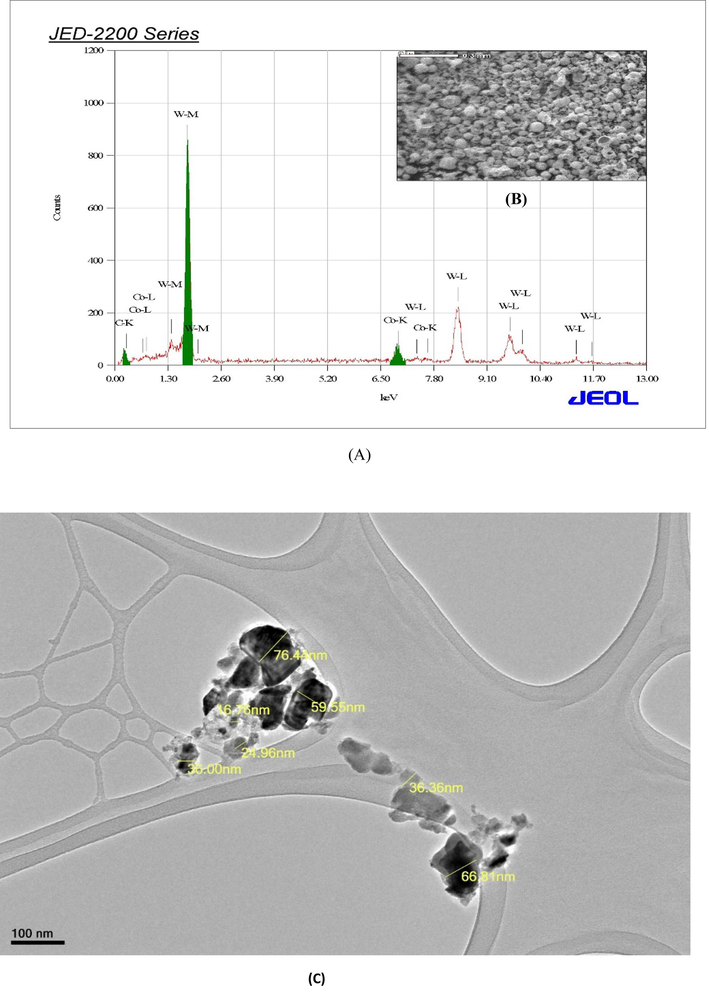
Characterization of WC-Co NPs (A) EDX spectrum and (B) image of WC-Co NPs by scanning electron microscope (C) Image of WC-Co NPs by transmission electron microscope (JEM 1011). (D) X-ray diffraction spectra of of WC-Co NPs.
Characterization of WC-Co NPs (A) EDX spectrum and (B) image of WC-Co NPs by scanning electron microscope (C) Image of WC-Co NPs by transmission electron microscope (JEM 1011). (D) X-ray diffraction spectra of of WC-Co NPs.
DLS and zeta potentials were used to measure the particle size and stability of WC-Co NPs in suspension. The size of WC-Co NPs was measured at 180 ± 5 nm zeta potential on the surface of the NPs in aqueous solution were measured by −0.952 mV.
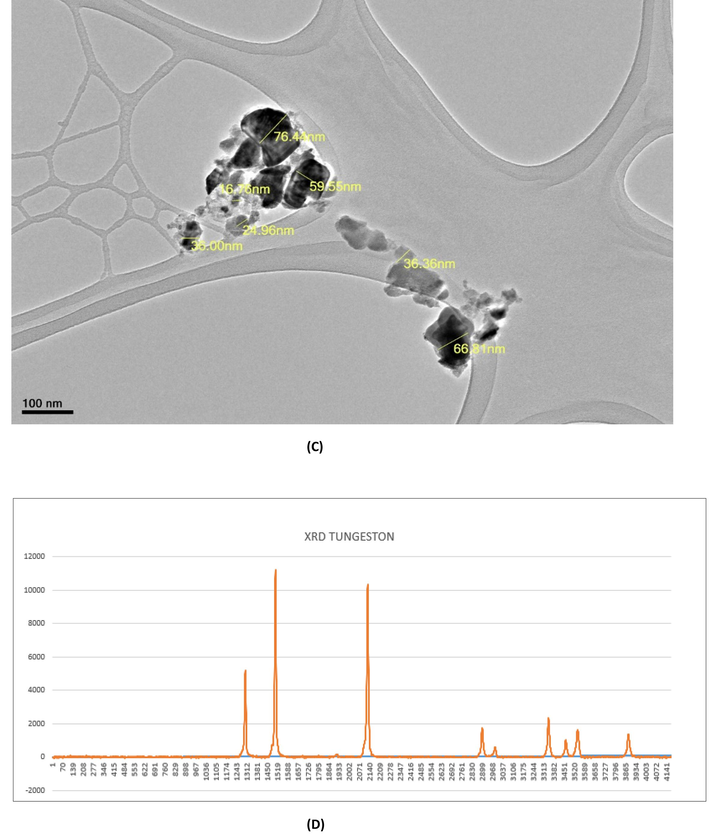
3.2 IC50 value of WC-Co NPs on HUVECs cells
The IC50 value 24 hr for WC-Co NPs on HUVECs cells were determined by the dose–response curve graph using the program Origen Pro 8.5 (Fig. 2) and it was determined on the basis of the MTT test result. We observed that IC50 value at 24 hr for NPs was 23.114 μg/ml for HUVECs cells (Fig. 2).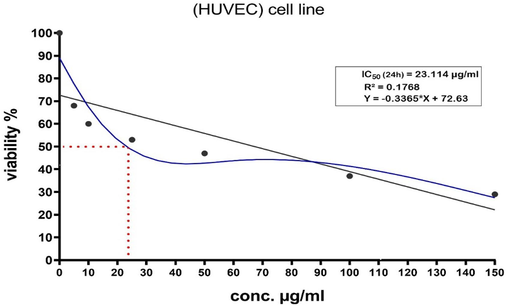
IC50 24 hr of WC-Co NPs in HUVECs cells, n= 3.
3.3 Cytotoxicity of WC-Co NPs on HUVECs cells
Total cell viability is proportional to the number of viable cells, which are metabolically active cells that convert the tetrazolium salt (MTT) to a purple formazan crystal. The different concentrations of WC-Co NPs (0, 5, 10, 25, 50, 100, and 150 μg/ml) were exposed to HUVECs cells for 24 hr. The results revealed a significant increase in cell toxicity in the HUVECs cells (0 %, 31.4 %, 43.6 %, 47.8 %, 58 %, 65 %, 79.8 %) (Fig. 3A).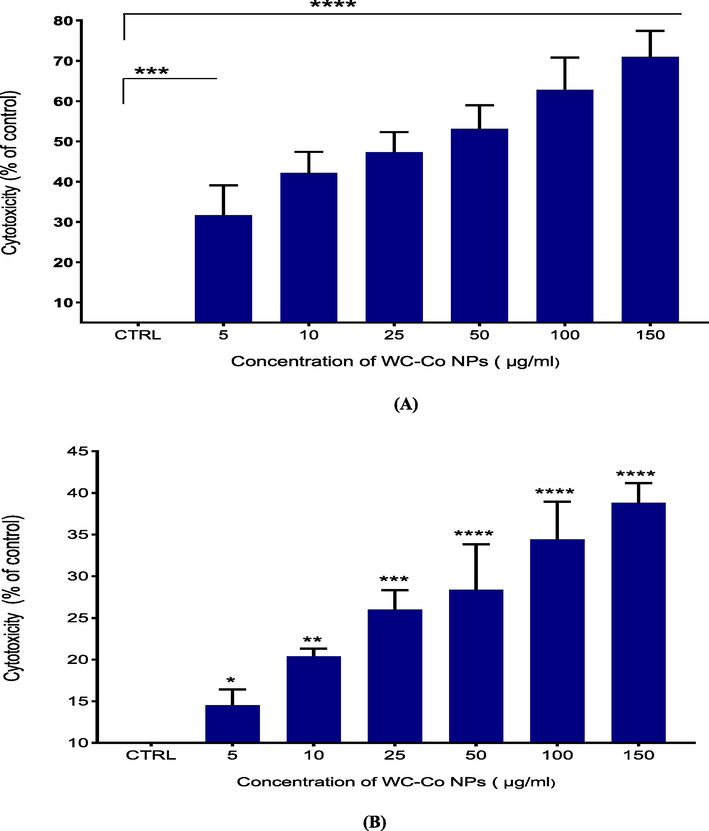
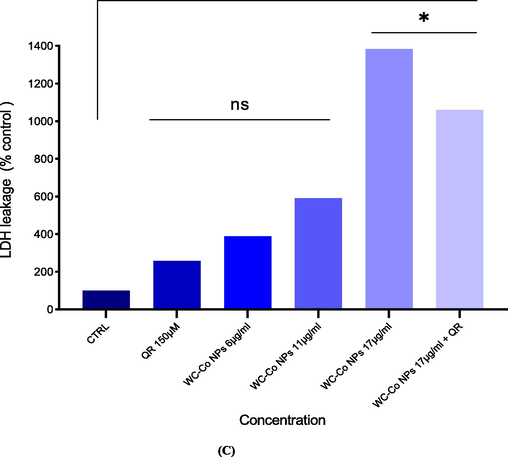
Cytotoxicity level of WC-Co NPs in HUVECs for 24 h, based on the (A) MTT assay (B) NRU assay (C) Released amount of lactate dehydrogenase (LDH). Each value represents the mean ± SE of three experiments. n = 3, *p < 0.05, **p < 0.01, ***p < 0.001, **** p < 0.0001 versus untreated control.
Cytotoxicity level of WC-Co NPs in HUVECs for 24 h, based on the (A) MTT assay (B) NRU assay (C) Released amount of lactate dehydrogenase (LDH). Each value represents the mean ± SE of three experiments. n = 3, *p < 0.05, **p < 0.01, ***p < 0.001, **** p < 0.0001 versus untreated control.
The NRU assay results for HUVECs cells show that NPs caused cytotoxicity in a concentration-dependent manner (Fig. 2B). The results indicated an increase in cell toxicity with (0 %, 14 %, 22 %, 26 %, 29 %, 34.6 %, 42 %) for HUVECs cells (Fig. 3B).
The leakage of lactate dehydrogenase (LDH) enzyme in HUVECs cells was maximum at 17 μg/ml of WC-Co NPs and it was decreased 200 % due to effect of QR exposure (Fig. 3C).
3.4 Reactive oxygen species (ROS)
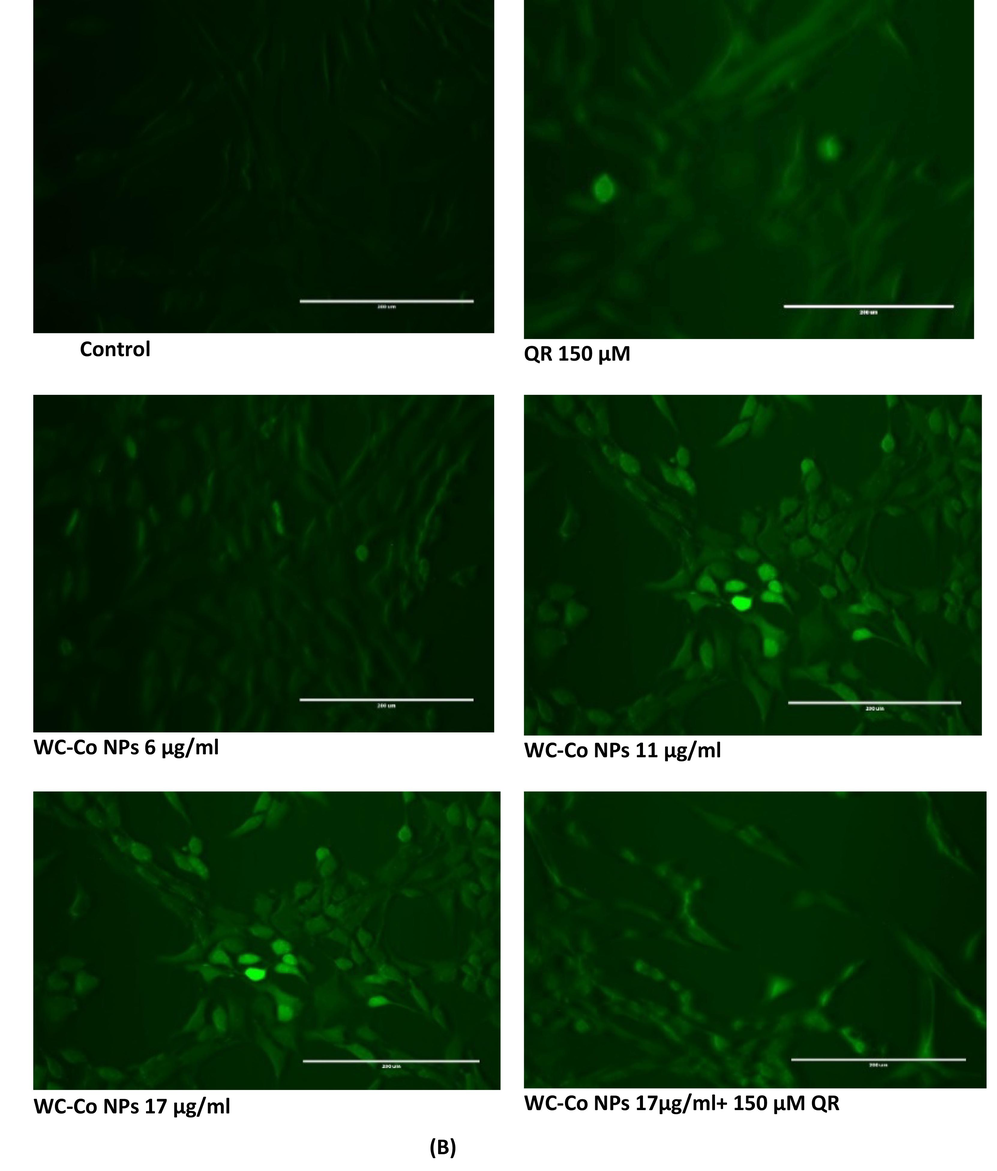
The production of reactive oxygen species (ROS) was measured using the 2′, 7-dichlorofluoresceindiacetate (DCFH-DA) dye as a fluorescence agent. In brief, different concentrations such as (0 µg/ml, Quercetin150 µM, 6 µg/ml NPs,11 µg/ml NPs, 17 µg/ml NPs and 17 µg/ml NPs followed by Quercetin150 µM were exposed to HUVECs cells for 24 hr, and then an ROS assay was performed. The result shows an increasing effect of reactive oxygen species in treated cells compared to control (100 %, 120 %, 138 %,142 %, 156 % and 137 %) for cells, (Fig. 4A). The scavenging effect of QR was observed in decrease in ROS production at 17 µg/ml NPs followed by Quercetin150 µM QR. Fig.4B shows ROS expression in HUVECs cells.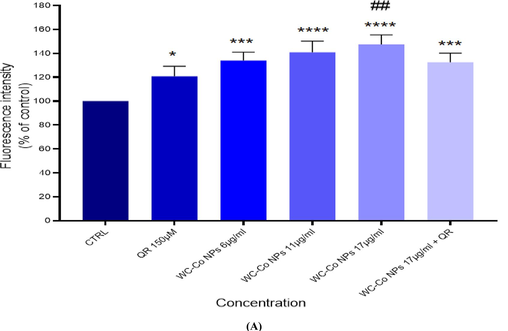
(A) Percentage change in intracellular ROS generation in the in HUVECs cells (B) Induction of ROS levels in HUVECs cells after exposure with WC-Co NPs and QR and combined of both WC-Co NPs + QR for 24 hr. Each value represents the mean ± SE of three experiments. n = 3, (*p < 0.05, **p < 0.01, ***p < 0.001, **** p < 0.0001) versus untreated control, ##p < 0.01 compared with quercetin(QR).
(A) Percentage change in intracellular ROS generation in the in HUVECs cells (B) Induction of ROS levels in HUVECs cells after exposure with WC-Co NPs and QR and combined of both WC-Co NPs + QR for 24 hr. Each value represents the mean ± SE of three experiments. n = 3, (*p < 0.05, **p < 0.01, ***p < 0.001, **** p < 0.0001) versus untreated control, ##p < 0.01 compared with quercetin(QR).
3.5 Oxidative stress assay
The results indicate an increase in LPO activity for treated cells compared to non-treated control cells in HUVECs cells. The LPO activity was found as100 % for control, 140 % for Quercetin150 µM, 150 % for 6 µg/ml NPs, 160 % for 11 µg/ml NPs, 198 % for 17 µg/ml NPs and 170 % for 17 µg/ml NPs followed by Quercetin150 µM were exposed to HUVECs cells (Fig. 5A).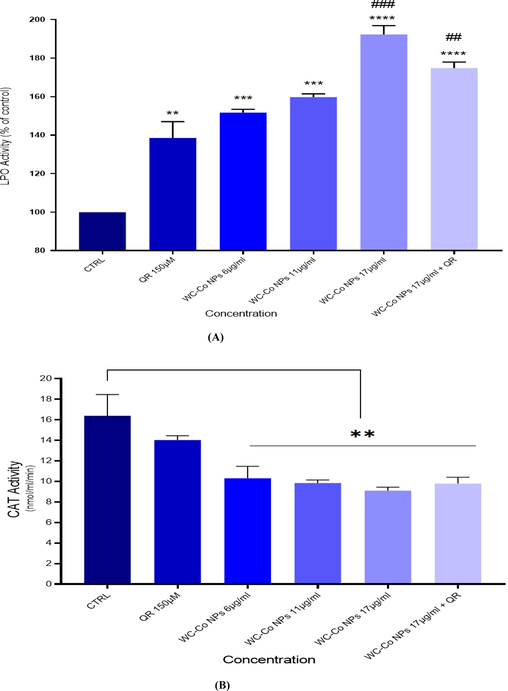
Levels of (A) Lipid peroxide and (B) CAT in HUVECs after exposure to WC-Co NPs and QR and combined of both WC-Co NPs + QR for 24 h. Each value represents the mean ± SE of three experiments. n = 3, **p < 0.01, ***p < 0.001, **** p < 0.0001 versus untreated control, (##p < 0.001, ### p < 0.0001) compared with quercetin (QR).
The results revealed a decrese in CAT activity as16 nm/ml/mn for control, 14 nm/ml/mn for Quercetin150 µM, 10 nm/ml/mn for 6 µg/ml NPs, 9.5 nm/ml/mn for 11 µg/ml NPs, 8.2 nm/ml/mn for 17 µg/ml NPs and 10.4 nm/ml/mn for 17 µg/ml NPs followed by Quercetin150 µM were exposed to HUVECs cells (Fig. 5B).
3.6 Measurement of MMP in HUVECs cells
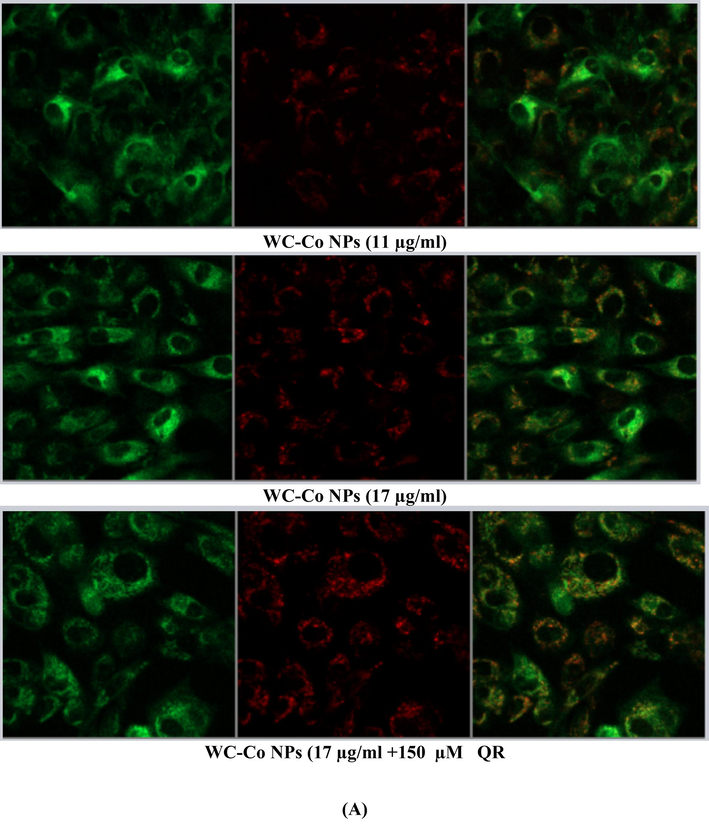
Using a confocal microscope to find apoptotic cells based on mitochondrial membrane potential loss detected with JC-1 dye that appear as green (apoptotic) and red (healthy cells) Cells were seeded at a density of 8 × 10⁴ in 200 μl of culture medium in transparent 6-well plates and exposed to (0 µg/ml, Quercetin150 µM, 6 µg/ml NPs,11 µg/ml NPs, 17 µg/ml NPs and 17 µg/ml NPs followed by Quercetin150 µM were exposed to HUVECs cells for 24 hr,. Results showed a significant increase in the number of apoptotic cells compared to the control untreated cells in cell line. NPs treatment illustrated a higher number of apoptotic cells as compared to the control, as shown in Fig. 6A, B.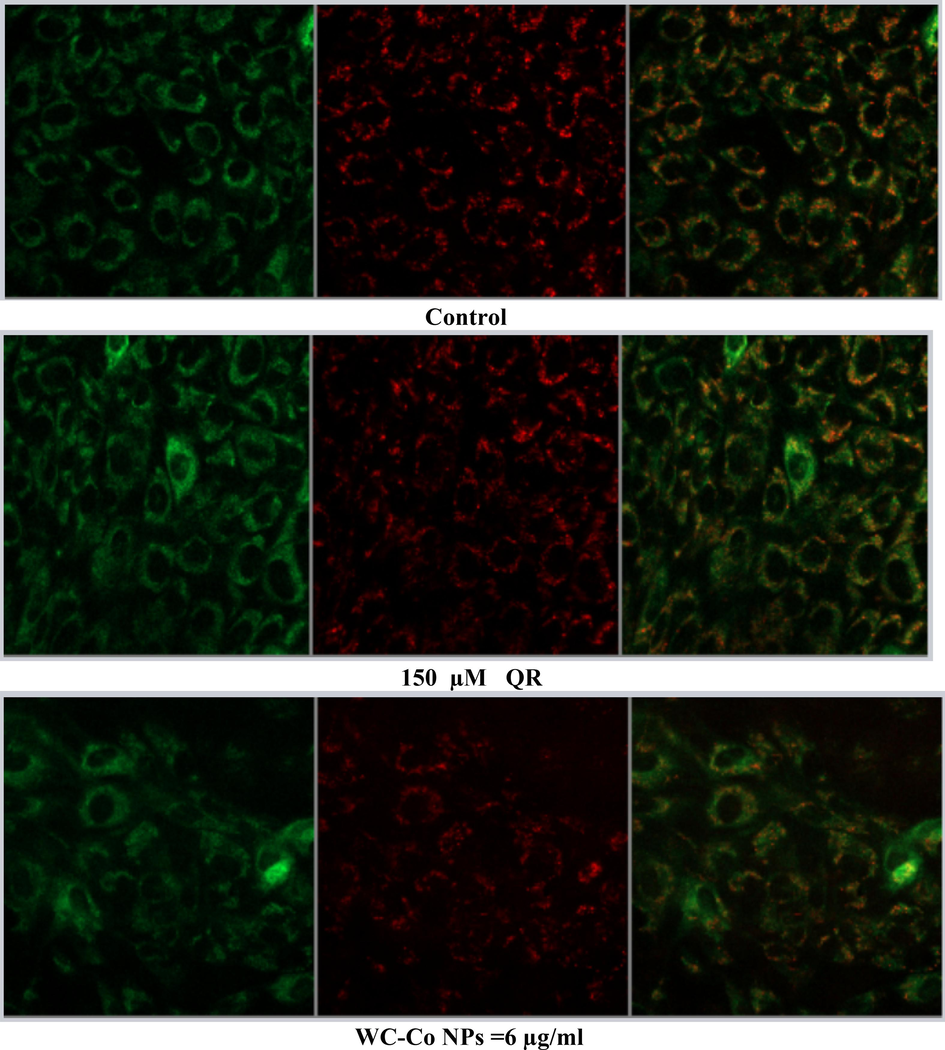
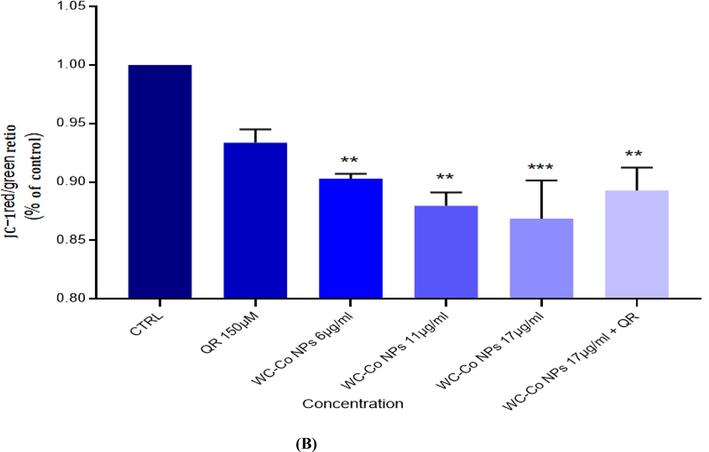
(A). Images representing MMP loss in HUVECs after exposure to different treatments with WC-Co NPs and quercetin for 24 h. (B). Induction of MMP in HUVECs when treated with different treatments alone or in combination for 24 hr. Each value represents the mean ± SE of three experiments. n = 3, (**p < 0.01, ***p < 0.001) versus untreated control.
(A). Images representing MMP loss in HUVECs after exposure to different treatments with WC-Co NPs and quercetin for 24 h. (B). Induction of MMP in HUVECs when treated with different treatments alone or in combination for 24 hr. Each value represents the mean ± SE of three experiments. n = 3, (**p < 0.01, ***p < 0.001) versus untreated control.
(A). Images representing MMP loss in HUVECs after exposure to different treatments with WC-Co NPs and quercetin for 24 h. (B). Induction of MMP in HUVECs when treated with different treatments alone or in combination for 24 hr. Each value represents the mean ± SE of three experiments. n = 3, (**p < 0.01, ***p < 0.001) versus untreated control.
3.7 Gene expression
Gene expression was performed in order to detect the effect of NPs on cells at the gene level. The cDNA for specific apoptotic genes was synthesized after cells were seeded and exposed to NPs. The RT-PCR data were analyzed using the relative gene expression (Ct) method. Thus, the data was given as the fold change in gene expression adjusted to the endogenous reference GAPDH gene (Fig. 7A, B, C, and D). The fold change in the level of target genes between treated and untreated cells is represented in Fig. 7A, B, C, and D. The bax gene expression in cells treated with 17 µg/ml was increased 1.5-fold significantly compared to control in cells (Fig. 7A). Furthermore, at the caspase-3 gene level, there is an increase in fold change mRNA expression of most of the WCoNPs concentrations, for instance, a significant increase at 11 and 17 µg/ml of WCoNPs (Fig. 7C). Moreover, the BCL2 gene, which is considered one of the apoptotic factors, was expressed with significant decrease at 11 and 17 µg/ml of WCoNPs (Fig. 7B). While p53 gene expression is significantly increasing at all concentrations of NPS in the HUVECs cells (Fig. 7D),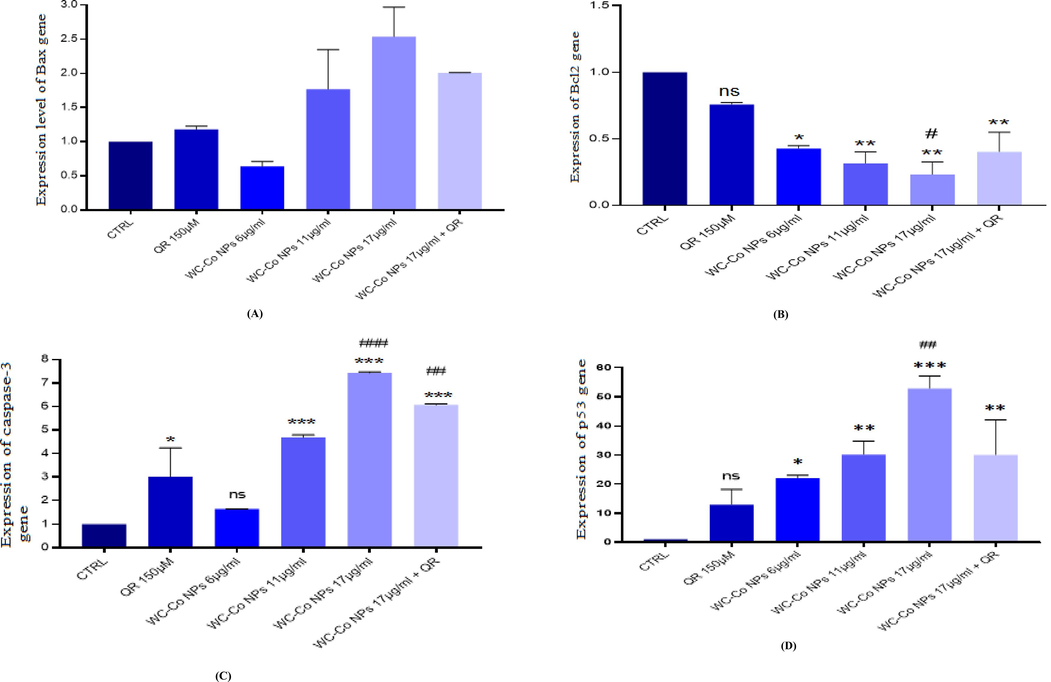
Gene expression levels in HUVECs cells after exposure to WC-Co NPs and QR and combined of both WC-Co NPs + QR for 24 hr. (A) Bax (B) Bcl2 (C) Caspase-3 (D) p53. n = 3, (*p < 0.05, **p < 0.01, ***p < 0.001) versus untreated control, (##p < 0.001) compared with quercetin.
4 Discussion
Biological systems are frequently exposed to excessive reactive oxygen species, causing a disturbance in the cells natural antioxidant defense systems and resulting in damage to all biomolecules, including nucleic acids. Because of its numerous scientific and technological uses, nanotechnology is one of the newest technologies in creative research. Humans are not aware of the increased risk of exposure to nanoparticles, which can enter biological systems through many routes, which is a significant and concurrent consequence of these growing nano-based applications. In instance, nanoparticles can morph in size over a range of mediums and offer a measurable increase in surface area in comparison to mass. One of the most often utilized models for endothelial cells in vitro is the human umbilical vein endothelial cells (HUVECs) (Garbern et al., 2013). In the current study examined the harmful effects of NPs on HUVECs cells, the processes behind these effects, and the interactions between quercetin and NPs using HUVECs as a model. For in vitro research, stem cells constitute a cutting-edge modeling method. The HUVECs model can be used to study the physiological and pathological effects of different stimuli in both isolated and co-cultured forms with other cell types, such as leukocytes and smooth muscle cells, despite being physiologically representative of the human vascular endothelium (Maciag et al., 1981).
Tungsten carbide cobalt nanocomposite (WC-Co NPs) has been chosen for this investigation in order to assess its impact on HUVEC growth inhibition, genotoxic reactions, oxidative stress, and apoptotic cell death. WC-Co NPs size distribution was shown by the results of dynamic light scattering analysis during physical characterization. TEM imaging confirmed the calculated average particle size of 45.26 ± 1 nm. This is comparable to the findings of the study by Moche et al. (2014), which showed that the isolated NP size distribution, as determined by TEM images of the suspension of WC-Co NPs, varied from 20 to 160 nm, with 67.8 % of NP falling between 50 and 90 nm.
On the other hand, cells were exposed to WC-Co NPs and two methods (MTT and NRU) were used to check for inhibition of cell proliferation. The mitochondrial dehydrogenase enzyme, which is only active in live cells, reduces water-soluble tetrazolium salt into an insoluble formazan, which is the basis for the MTT assay (Alarifi et al., 2016). The MTT data shows that there were several disruptions in the metabolic capacities of the cells, which led to the suppression of growth. Following WC-Co NP treatment, the MTT assay results are consistent with comparable metabolic abnormalities in the mitochondria of HUVECs. After 24 h of incubation, HUVECs exposed to WC-Co NPs showed a substantial reduction in HUVEC survival at 5, 10, 25, 50, 100, and 150 µg/ml, with an IC50 value of 23.144 μg/ml. In the same vein, the NRU test verified this outcome. In order to manage hereditary illnesses, dietary ingredients are employed as a chemoprotective method (Selvendiran et al., 2005). Quercetin may be utilized as a nutraceutical to provide protection against a number of diseases, according to some research. Since quercetin affects glutathione, enzymes, signal transduction pathways, and ROS generation, it is useful in the treatment and prevention of human diseases. The most widely recognized and developed mechanism for the potential toxicity of nanoparticles (NPs) is most likely the nanomaterial-induced oxidative stress. Curiously, no comprehensive investigation integrating real-time monitoring of cell growth, cytotoxicity/genotoxicity, internalization of NPs, formation of ROS, and cell cycle analysis of many cell lines indicative of putative retention organs has been documented for WC-Co NPs to yet.
Our findings suggest that oxidative stress is probably the main mechanism of WC-Co toxicity, despite the fact that it has been implicated as the toxic mechanism associated with other nanomaterials such as titanium dioxide or silica (Sun et al., 2011). This is reportedly linked to the cytotoxic effects of NPs on both cancer and normal cells (Paget et al., 2015). The cytotoxicity of WC-Co NPs against different cell types was examined by Bastian et al. (2009), who also demonstrated cell type differences. Our results, which are in line with those of several previous research (Paget et al., 2015), demonstrated that the combination of WC and Co forms a particular hazardous entity that produces more ROS. According to a different study by Xu et al. (2019), quercetin exhibits strong antioxidant activity by preserving oxidative balance. Oxidative stress caused by an excess of reactive oxygen species (ROS) is often closely linked to oxidative damage to proteins and DNA, which is why nanomaterials are often genotoxic. Also, quercetin slows the cell cycle, angiogenesis, apoptosis, and migration of cancer cells (Kashyap et al., 2016). According to our findings, the combination of quercetin and WC-Co NPs enhances their ability to prevent ROS generation. Comparing the ROS level to the group treated with WC-Co NPs, the results demonstrated a considerable reduction in ROS due to the percentage of toxicity. In the majority of cell culture models, quercetin has been shown by Chen et al. (2004) to display antioxidant and cell-protective properties; yet, in other investigations, QU has been shown to exhibit prooxidant and cytotoxic properties. The effects of WC-Co NPs, quercetin, or their combination on HUVEC cell lines generated a significant (p < 0.05) quantitative dose-dependent increase in ROS levels, which was further supported by the lipid peroxide activity assay.
According to the current findings, WC-Co NPs decreased CAT levels, increased ROS and LPO levels, and decreased the viability of HUVEC cell lines. Mitochondrial damage can take place either due to ROS generated on the surface of nanomaterials or due to physical damage to the mitochondrial membrane. The disturbed oxidant balance can occur either through increased ROS production or through a defective antioxidant defense in response to persistent nanomaterial exposure (Pathak et al., 2015). Our results are consistent with previous reports that bcl2, mRNA and protein expression levels are markedly elevated in apoptotic cells at As2O3 dosages that cause apoptosis in BEAS-2B cells (Tang et al., 2021). By upregulating the expression of bax, caspase-3, and p53 and downregulating the expression of bcl-2, it was clear that WC-Co NPs caused apoptosis in HUVEC cells. The anti-inflammatory properties of quercetin may lessen the harmful effects of WC-Co NPs. While WC-Co NPs significantly increased the degree of apoptosis induction, we observed that when only exposed cells were compared to the control, a higher level of apoptosis induction was observed in high-concentration of WC-Co NPs. This was confirmed in this study, particularly for 17 µg/ml of WC-Co NPs without quercetin.
5 Conclusion
On the basis of our finding in this experiment we conclude that in the future, new anticancer therapies can be developed using different approaches, such as a combination of metals targeting multiple cancer cell lines, exploring different in vivo models to reveal interlinked signaling pathways, and identifying the potential benefits of WC-Co NPs in different cancer types to achieve targeted drug delivery.
CRediT authorship contribution statement
Wed Alharthi: Software, Methodology, Investigation. Daoud Ali: Writing – review & editing, Writing – original draft, Visualization, Validation, Supervision, Software, Methodology, Investigation, Formal analysis, Data curation, Conceptualization. Khadijah N. Yaseen: Software, Resources, Methodology. Bader O Almutairi: Software, Resources, Methodology, Investigation, Formal analysis. Saud Alarifi: Supervision, Project administration, Funding acquisition, Conceptualization.
Acknowledgments
This research was supported by Researchers Supporting Project number (RSP2024R27), King Saud University, Riyadh, Saudi Arabia.
Declaration of competing interest
The authors declare that they have no known competing financial interests or personal relationships that could have appeared to influence the work reported in this paper.
References
- In vitro apoptotic and DNA damaging potential of nano barium oxide. Int. J. Nanomed.. 2016;11:249.
- [Google Scholar]
- Ali ,. Ray R.S, Hans R.K., UVA-induced cyototoxicity and DNA damaging potential of benz (e) acephenanthrylene, Toxicology Letters, 2010; 199(2):193-200.
- Ali D, Verma A., Mujtaba F., Dwivedi A.,. Hans, R.K Ray R.S., UVB-induced apoptosis and DNA damaging potential of chrysene via reactive oxygen species in human keratinocytes, Toxicology Letters,Volume 204, I(2–3),2011, 199-207.
- Mechanisms of Apoptotic Cell Death by Stainless Steel Nanoparticle Through Reactive Oxygen Species and Caspase-3 Activities on Human Liver Cells. Front. Mol. Biosci.. 2021;8:729590
- [Google Scholar]
- Bimetallic Nanoparticles for Antimicrobial Applications. Front. Chem.. 2020;2020:8.
- [Google Scholar]
- Toxicity of tungsten carbide and cobalt-doped tungsten carbide nanoparticles in mammalian cells in vitro. Environ Health Perspect.. 2009 Apr;117(4):530-536.
- [Google Scholar]
- The use of human umbilical vein endothelial cells (HUVECs) as an in vitro model to assess the toxicity of nanoparticles to endothelium: a review. J. Appl. Toxicol.. 2017;37:1359-1369.
- [Google Scholar]
- Coadjustment of quercetin and hydrogen peroxide: the role of ROS in the cytotoxicity of quercetin. Die Pharmazie-an International Journal of Pharmaceutical Sciences. 2004;59(2):155-158.
- [Google Scholar]
- Molecular mechanisms of action of quercetin in cancer: recent advances. Tumor Biology. 2016;37:12927-12939.
- [Google Scholar]
- Kim E-J, Thanh T L, Chang Y-S. Comparative toxicity of bimetallic Fe nanoparticles toward Escherichia coli: mechanism and environmental implications. Environ. Sci.: Nano, 2014, 1, 233.
- Methanol Extract of <i>Coleus amboinicus</i> (Lour) Exhibited Antiproliferative Activity and Induced Programmed Cell Death in Colon Cancer Cell WiDr. Int. J. Food Sci.. 2020;2020:9068326.
- [CrossRef] [Google Scholar]
- Serial propagation of human endothelial cells in vitro. J. Cell Biol.. 1981;91:420-426.
- [Google Scholar]
- The effect of particle size, location and season on the toxicity of urban and rural particulate matter. Inhal Toxicol.. 2013;25(13):747-757.
- [Google Scholar]
- Rapid colorimetric assay for cellular growth and survival: application to proliferation and cylotoxicity assays. J. Lmmunol. Methods. 1983;65:55.
- [Google Scholar]
- Human cell line-dependent WC-Co nanoparticle cytotoxicity and genotoxicity: a key role of ROS production. Toxicol. Sci.. 2015;143(2):385-397.
- [Google Scholar]
- Targeted nanoparticles in mitochondrial medicine. Wiley Interdisciplinary Reviews: Nanomedicine and Nanobiotechnology. 2015;7(3):315-329.
- [Google Scholar]
- Chemopreventive effect of piperine on mitochondrial TCA cycle and phase-I and glutathione-metabolizing enzymes in benzo(a)pyrene induced lung carcinogenesis in Swiss albino mice. Mol. Cell. Biochem.. 2005;271:101-106.
- [Google Scholar]
- Understanding and exploiting nanoparticles’ intimacy with the blood vessel and blood. Chem. Soc. Rev.. 2015;44:8174-8199.
- [Google Scholar]
- Cytotoxicity and mitochondrial damage caused by silica nanoparticles. Toxicol. In Vitro. 2011;25(8):1619-1629.
- [Google Scholar]
- Arsenic trioxide induces expression of BCL-2 expression via NF-κB and p38 MAPK signaling pathways in BEAS-2B cells during apoptosis. Ecotoxicol. Environ. Saf.. 2021;222:112531
- [Google Scholar]
- Comparative evaluation of the in vitro micronucleus test and the alkaline single cell gel electrophoresis assay for the detection of DNA damaging agents: genotoxic effects of cobalt powder, tungsten carbide and cobalt–tungsten carbide. Mutation Research/genetic Toxicology and Environmental Mutagenesis. 1997;392(1–2):31-43.
- [Google Scholar]
- Quercetin inhibits angiogenesis mediated human prostate tumor growth by targeting VEGFR-2 regulated AKT/mTOR/P70S6K signaling pathways. PLoS One. 2019;7:e47516.
- [Google Scholar]
Appendix A
Supplementary material
Supplementary data to this article can be found online at https://doi.org/10.1016/j.jksus.2024.103437.
Appendix A
Supplementary material
The following are the Supplementary data to this article:


