

Translate this page into:
Quantum chemical descriptors in the QSAR studies of compounds active in maxima electroshock seizure test
⁎Corresponding author. adedirinoluwaseye@yahoo.com (Adedirin Oluwaseye) senguade@gmail.com (Adedirin Oluwaseye)
-
Received: ,
Accepted: ,
This article was originally published by Elsevier and was migrated to Scientific Scholar after the change of Publisher.
Peer review under responsibility of King Saud University.
Abstract
DFT quantum mechanical method B3LYP/631G∗∗ was used to optimize the molecular geometry of some 2-amino-N-benzylacetamide derivatives with anticonvulsant activities. Molecular descriptors were extracted from the optimized structure and used together with their activity as the database for the study. Kennard-Stone algorithm, genetic function algorithm, and multiple linear regressions were used to build a robust quantitative structure-activity relationship model. The quality of the model was shown by its parameters: R2 (0.9270), R2adj (0.9178), F8,63(100.02), Q2 (0.9036) and R2pred (0.7406). Therefore, the model can be used to predict the activity of new chemicals that within its applicability domain. The x-component of molecular dipole moment (dx), HOMO-LUMO energy gap (Δ∊), electrophilicity index (Ω), square of ovality (Ф2), anisotropy of the polarizability (β2), topological electronic index (TE), square root of the sum of square of charges on all hydrogen (QH) and square root of the sum of square of charges on all nitrogen (QN) are the descriptors that influenced the anticonvulsant activity of the studied compounds. This information can be utilized in the future to optimize the anticonvulsant activity of the studied compounds.
Keywords
B3LYP/631G∗∗
Quantitative structure-activity relationships
Maxima electroshock
Genetic function algorithm
Quantum descriptors

1 Introduction
Quantitative structure-activity relationship study (QSARs) seeks to change drug development process from trial and error format, chemical intuition and experience into a form that can be mathematically computed. It establishes a relationship (a model) between quantifiable molecular properties and biological activity of molecules (Arthur et al., 2016). This model can be used to screen compounds for the studied properties and optimize existing molecules to improve their activity. It is an approach that manages resources and speeds up the process of new molecule development(Arthur et al., 2016). Quantum chemical (QC) calculations are attractive sources for molecular properties. It gives reliable information on all electronic and geometric properties of molecules and their interactions (Choudhary and Sharma, 2014). Many authors had reported the application of quantum descriptors in QSAR/QSPR studies (Olariu et al., 2013; Stachowicz et al., 2014).
Epileptic convulsion occurs as a result of an imbalance between excitatory and inhibitory neurotransmission in the central nervous systems (Ghidini et al., 2006). It is affecting about 1% of the world population and about 30% of those affected do not respond to marketed antiepileptic drugs (AEDs) (Ghidini et al., 2006). As a result of this and many unwanted side effect, the search for a more potent and cheaper anticonvulsant is a continuous endeavor (Stafstrom, 2006). Some 2-amino-N-benzylacetamides were reported to be effective in maximal electroshock seizure (MES) test (King, 2011) which is one of the animal models used in evaluating the anticonvulsant activity of molecules. The objective of the study is to conduct QSAR analysis on these compounds and use the model obtained to screen other known or hypothetical compounds with unknown activities.
2 Materials and methods
2.1 Dataset
The dataset used was 2-amino-N-benzylacetamide derivatives reported literature to possess anticonvulsant activity in MES test (King, 2011). Their activity reported as ED50 (mg kg−1) was converted to ED50 (mol kg−1) and later to Log 1/ED50 in other to reduce the skewness in the data (Tropsha, 2010). The result is presented in Table 1 as pED50 with the names of the compounds
No.
Name
Exp. pED50
Pred. pED50
Residual
1
2-((4-((2-fluorobenzyl)oxy)benzyl)amino)-2-methylpropanamide
5.009
4.992
0.017
2
2-((4-(benzylthio)benzyl)amino)-2-methylpropanamide
5.003
5.003
0.000
3
N-benzyl-3-((2-chlorophenyl)amino)propanamide
4.949
4.904
0.045
4a
2-((4-((3-chlorobenzyl)oxy)benzyl)amino)-2-methylpropanamide
4.933
4.738
0.195
5
2-((4-((3-fluorobenzyl)oxy)benzyl)amino)-N,2-dimethylpropanamide
4.882
4.689
0.193
6
2-((4-((3-fluorobenzyl)oxy)benzyl)amino)-2-methylpropanamide
4.857
4.698
0.159
7a
(R)-2-acetamido-N-benzyl-3-hydroxypropanamide
4.720
4.615
0.105
8
3-((2-chlorophenyl)amino)propanamide
4.592
4.329
0.263
9
(S)-N-(2,6-dimethylphenyl)piperidine-2-carboxamide
4.603
4.559
0.044
10a
2-((4-((4-fluorobenzyl)oxy)benzyl)amino)-2-methylpropanamide
4.682
4.467
0.215
11
(S)-2-((4-((2-fluorobenzyl)oxy)benzyl)amino)propanamide
4.628
4.439
0.189
12
(R)-2-acetamido-N-benzyl-3-ethoxypropanamide
4.525
4.519
0.006
13
(S)-2-acetamido-N-benzyl-2-(pyrimidin-2-yl)acetamide
4.546
4.548
−0.002
14
(S)-2-((4-((3-fluorobenzyl)oxy)benzyl)amino)propanamide
4.567
4.459
0.108
15
(R)-N-(2,6-dimethylphenyl)piperidine-3-carboxamide
4.447
4.435
0.012
16
(S)-2-acetamido-N-benzyl-3-methoxypropanamide
4.479
4.569
−0.090
17
N-(2,6-dimethylphenyl)isonicotinamide
4.368
4.167
0.201
18
(S)-2-((4-((3-fluorobenzyl)oxy)benzyl)amino)-N-methylpropanamide
4.529
4.328
0.201
19
(S)-2-((4-((3-chlorobenzyl)oxy)benzyl)amino)propanamide
4.530
4.576
−0.046
20a
(S)-2-acetamido-N-benzyl-2-(furan-2-yl)acetamide
4.423
4.379
0.044
21a
3-((3-methoxyphenyl)amino)propanamide
4.275
4.051
0.224
22
(S)-2-acetamido-N-benzyl-2-(pyridin-2-yl)acetamide
4.428
4.290
0.138
23
(R)-2-acetamido-N-benzyl-2-(thiazol-5-yl)acetamide
4.383
4.362
0.021
24a
(S)-2-acetamido-N-(4-fluorobenzyl)-2-(furan-2-yl)acetamide
4.360
4.345
0.015
25a
(S)-2-((4-(benzylthio)benzyl)amino)propanamide
4.373
4.519
−0.146
26a
N-benzyl-3-((2-methoxyphenyl)amino)propanamide
4.333
4.295
0.038
27
3-(p-tolylamino)propanamide
4.093
4.145
−0.052
28
(S)-2-acetamido-N-benzyl-2-(pyrazin-2-yl)acetamide
4.284
4.439
−0.155
29
3-(phenylamino)propanamide
4.034
3.937
0.097
30
(S)-2-acetamido-N-benzyl-2-(1H-pyrrol-2-yl)acetamide
4.228
4.355
−0.127
31
(S)-2-((4-((4-fluorobenzyl)oxy)benzyl)amino)propanamide
4.268
4.501
−0.233
32
(S)-2-acetamido-N-benzyl-2-(1H-pyrazol-1-yl)acetamide
4.218
4.311
−0.093
33
N-benzyl-3-(phenylamino)propanamide
4.167
4.146
0.021
34a
(R)-2-acetamido-N-benzyl-3-(prop-2-yn-1-yloxy)propanamide
4.234
4.198
0.036
35
N-benzyl-3-(o-tolylamino)propanamide
4.173
4.330
−0.157
36a
(S)-2-acetamido-N-benzyl-2-(furan-2-yl)acetamide
4.171
4.186
−0.015
37
(S)-2-acetamido-N-benzyl-2-(5-methylfuran-2-yl)acetamide
4.174
4.224
−0.050
38
(S)-N-((R)-1-(3-chlorophenyl)ethyl)piperidine-2-carboxamide
4.125
4.095
0.030
39a
(S)-2-acetamido-N-benzyl-2-phenylacetamide
4.144
4.297
−0.153
40
(S)-N-((R)-2-methyl-1-phenylpropyl)piperidine-2-carboxamide
4.073
4.239
−0.166
41
(S)-N-((R)-1-phenylpentyl)piperidine-2-carboxamide
4.096
4.055
0.041
42
(S)-2-acetamido-N-benzyl-3-isopropoxypropanamide
4.083
4.235
−0.152
43
N-benzyl-3-((3-methoxyphenyl)amino)propanamide
4.085
4.260
−0.175
44
N-(2-benzoylbenzofuran-3-yl)-3-(dipropylamino)propanamide
4.225
4.281
−0.056
45
(S)-2-acetamido-N-(2,5-difluorobenzyl)-2-(furan-2-yl)acetamide
4.113
4.188
−0.075
46
(S)-N-(3-(trifluoromethyl)benzyl)piperidine-2-carboxamide
4.077
4.044
0.033
47
(S)-N-((R)-1-(3,4-dichlorophenyl)ethyl)piperidine-2-carboxamide
4.032
4.178
−0.146
48
(R)-2-acetamido-N-benzyl-2-(hydroxy(methyl)amino)acetamide
3.923
3.889
0.034
49
2-amino-N-(2,6-dimethylphenyl)acetamide
3.774
3.835
−0.061
50
3-((3-methoxyphenyl)amino)propanamide
3.805
4.019
−0.214
51
3-((3-chlorophenyl)amino)propanamide
3.811
3.991
−0.180
52
N-(2-benzoylbenzofuran-3-yl)-3-(4-methylpiperidin-1-yl)propanamide
4.092
4.185
−0.093
53
N-(2-benzoylbenzofuran-3-yl)-3-((2S,6R)-2,6-dimethylpiperidin-1-yl)propanamide
4.107
3.891
0.216
54
N-(2-benzoylbenzofuran-3-yl)-3-(4-(pyridin-2-yl)piperazin-1-yl)propanamide
4.158
4.325
−0.167
55
N-(2-benzoylbenzofuran-3-yl)-3-(cyclohexyl(methyl)amino)propanamide
4.107
4.091
0.016
56
3-((4-methoxyphenyl)amino)propanamide
3.770
3.930
−0.160
57
(S)-2-acetamido-N-benzylpent-4-enamide
3.866
3.854
0.012
58
N-(2,6-dimethylphenyl)cyclobutanecarboxamide
3.764
3.921
−0.157
59
N-(2-benzoylbenzofuran-3-yl)-3-(piperidin-1-yl)propanamide
4.013
4.036
−0.023
60
(S)-2-acetamido-N-(2-fluorobenzyl)-2-(furan-2-yl)acetamide
3.861
3.968
−0.107
61a
(S)-N-(4-(trifluoromethyl)benzyl)piperidine-2-carboxamide
3.834
3.947
−0.113
62
3-((4-chlorophenyl)amino)propanamide
3.672
3.716
−0.044
63
(R)-2-acetamido-N-benzyl-2-(ethylamino)acetamide
3.770
3.773
−0.003
64
(S)-2-acetamido-N-benzyl-2-(1-phenylhydrazinyl)acetamide
3.864
3.919
−0.055
65
(R)-1-amino-N-(1-phenylethyl)cyclopentanecarboxamide
3.733
3.884
−0.151
66a
(R)-2-acetamido-N-benzyl-2-(thiophen-2-yl)acetamide
3.809
3.945
−0.136
67
(R)-2-acetamido-N-benzyl-2-(dimethylamino)acetamide
3.741
3.971
−0.230
68
(R)-2-acetamido-N-benzyl-3-(2-cyclopropylethoxy)propanamide
3.821
4.006
−0.185
69a
(R)-N-((S)-1-phenylethyl)piperidine-2-carboxamide
3.694
3.513
0.181
70
N-(2-benzoylbenzofuran-3-yl)-3-(4-ethylpiperazin-1-yl)propanamide
3.898
3.929
−0.031
71
(R)-2-acetamido-N-benzyl-2-((R)-tetrahydrofuran-2-yl)acetamide
3.728
3.942
−0.214
72
N-(2,6-dimethylphenyl)cyclopent-3-enecarboxamide
3.593
3.706
−0.113
73a
N-(2-benzoylbenzofuran-3-yl)-3-(4-methylpiperazin-1-yl)propanamide
3.839
3.870
−0.031
74
(S)-N-(1-(3-chlorophenyl)ethyl)cyclopentanecarboxamide
3.630
3.479
0.151
75a
N-cyclohexyl-2-propylpentanamide
3.568
3.497
0.071
76
(S)-2-acetamido-N-benzyl-2-ethoxyacetamide
3.607
3.809
−0.202
77
N-(2,6-dimethylphenyl)cyclopentanecarboxamide
3.545
3.353
0.192
78
(R)-2-acetamido-N-(2,6-difluorobenzyl)-2-(furan-2-yl)acetamide
3.690
3.582
0.108
79a
(S)-2-acetamido-N-benzyl-3-(benzyloxy)propanamide
3.708
3.839
−0.131
80
N-(2-benzoylbenzofuran-3-yl)-2-morpholinoacetamide
3.747
3.662
0.085
81
(S)-N-(1-phenylethyl)cyclohexanecarboxamide
3.483
3.316
0.167
82
(S)-2-acetamido-N-benzylpropanamide
3.460
3.604
−0.144
83
(S)-2-acetamido-N-(3-fluorobenzyl)propanamide
3.489
3.389
0.100
84a
N-(2-benzoylbenzofuran-3-yl)-3-(4-(furan-2-ylmethyl)piperazin-1-yl)propanamide
3.768
3.885
−0.117
85
N-(2-chloro-6-methylphenyl)cyclohexanecarboxamide
3.472
3.503
−0.031
86
N-ethyl-2-propylpentanamide
2.933
3.084
−0.151
87
N,N-dimethyl-2-propylpentanamide
2.693
2.944
0.019
88
N-isopropyl-2-propylpentanamide
2.684
2.825
−0.141
89
N-butyl-2-propylpentanamide
2.610
2.846
−0.236
90
3,3-diphenylpyrrolidine-2,5-dione
2.728
2.561
0.167
2.2 Molecular structure optimization and descriptor calculation
Molecular structures of the dataset were drawn and optimized with Spartan 14 (Shao et al., 2006) DFT B3LYP/6-31G∗∗ quantum mechanical method was used i.e. Becke's (3) exchange functional (B3) (Becke, 1993) joined with Lee-Yang-Parr correlation functional (LYP) (Lee et al., 1988) with 6-31G∗∗ basis set (Schäfer et al., 1994). This method has been reported to give better information on electronic properties (Choudhary and Sharma, 2014). Various molecular properties were obtained and calculated from the optimized structure including atomic charges, frontier orbital energy; Ionization energy; est. as described in Gázquez (1993) and Karelson et al., 1996.
2.3 Dataset pretreatment
In the dataset matrix, all descriptor columns containing a constant value were discarded. In a pair of descriptors with a correlation coefficient greater than 0.8, one was discarded whose correlation coefficient with the activity value is lesser. The pretreatment was done to reduce redundancy and aid in the selection of optimal descriptors (Tropsha, 2010).
2.4 Dataset division and descriptors transformation
Kennard-Stone algorithm (KS) available in DatasetDIvision 1.2 (Ambure et al., 2015) was used to divide the dataset into training and test set. KS has been reported to produce excellent data division (Arthur et al., 2016). Descriptors unit of measurement were different and modeling process tends to favors descriptors in the higher unit. To eliminate these biases, they were transformed into the same unit via auto-scaling (Tropsha, 2010):
2.5 Selection of optimal descriptor and multi-co-linearity analysis
Genetic function algorithm (GFA) available in Material Studio 8.0 was used to select the best combinations of descriptors that better explain the variation in the activity values of the studied compounds. The method has the advantage of producing more than one combination of descriptors that can be used to build a model. It gives the user control over the equation length and uses fitness lack-of-fit (LOF) function to forbid over-fitting and reduce redundancy (Arthur et al., 2016) in a model.
The presence of high degree of correlation among the descriptors contained in the best descriptors blend reported by GFA was evaluated with variance inflation factor (VIF) value for each descriptor:
2.6 QSAR model and validation
The descriptors that constitute the best blend reported by the GFA were selected into a separate spreadsheet for both training and test sets. Then, training and test set data matrices were imported into the MLRplusValidation1.3 (Ambure et al., 2015) software to calculate various internal and external validation parameters.
2.7 Models applicability domain
The extent of extrapolation approach based on compounds leverage (hi) values and standardized residual (SDR) produced by the model was used to define the applicability domain (AD) of the QSAR model (Netzeva et al., 2005). Compounds hi are obtained as the diagonal element of hat matrix H:
3 Result and discussion
3.1 Dataset structure
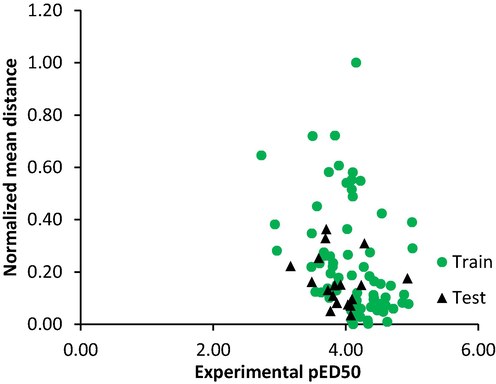
72 training set and 18 test set compounds were reported by the dataset division technique used in the study. The test compounds are marked with the letter a superscript in Table 1. Descriptive statistics performed on the two set showed that showed that the test set maximum was less than the training set maximum; the test set minimum was greater than the training set minimum (Table 2). In addition, other parameters reported in the table were similar for both sets. This indicated that the KS algorithm method used study successfully obtain the test set data within the activity range of the training set. Dissimilarity analysis depicted in Fig. 1. showed that the test set compounds descriptor spaces were within the training set descriptors space.
Parameters
Training
Test
Mean
4.109
3.907
Standard Deviation
0.464
0.374
Sample Variance
0.215
0.140
Range
2.281
1.764
Minimum
2.728
3.169
Maximum
5.009
4.933
Diversity analysis of database compounds.
3.2 QSAR model and quality
The model reported in the study is presented below:
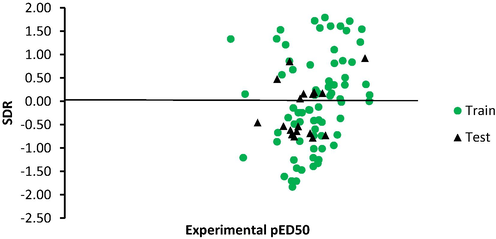
Distribution of residual around line SDR equal zero.
The plot of predicted versus experimental activity by the model (Fig. 3) showed that a linear relationship existed between the two variable and the model had good internal prediction ability. The multi-co-linearity analysis result the highest VIF value for descriptors in the model was 5.097, indicating the model was acceptable and void of the multi-co-linearity problem (Beheshti et al., 2016) (Table 3).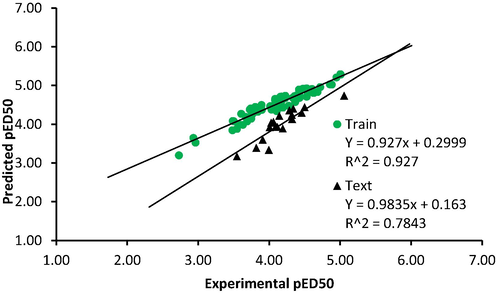
Predicted versus experimental activity value.
dx
Δ∊
Ω
Ф2
β2
TE
QH
QN
VIF
dx
1
1.3066
Δ∊
0.1069
1
5.0971
Ω
0.0484
−0.753
1
3.9656
Ф2
0.0979
−0.579
0.4437
1
1.9536
β2
−0.148
−0.774
0.7170
0.5734
1
3.3930
TE
−0.281
−0.623
0.6297
0.3902
0.6728
1
3.0683
QH
−0.010
0.0712
0.2013
0.1379
0.0181
0.3597
1
1.7048
QN
−0.072
−0.234
−0.109
0.2134
−0.003
0.1134
−0.128
1
1.4756
3.3 Model validation parameters
Detailed of the validation parameters computed for the model are the presented in Table 4. The result showed that values for R2; R2adj; Q2; R2pred; and r2 are greater than 0.6. Therefore, the model had excellent internal and external prediction ability and it is not a product of chance correlation (Tropsha, 2010). The model also passed all Golbraikh and Tropsha (2002) criteria for a predictive model. Y is the observed activity value for training set,
, the average of the observed activity for training set
, Predicted activity for training set,
leave one out cross-validation predicted activity for training,
observed activity for the test set, and
predicted activity for the test set.
Parameter
Formula
Threshold
Model score
Comment
Ref.
Internal validation
0.927
Passed
(Tropsha, 2010)
0.917
Passed
0.903
Passed
100.0
Passed
Random model
An average of the correlation coefficient for randomized data
0.342
Passed
(Tropsha, 2010)
An average of determination coefficient for randomized data
0.124
Passed
An average of leave one out cross-validated determination coefficient for randomized data
−0.154
Passed
c
c
0.866
Passed
(Roy, 2007)
External validation
0.740
Passed
Coefficient of determination for the plot of predicted versus observed for test set
0.784
Passed
(Golbraikh and Tropsha, 2002)
at zero intercept
0.745
Passed
for the plot of observed versus predicted activity for the test set at zero intercept
0.630
Passed
0.037
Passed
Slope of the plot of predicted versus observed activity for test set at zero intercept
0.973
Passed
0.049
Passed
Slope of the plot of observed versus predicted activity at zero intercept
1.024
Passed
0.002
Passed
3.4 Model applicability domain
The warning leverage for the model h∗ was 0.375. Therefore, the AD of the model is defined by a square area bounded by 0 < h < 0.375 and −3 < SDR < 3 as presented pictorially by the models Williams plot (Fig. 4). All the dataset compounds were within the AD of the model. Therefore the dataset was void of outliers.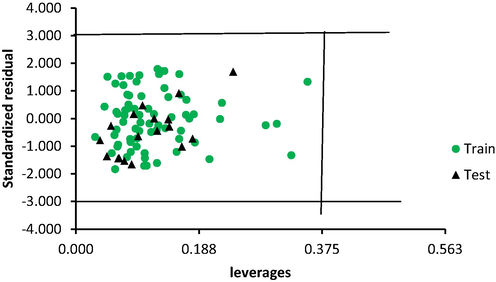
Williams plot for the model.
4 Interpretation of descriptors
Calculated descriptors for each molecule in the dataset are presented in Table 5. X-component of molecular dipole moment (dx) is the first descriptor in the model and is positively correlated with the activity of the studied compounds. It is an index of molecular polarity that explains the charge distribution in the molecule which an essential factor a molecule requires to bind to a biological receptor molecule (Cartier and Rivail, 1987). The value of dipole moment is a function of the differences in the electronegativity of connected atoms and distance between them. It has been reported that addition of bulky group and increase in the symmetry of a molecular system decrease the dipole moment (Singh, 2013).
No.
dx (debye)
Δ∊ (eV)
Ω (eV)
Ф2
β2
TE (au
)
QH (au)
QN (au)
pED50
1
3.719
4.620
1.365
2.556
10892.77
1074.267
0.746
1.093
5.009
2
4.594
5.440
1.883
2.748
8486.15
1014.457
0.865
1.065
5.003
3
−0.127
5.532
1.642
2.367
16151.68
1398.947
0.734
1.140
4.949
4
2.713
5.330
2.135
2.465
26402.09
595.791
0.850
0.965
4.933
5
−0.659
4.822
1.671
2.557
9912.29
2680.580
0.827
1.104
4.882
6
−0.754
4.868
1.671
2.498
17934.36
2672.035
0.798
1.091
4.857
7
−2.008
5.280
1.646
2.324
4564.25
1347.682
0.855
1.151
4.720
8
−0.162
5.559
1.610
1.877
6168.66
108.770
0.714
0.985
4.592
9
1.826
5.912
1.467
2.181
6881.74
2253.369
0.780
1.187
4.603
10
3.387
5.362
1.704
2.402
25956.42
1757.804
0.841
0.916
4.682
11
−1.274
5.170
1.818
2.372
21410.59
1988.498
0.806
0.919
4.628
12
−2.446
6.301
1.814
2.370
6346.93
3133.423
0.829
1.135
4.525
13
6.487
4.400
3.582
2.220
6436.07
1253.695
0.780
1.059
4.546
14
−2.765
5.422
1.716
2.372
25599.89
1997.042
0.809
0.919
4.567
15
0.560
5.852
1.573
2.016
8753.55
2176.471
0.756
1.179
4.447
16
−0.564
6.251
1.683
2.190
6525.20
1604.008
0.775
1.109
4.479
17
−1.688
4.858
3.276
1.932
15171.20
1604.008
0.646
0.831
4.368
18
−3.451
5.431
1.687
2.465
35226.36
3167.600
0.789
0.796
4.529
19
−3.014
5.138
1.932
2.434
22480.20
1390.403
0.811
0.920
4.530
20
−4.102
5.990
1.879
2.190
2068.50
2774.566
0.767
1.085
4.423
21
−4.398
5.339
0.905
1.932
9110.09
2296.090
0.771
1.016
4.275
22
−3.179
4.858
3.036
2.250
107.55
2227.736
0.784
0.960
4.428
23
1.778
5.568
2.682
2.250
5099.06
1424.580
0.761
0.879
4.383
24
4.310
5.541
2.225
2.220
5188.19
672.689
0.768
0.838
4.360
25
4.358
5.408
1.862
2.402
10268.83
946.104
0.832
0.922
4.373
26
−0.836
4.932
1.561
2.310
6079.53
1791.981
0.776
0.872
4.333
27
−2.552
5.399
1.031
1.904
11160.17
1672.362
0.745
1.007
4.093
28
4.192
4.661
3.912
2.250
5901.26
2159.382
0.789
1.036
4.284
29
−2.682
5.509
1.076
1.796
8753.56
2851.464
0.711
1.007
4.034
30
−3.830
5.642
1.769
2.220
1711.96
1672.362
0.818
1.019
4.228
31
2.997
5.339
1.695
2.372
21945.39
1561.287
0.806
0.920
4.268
32
−2.067
6.228
1.972
2.250
1266.29
1689.450
0.785
0.904
4.218
33
2.181
4.849
1.691
2.190
6079.53
2860.008
0.730
0.895
4.167
34
−5.309
5.939
1.981
2.372
4475.12
1663.818
0.858
0.810
4.234
35
−0.564
5.362
1.646
2.250
1355.43
783.764
0.775
0.855
4.173
36
−4.185
5.880
1.907
2.220
4564.25
1920.144
0.780
0.850
4.171
37
3.790
5.660
1.822
2.310
4564.25
1791.981
0.814
0.843
4.174
38
2.299
6.132
1.924
2.132
1266.29
1979.954
0.764
0.838
4.125
39
4.571
5.651
2.135
2.250
820.62
920.471
0.771
0.819
4.144
40
0.027
5.962
1.581
2.161
1979.36
561.614
0.786
0.830
4.073
41
0.761
6.260
1.626
2.372
374.95
1689.450
0.866
0.724
4.096
42
−1.381
6.329
1.789
2.402
4296.85
2219.192
0.863
0.862
4.083
43
−0.907
4.808
1.659
2.341
7951.35
2757.477
0.769
0.896
4.085
44
−1.546
3.480
4.328
2.689
43426.70
5705.232
0.851
0.870
4.225
45
−2.114
5.449
2.343
2.280
3227.24
2296.090
0.777
0.843
4.113
46
−1.286
5.362
2.274
2.161
5455.59
2202.103
0.716
0.740
4.077
47
−2.315
5.490
2.148
2.190
6346.93
518.893
0.738
0.687
4.032
48
4.216
5.541
2.050
2.161
6168.66
2860.008
0.877
0.876
3.923
49
−1.369
6.022
1.691
1.822
4920.79
3321.396
0.746
0.981
3.774
50
−4.291
5.568
0.905
1.932
9199.22
2817.287
0.752
1.009
3.805
51
−4.445
5.449
1.414
1.877
10090.56
3124.879
0.719
1.009
3.811
52
−2.020
3.411
4.356
2.528
43515.83
5679.599
0.697
0.734
4.092
53
−0.564
3.581
4.206
2.528
32374.07
6918.511
0.857
0.860
4.107
54
−1.961
3.150
4.548
2.689
85319.70
8652.987
0.840
1.012
4.158
55
−−0.813
3.370
4.434
2.592
48596.47
6516.933
0.847
0.854
4.107
56
−0.209
6.191
1.671
2.250
8040.48
1595.464
0.861
0.686
3.770
57
−4.386
5.779
2.034
2.220
2781.57
2458.430
0.834
0.723
3.866
58
2.737
6.040
1.891
1.932
1801.11
1228.063
0.686
0.702
3.764
59
−1.333
3.640
4.352
2.465
51003.09
6739.082
0.795
0.855
4.013
60
3.731
5.678
2.034
2.220
3138.11
2125.205
0.779
0.710
3.861
61
−3.262
5.852
2.323
2.065
4831.65
1082.811
0.738
0.655
3.834
62
−5.238
5.271
1.418
1.877
13745.06
2518.239
0.719
0.742
3.672
63
−1.913
5.042
1.031
1.903
12764.58
3141.967
0.749
0.874
3.770
64
1.400
5.289
1.606
2.402
1533.69
4910.620
0.905
0.965
3.864
65
−1.878
6.219
1.606
1.932
2157.63
2287.546
0.811
0.923
3.733
66
−4.741
5.518
2.168
2.190
5901.26
3637.532
0.764
0.831
3.809
67
2.926
6.081
1.936
2.190
6436.07
1270.784
0.806
0.669
3.741
68
−2.268
6.361
1.765
2.496
7416.54
2535.328
1.059
0.874
3.821
69
0.583
6.058
1.536
2.045
10625.37
954.648
0.746
0.333
3.694
70
−1.617
3.571
4.360
2.592
55548.93
6585.286
0.832
0.692
3.898
71
−2.670
6.191
1.797
2.250
3138.11
578.702
0.821
0.569
3.728
72
−0.056
5.999
1.655
1.960
7862.21
1569.831
0.682
0.531
3.593
73
−1.416
3.571
4.882
2.528
53944.51
4825.178
1.087
0.843
3.839
74
−1.890
5.962
2.514
2.103
731.49
2449.886
0.948
0.665
3.630
75
3.044
7.190
1.272
2.220
1177.16
3338.484
1.100
0.839
3.568
76
2.181
6.242
2.315
2.250
6525.20
1757.804
1.038
0.816
3.607
77
−0.363
5.971
1.919
1.960
7951.35
3329.940
0.911
0.703
3.545
78
−5.344
5.092
2.934
2.190
998.89
5243.844
0.926
0.919
3.690
79
3.352
5.930
2.315
2.496
2425.03
2646.403
1.076
0.798
3.708
80
−1.688
3.672
4.980
2.341
42535.36
5209.668
0.993
0.791
3.747
81
−3.286
5.971
2.152
1.960
464.09
3261.586
0.990
0.788
3.483
82
1.790
6.049
2.172
2.045
5099.06
2868.552
0.934
0.811
3.460
83
−0.103
5.980
2.478
2.132
464.09
4765.368
0.965
0.807
3.489
84
1.530
3.599
4.947
2.756
48596.47
5884.661
1.137
0.851
3.768
85
−0.754
5.912
2.250
1.989
9199.22
1774.893
0.958
0.698
3.472
86
−0.517
7.208
1.227
2.016
196.68
2697.668
1.039
0.562
2.933
87
−1.748
5.802
2.245
2.103
4920.79
2791.654
1.040
0.404
2.963
88
0.063
7.139
1.243
2.103
285.82
2714.756
1.032
0.294
2.684
89
0.986
7.171
1.642
2.190
642.35
2962.539
1.068
0.298
2.610
90
1.317
7.730
1.826
1.822
285.82
1407.491
0.894
0.000
2.728
Higher dipole moment observed for molecules 1, 2, 3 and others may be attributed to the addition of bulky electron loving groups like 1-fluoro-2-(methoxymethyl)benzene; benzyl(methyl)sulfane est. to the parent2-amino-N-benzylacetamide. On the other hand, reduced dipole moment observed for molecules 86–89 may be due to increase in the symmetry of the parent molecule (Table 5). The observed dipole was proportional activity value.
The energy difference between the ∊HOMO and ∊LUMO termed energy gap (Δ∊) (Parthasarathi et al., 2004) is contained in the model and positively correlated to the activity value. It explains charge transfer interaction within the molecule in which a portion of the molecule with higher HOMO donate electrons to that portion with higher LUMO. This is a reflection of the chemical activity of the molecule (Parthasarathi et al., 2004). Addition of larger substituent to a molecular system induces a decrease in Δ∊ value. Localization of HOMO and LUMO at the same site reduces the reactivity of the molecule (Galeazzi et al., 2002). Lower value of Δ∊ was observed for molecule 1, 2, and others with larger substituent added to the parent and higher value of Δ∊ was observed for molecules 86–89. However, lower activity value observed for molecules 86–89 may be due localization of their HOMO and LUMO at the same sites (Fig. 5).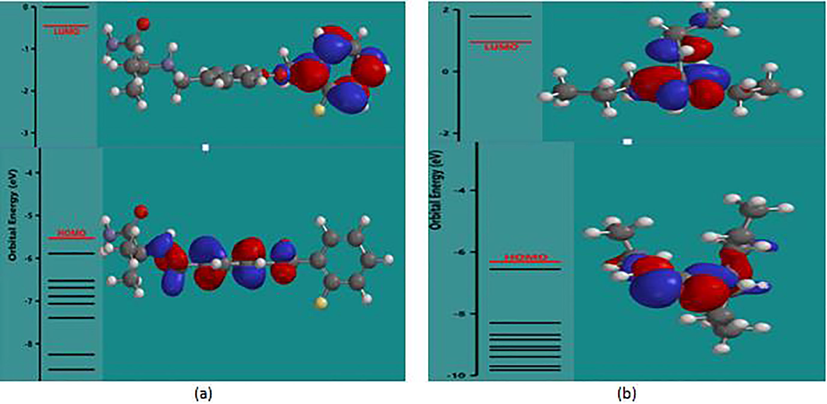
(a) HOMO-LUMO energy diagram of molecule 1, (b) HOMO-LUMO energy diagram of molecule 88.
Electrophilicity index (Ω): the ratio of one half of the square chemical potential to chemical hardness. It is a measure of energy lowering due to maximal electron flow between a donor and acceptor (Parr et al., 1999). It is used to quantitatively classify a molecule as global electrophile within a relative scale (Parthasarathi et al., 2004). A molecule with higher electrophilicity index will act as an electrophile in a reaction, while, those with lower electrophicity index will act as a nucleophile (Chattaraj et al., 2003). A higher value of (Ω) was observed for molecule 1 and other with larger substituent added to the parent (Table 5). Hence, they have a tendency to act as a nucleophile. Lower value of (Ω) was observed for molecules 86–89. Thus, have a tendency to act as the electrophile in a bimolecular reaction. Interaction of molecule 1 and 88 with γ-aminobutyrate aminotransferase (a known target for anticonvulsant) (Fig. 6), showed that the added substituent contributed to the increased activity value observed in molecule 1.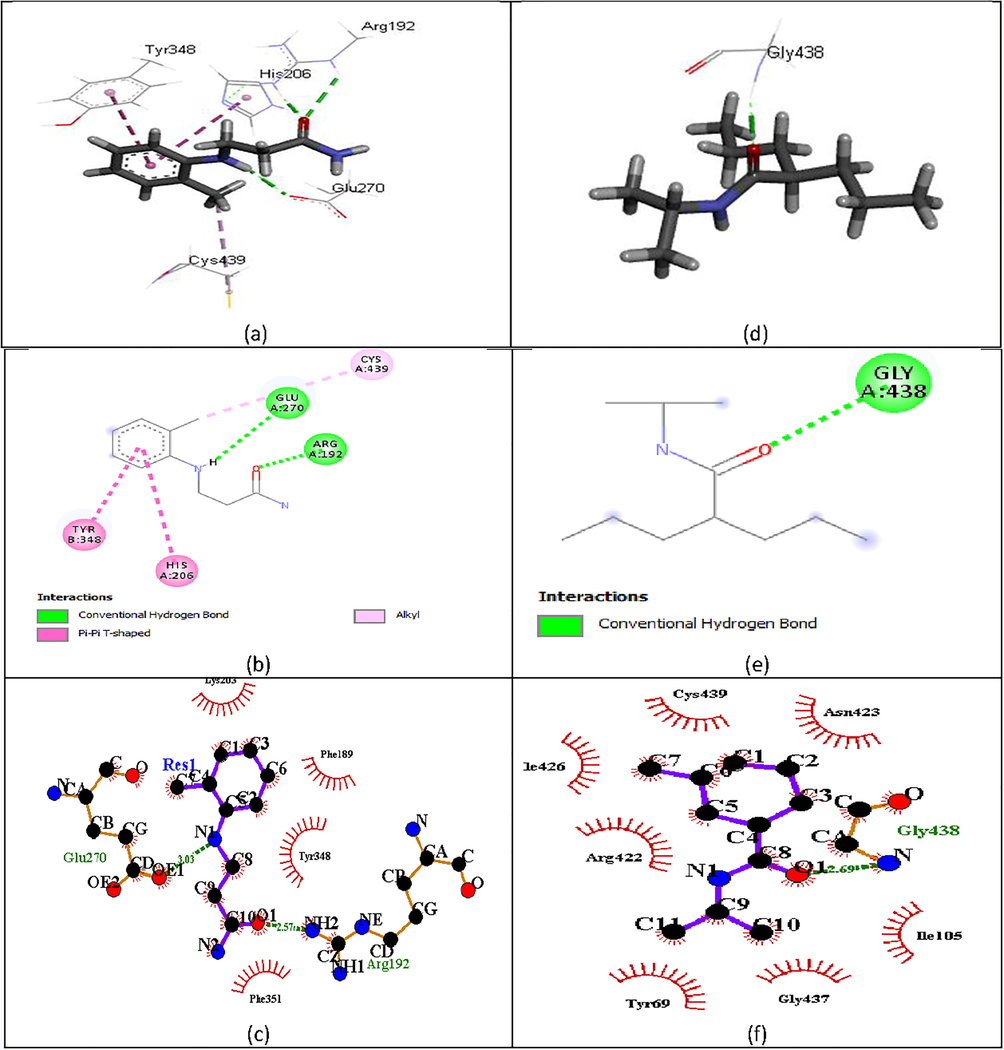
(a).
Other descriptors in the model include square of molecular ovality (ф2) which is a descriptor quantifying the van der Waals molecular shape of the molecules (Olariu et al., 2013). It is positively correlated to the activity of studied compounds. Higher value ф2 was observed for molecule 1 and its counterpart. This was in tandem with the activity values of the compound. Anisotropy of the polarizability of a molecule (β2) is another descriptor in the model obtained as the summation of the diagonal element of the polarizability matrix. It’s related to molar volume, hydrophobicity and characterizes the properties of a molecule to accept electron (Karelson et al., 1996). A higher value of β2 was observed for molecule 1 and its counterpart.
Topological electronic index (TE) was obtained from the charges on all atoms that made up a molecule (karelson et al., 1996) and it's negatively correlated to the activity of studied compounds. The square root of the sum of the square of charges on all hydrogen atoms (QH) is yet another descriptor in the model and it’s negatively correlated with the activity of the studied compounds. The final descriptor in the model is QN i.e. the square root of the sum of the square of charges on all nitrogen atoms in a molecule. It’s positively correlated with the activity of studied compounds. This indicated addition of nitrogen-containing substituent increases the activity values of the studied compounds. A molecule with additional N-atom in their system had a high value of QN e.g. molecule, 11, 18 and 20 (Table 1).
5 Conclusion
Quantum mechanics derived descriptors was used to conduct quantitative structure-activity relationships study on some 2-amino-N-benzylacetamide derivatives. The result showed dx; Δ∊; Ω; Ф2; β2; TE; QH and QN molecular descriptors to influence the anticonvulsant activity of the studied compounds. These descriptors showed that increasing the bulkiness of the molecule and addition of nitrogen-containing substituent electronegative element in the molecular system enhances the anticonvulsant activity of the studied compounds. The model produced in the study had good performance in term of it validation parameters and can be used to screen compounds for anticonvulsant activity in MES test.
References
- “NanoBRIDGES” software: open access tools to perform QSAR and nano-QSAR modeling. Chemom. Intell. Lab. Syst.. 2015;147:1-13.
- [Google Scholar]
- Insilco study on the toxicity of anti-cancer compounds tested against MOLT-4 and p388 cell lines using GA-MLR technique. Beni-Suef Univ. J. Basic Appl. Sci.. 2016;5:320-333.
- [Google Scholar]
- Density-functional thermochemistry. III. The role of exact exchange. J. Chem. Phys.. 1993;98:5648-5652.
- [Google Scholar]
- QSAR modeling of antimalarial activity of urea derivatives using genetic algorithm–multiple linear regressions. J. Saudi Chem. Soc.. 2016;20:282-290.
- [Google Scholar]
- Electronic descriptors in quantitative structure—activity relationships. Chemom. Intell. Lab. Syst.. 1987;1:335-347.
- [Google Scholar]
- Philicity: a unified treatment of chemical reactivity and selectivity. J. Phys. Chem. A. 2003;107:4973-4975.
- [Google Scholar]
- QSAR rationales for the 5-HT6 antagonistic activity of Epiminocyclohepta [b] indoles. Pharma Chem.. 2014;6:321-330.
- [Google Scholar]
- A new computer program for QSAR-analysis: ARTE-QSAR. J. Comput. Chem.. 2007;28:1924-1928.
- [Google Scholar]
- A stepwise approach for defining the applicability domain of SAR and QSAR models. J. Chem. Inf. Model.. 2005;45:839-849.
- [Google Scholar]
- Molecular structure and stereoelectronic properties of herbicide sulphonylureas. Bioorg. Med. Chem.. 2002;10:1019-1024.
- [Google Scholar]
- Gázquez, J.L., 1993. Hardness and softness in density functional theory. In: Chemical Hardness. Springer, pp. 27–43.
- Synthesis and anticonvulsant activity of a class of 2-amino 3-hydroxypropanamide and 2-aminoacetamide derivatives. Bioorg. Med. Chem.. 2006;14:3263-3274.
- [Google Scholar]
- King, A.M., 2011. Synthesis and pharmacological evaluation of primary amino acid derivatives (PAADs): Novel neurological agents for the treatment of epilepsy and neuropathic pain (Ph.D. thesis). The University of North Carolina at Chapel Hill.
- Development of the Colle-Salvetti correlation-energy formula into a functional of the electron density. Phys. Rev. B. 1988;37:785.
- [Google Scholar]
- Current status of methods for defining the applicability domain of (quantitative) structure-activity relationships. ATLA. 2005;33:155-173.
- [Google Scholar]
- Quantitative structure-activity relationship (QSAR). VI. Modeling the toxicity of aliphatic esters by means of molecular ovality descriptors. Farmacia. 2013;61:670-684.
- [Google Scholar]
- Electrophilicity index as a possible descriptor of biological activity. Bioorg. Med. Chem.. 2004;12:5533-5543.
- [Google Scholar]
- On some aspects of validation of predictive quantitative structure–activity relationship models. Expert Opin. Drug Discov.. 2007;2:1567-1577.
- [Google Scholar]
- Fully optimized contracted Gaussian basis sets of triple zeta valence quality for atoms Li to Kr. J. Chem. Phys.. 1994;100:5829-5835.
- [Google Scholar]
- Advances in methods and algorithms in a modern quantum chemistry program package. Phys. Chem. Chem. Phys.. 2006;8:3172-3191.
- [Google Scholar]
- Quantitative structure-activity relationship study of substituted-[1, 2, 4] oxadiazoles as S1P1 agonists. J. Curr. Chem. Pharm. Sci. 2013:64-67.
- [Google Scholar]
- Relationship between antifungal activity against Candida albicans and electron parameters of selected N-heterocyclic thioamides. Indian J. Pharm. Sci.. 2014;76:287.
- [Google Scholar]
- Epilepsy: a review of selected clinical syndromes and advances in basic science. J. Cereb. Blood Flow Metab.. 2006;26:983-1004.
- [Google Scholar]
- Best practices for QSAR model development, validation, and exploitation. Mol. Inform.. 2010;29:476-488.
- [Google Scholar]


