

Translate this page into:
Quantitative structure–activity relationship and molecular docking of 4-Alkoxy-Cinnamic analogues as anti-mycobacterium tuberculosis
⁎Corresponding author. shola4343@gmail.com (Shola Elijah Adeniji)
-
Received: ,
Accepted: ,
This article was originally published by Elsevier and was migrated to Scientific Scholar after the change of Publisher.
Peer review under responsibility of King Saud University.
Abstract
Quantitative structure–activity relationship (QSAR) and molecular docking studies were carried out on 4-Alkoxy-Cinnamic derivatives as potent anti-mycobacterium tuberculosis. Chemical structures of the molecules were optimized by employing Density Functional Theory and utilizing (B3LYP) with the 6-31G∗ basis set. Four models were generated by Genetic Function Approximation (GFA). Model one was selected as the optimum model based on validation parameters which were found to be significant with correlation coefficient (R2) of 0.980921, adjusted correlation coefficient (R2 adj) value of 0.97547 and Cross validation coefficient ( ) value of 0.965244. External validations were employed to validate the chosen model and the model was found to have (R2test) of 0.8756 and Coefficient of determination for Y-randomization (c value of 0.867578. The Molecular docking studies showed that the ligand 1,2,3,4,5 and 6 with better activities have higher bind affinities ranging from (−6.4 and −10.4 kcal/mol) which formed H-bonds and hydrophobic interactions with amino acid residues of mycobacterum tuberculosis (M. tuberculosis) DNA gyrase receptor. This research has shown that the binding affinities of these inhibitors were found to be better than the commercially sold anti-mycobacterium tuberculosis; enthambutol (−5.8 kcal/mol) and isoniazid (−5.3 kcal/mol). QSAR model generated and molecular docking results propose the direction for the design of new anti-tubercular agents with better activities against DNA gyrase.
Keywords
Anti-tuberculosis
Binding affinity
Molecular docking
QSAR
Y-radomization

1 Introduction
Tuberculosis is one the major challenge in the world caused by bacterium tuberculosis. The overall rate is increasing by 0.4% per year. It is estimated that one-third of world population is infected by tuberculosis, and 95% death occurs in developing countries (Brito et al., 2004). Some of the drugs currently used for the treatment of tuberculosis due to their effective anti-tuberculosis activities include: enthambutol, cycloserine, isoniazid, rifampicin and pyrazinamide (Tripathi et al., 2005). Multidrug resistant strains of M. tuberculosis are emergence to available drugs which demands the need for novel anti-tubercular agents with better activities.
Recently, a novel series of 4-Alkoxy-Cinnamic derivatives has been identified and reported as inhibitors of M. tuberculosis (da Silva Lourenço et al., 2008). Other medicinal benefits of this compound has been reported to be active against Aspergillus flavus, Candida albicans, Escherichia coli, Fusarium verticilioides, Klebsiella pneumonia, Listeria monocytogenes, Morganella morganni, Neisseria gonorrhoeae, Pasteurella multocida, Pediococcus pentosaceus and Penicillium brevicompactum (Guzman, 2014).
In this regard, DNA gyrase (DNAg) have been reported as a potential target to anti-tubercular agents particularly for the treatment of Multidrug resistant strains and tuberculosis in HIV infected patients(Nolan et al., 1999). This enzyme is primarily a prokaryotic receptor which has properties distinct from other type II topoisomerases. It catalyzes the catenation and de-catenation of DNA rings, relaxation of supercoiled DNA, knotting and unknotting of duplex DNA. (Huang et al., 2006).
The advancement of computational chemistry led to development of new drug (Cramer et al., 1988). Computational methods which reduced the cost for effective evaluation of large virtual data base of chemical compounds are currently employed in designing new drugs. Such method include Quantitative Structure–Activity Relationships (QSAR) models, Artificial Neural Networks (ANN) analysis, Complex Networks theory, and Machine Learning (ML) (Speck-Planche et al., 2010). QSAR has advantages over other computational technique because it can be broadly utilized for the prediction of physicochemical properties in the chemical, pharmaceutical, and environmental spheres (Wong et al., 2014). Moreover, the QSAR strategies can save resources and accelerate the process of developing new molecules for use as drugs, materials, and additives or for whatever purposes (Larif et al., 2013). QSAR establish a relationship between properties of various molecules and their biological activities. (Ibezim et al., 2009). QSAR modeling alongside with molecular docking approach were employed to predict the activities of various inhibitor compounds and elucidate the regions where interactive fields (steric, electrostatic, hydrophobic, hydrogen bond donor and hydrogen bond acceptor fields) may decrease or increase the activities.
The aim of this research was to generate QSAR model to predict the activity of 4-Alkoxy-Cinnamic derivatives as a potent anti-tubercular agent and to carry out molecular docking studies to elucidate the interaction between the inhibitor compounds and the target site of M. tuberculosis (DNA gyrase).
2 Materials and method
2.1 Data collection
Twenty-eight molecules of 4-Alkoxy-Cinnamic derivatives as potent anti-tubercular agents were searched from a reported article [8] and used in this study (De et al., 2011).
2.2 Biological activities (pMIC)
The biological activities of 4-Alkoxy-Cinnamic derivatives against M. tuberculosis measured in minimum inhibitory concentration (MIC) were converted to logarithm sclae (pMIC = −logMIC) in order to have a linear activities values and approach normal distribution. The general and observed structures of the molecules with their biological activities were presented in Fig. 1 and Table 1 respectively.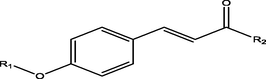
General structure of 4-Alkoxy-Cinnamic.
Molecule
R1
R2
MIC (μM)
pMIC
1
methyl
N-acetylcysteamine
225
3.647817
2
isopentenyl
N-acetylcysteamine
48
4.318759
3
geranyl
N-acetylcysteamine
1.5
5.823909
4
methyl
N-acetylethylenediamine
1908
2.7194
5
isopentenyl
N-acetylethylenediamine
18
4.744727
6
geranyl
N-acetylethylenediamine
0.24
6.619789
7
methy
2-aminopyridine
248
3.605548
8
isopentenyl
2-aminopyridine
52
4.283997
9
geranyl
2-aminopyridine
2.7
5.568636
10
methyl
D-cycloserine
950
3.022276
11
methyl
Isoniazid
0.3
6.522879
12
CF3
Isoniazid
1.1
5.958607
13
ethyl
Isoniazid
1.3
5.886057
14
CF3CH2
Isoniazid
2.2
5.657577
15
isopentenyl
Isoniazid
2.3
5.638272
16
geranyl
isoniazid
1.9
5.721246
17
Methyl
Hydralazine
50
4.30103
18
CF3
Hydralazine
21
4.677781
19
ethyl
Hydralazine
12
4.920819
20
CF3CH2
Hydralazine
20
4.69897
21
isopentenyl
Hydralazine
21
4.677781
22
geranyl
hydralazine
72
4.142668
23
Methy
Triazolophthalazine
53
4.275724
24
CF3
Triazolophthalazine
702
3.153663
25
ethyl
Triazolophthalazine
39
4.408935
26
CF3CH2
Triazolophthalazine
170
3.769551
27
isopentenyl
Triazolophthalazine
1.4
5.853872
28
geranyl
Triazolophthalazine
19
4.721246
2.3 Optimization
The structures of the molecules presented in the Table 1 were drawn using chemdraw software version 12.0.2 (Li et al., 2004). These compounds were exported to Spartan 14 Version 1.1.4 software for optimization by employing Density Functional Theory (DFT) and utilizing (B3LYP) with the 6-31G∗ basis set (Becke, 1993; Lee et al., 1988).
2.4 Molecular descriptor calculation
Molecular descriptors for all the twenty-eight (28) molecules of 4-Alkoxy-Cinnamic derivatives were calculated after optimization process utilizing the PaDEL-Descriptor software V2.20 (Yap, 2011). A total of 1875 molecular descriptors were calculated.
2.5 Normalization and data pretreatment
The calculated descriptors for all the molecules were normalized using Eq. (1) in order to give each variable the same opportunity at the onset to influence and develop a good model (Singh, 2013).
2.6 Data Division
The pretreated dataset was divided into training and test sets using Data Division software obtained from Drug Theoretical and Cheminformatics Laboratory (DTC Lab) by employing Kennard and Stone’s algorithm (Kennard and Stone, 1969). This algorithm has been recently used in many QSAR studies and has been reported as one of the best way to generate training and test sets (Afantitis et al., 2006; Chakraborti et al., 2003; Khaled, 2011; Melagraki et al., 2006; Wu et al., 1996).
2.7 Internal validation of model
Internal Validation of the model was carried out using Material studio software version 8 by employing the Genetic Function Approximation (GFA) method. The models generated were assessed using Friedman formula so that the best fitness score can be received. LOF is defined as; (Friedman, 1991).
The correlation coefficient (R2) is another parameter used to assess the model. The closer the value of R2 to 1.0, the better the model generated. R2 is expressed as:
R2 value varies directly with the increase in number of descriptors, thus, R2 is not reliable to measure the stability of the model. Therefore, R2 is adjusted in order to have a reliable and stable model. The adjusted R2 is defined as:
The strength of the QSAR model to predict the activity of a new compound was determined using cross validation test. The cross-validation coefficient (
) is defined as:
Yexp, and Ypred are the mean experimental activity, experimental activity and the predicted activity in the training set, respectively.
2.8 External validation of the model
External validation of the developed model was assessed by the value
value. The closer the value of
to 1.0, the better the stability the model generated. The
is defined by as;
2.9 Y-Randomization test
To be assured that the QSAR model developed is strong and not inferred by chance, the Y-randomization test was performed on the training set data (Tropsha et al., 2003). For the built QSAR model to robust and reliable, the model is expected to have a low R2 and Q2 values for several trials. Coefficient of determination
for Y-randomization is another parameter calculated which should be greater than 0.5 for passing this test.
2.10 Evaluation of the applicability domain of the model
Evaluation of applicability domain of the QSAR model is an important step in establishing that the model is good to make predictions within the chemical space for which it was built (Tropsha et al., 2003). The leverage approach was utilized in describing the applicability domain of the QSAR models (Veerasamy et al., 2011). Leverage of a given chemical compound hi, is defined as follows:
2.11 Docking studies
Molecular docking study was carried between 4-Alkoxy cinnamic derivatives and M. tuberculosis target site (DNA gyrase). The crystal structure of DNA gyrase used in the study was obtained from protein data bank. The optimized structure of the 4-Alkoxy cinnamic derivatives initially saved as SDF files were converted to PDB files using Spartan 14 Version 1.1.4. The prepared ligands were docked with prepared structure of DNA gyrase using Autodock Vina incorporated in Pyrx software. The docked results were visualized and analyzed using Discovery Studio Visualizer.
3 Results and discussion
QSAR was performed to investigate the structure activity relationship of the inhibitory compounds as potent anti-mycobacterium tuberculosis. The nature of models in a QSAR study is expressed by its fitting ability, stability, robustness, reliability and forecast capacity. Univariate analysis of the activity values of the training and test set compounds reported in Table 2 shows that test set values range (3.605548 to 6.619789) was within the training set values range (2.719422 to 6.522879). Also, the mean and standard deviation of the test set activity value (4.544215 and 1.038805) were approximately similar to that of the training set value (4.865454 and 1.059916). This indicates that the test set is interpolative within the training. Hence Kennard-Stone algorithm employed was able to generate a test set that is a good reflection of the training set.
Statistical parameters
Activity
Training set
Test set
Mean
4.865454
4.544215
Median
4.677781
4.275724
Standard deviation
1.059916
1.038805
Sample Variance
1.123421
1.079116
Kurtosis
−0.25206
0.792495
Skewness
−0.61956
1.301449
Range
3.803457
3.01424
Minimum
2.719422
3.605548
Maximum
6.522879
6.619789
Number of sample points
19
9
Experimental and predicted activities of 4-Alkoxy-Cinnamic derivatives as a potent anti-mycobacterium tuberculosis and the residual values were presented in Table 3. The low residual value between experimental and predicted activity indicates that the model has a high predictive power. Where superscript “a” represent the test set.
Molecule
Activity
Predicted
Residual
1a
3.647817
3.702978
−0.05516
2
4.318759
4.425178
−0.10642
3
5.823909
5.716316
0.107593
4
2.719422
2.799665
−0.08024
5
4.744727
4.624287
0.12044
6a
6.619789
6.595708
0.024081
7a
3.605548
4.343643
−0.73809
8a
4.283997
3.575186
0.70881
9
5.568636
5.731472
−0.16284
10
3.022276
2.822808
0.199468
11
6.522879
6.522959
-8E-05
12
5.958607
5.744235
0.214372
13
5.886057
5.746847
0.13921
14
5.657577
5.738721
−0.08114
15
5.638272
5.734626
−0.09635
16
5.721246
5.758554
−0.03731
17
4.30103
4.373353
−0.07232
18
4.677781
4.669732
0.008049
19
4.920819
4.919382
0.001437
20a
4.69897
4.621826
0.077144
21
4.677781
4.81549
−0.13771
22a
4.142668
4.201282
−0.05861
23a
4.275724
4.116862
0.158862
24
3.153663
3.393284
−0.23962
25
4.408935
4.089341
0.319594
26a
3.769551
3.867853
−0.0983
27a
5.853872
5.858399
−0.00453
28
4.721246
4.817373
−0.09613
The Genetic Function Algorithm (GFA) method employed in this study led to the selection of four descriptors which were used to build a linear model for predicting the activities of the anti-tubercular agent. Four QSAR models were built using GFA, but due to the statistical significance, model 1 was selected as the best model.
Model 1
Model 2
Model 3
Model 4
The descriptions of the descriptors in above models are as follows;
VPC-6 is valence path cluster, order 6, maxHdsCH is maximum atom-type H E-State: = CH–,
TDB9v is topological distance based autocorrelation – lag 9/weighted by van der Waals volumes, RDF50i is radial distribution function – 050/weighted by relative first ionization potential, GATS2v is Geary autocorrelation – lag 2/weighted by van der Waals volumes.
3.1 Quality assurance of the model
The stability, reliability and predictive ability of the developed models were evaluated by internal and external validation parameters. The validation parameters for both the internal and external test were compared with the minimum recommended value for a generally acceptable QSAR model (Veerasamy et al., 2011) shown in Table 4.
Symbol Value
Name
Value
R2
Coefficient of determination
≥0.6
P(95%)
Confidence interval at 95% confidence level
<0.05
Cross validation coefficient
<0.5
R2 -
Difference between R2 and
≤0.3
Next. test set
Minimum number of external test set
≥5
Coefficient of determination for Y-randomization
>0.5
All the validation parameter to confirm the stability and robustness of the model were reported in Table 5 which were all in agreement with validation parameters presented in Table 4.
S/NO
Model 1
Model 2
Model 3
Model 4
1
Friedman LOF
0.126
0.127
0.141
0.142
2
R-squared
0.981
0.981
0.979
0.979
3
Adjusted R-squared
0.975
0.975
0.973
0.973
4
Cross validated (R-squared (
0.965
0.954153
0.959
0.925
5
Significant Regression
Yes
Yes
Yes
Yes
6
Significance of regression F-value
179.9
178.7
161.2
160.8
7
Critical SOR F-value (95%)
3.160
3.160
3.160
3.160
8
Replicate points
0
0
0
0
9
Computed experimental error
0
0
0
0
10
Lack-of-fit points
14
14
14
14
11
Min expt. error for non-significant LOF (95%)
0.127
0.128
0.135
0.136
12
R2 test
0.876
0.832
0.784
0.712
Pearson’s correlation matrix and statistical analysis of the four descriptors in the QSAR Model were reported in Table 6 which shows clearly that there is no significant inter-correlation among the descriptors used in building QSAR model. The calculated Variance Inflation Factor (VIF) values for all the four descriptors in the model were all less than 4 which imply that the descriptors were orthogonal and model generated was significant. The null hypothesis says there is no significant relationship between the activities of the inhibitor molecules and the descriptors used in building the model at p > 0.05. The P-values of the descriptors in the model at 95% confidence limit shown in Table 6 are all less than 0.05. This implies that the null hypothesis is rejected. Thus we accepted the alternative hypothesis. Hence we infer that there is a significant relationship between the activities of the inhibitor molecules and descriptors used in building the model at p < 0.05.
Inter-correlation
Statistics
VPC-6
maxHdsCH
TDB9v
RDF50i
P-value (Confidence interval)
VIF
Mean effect (ME)
VPC-6
1
0.000635
2.6534
0.6564
maxHdscH
−0.48503
1
1.9E-10
1.4534
−0.7539
TDB9v
−0.47846
0.97976
1
7.19E-07
2.7685
−0.6542
RDF50i
−0.43535
0.89894
0.86990
1
3.1E-10
1.7645
0.5434
Y- Randomization parameter test were reported in table 7. The low R2 and Q2 values for several trials confirm that the built QSAR model is stable, robust and reliable. While the
value greater than 0.5 assured that the built model is powerful and not inferred by chance.
Model
R
R^2
Q^2
Original
0.977158
0.954837
0.93073
Random 1
0.704427
0.496217
0.230077
Random 2
0.31634
0.100071
−0.30244
Random 3
0.450162
0.202646
−0.31618
Random 4
0.644703
0.415642
0.081168
Random 5
0.291935
0.085226
−0.48463
Random 6
0.272277
0.074135
−0.30177
Random 7
0.162146
0.026291
−0.58698
Random 8
0.312504
0.097659
−0.45173
Random 9
0.375268
0.140826
−0.24959
Random 10
0.551218
0.303842
−0.05525
Random models parameters
Average r:
0.408098
Average r^2:
0.194256
Average Q^2:
−0.24373
cRp^2:
0.867578
Plot of predicted activity against experimental activity of training and test set where shown in Figs. 2 and 3 respectively. The R2 value of 0.9809 for training set and R2 value of 0.8756 for test set reported in this study was in agreement with Genetic Function Approbation (GFA) derived R2 value reported in Table 2. This confirms the robustness and reliability of the model. Plot of standardized residual versus experimental activity shown in Fig. 4 indicates that there was no systematic error in the model built as the spread of standardized residual values were on both sides of zero (Jalali-Heravi and Kyani, 2004).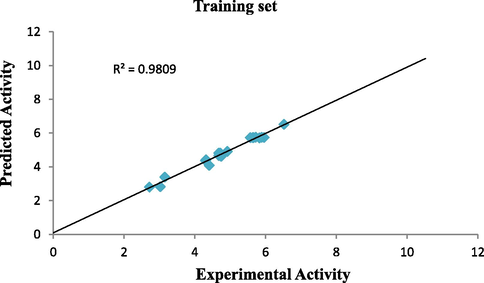
Plot of predicted activity vs experimental activity of training set.
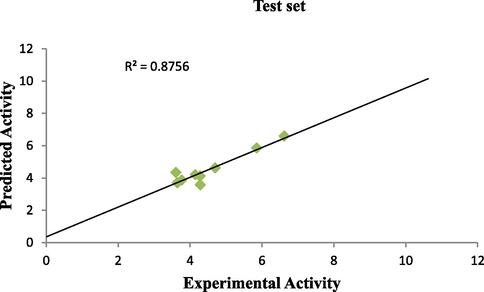
Plot of predicted activity vs experimental activity of test set.
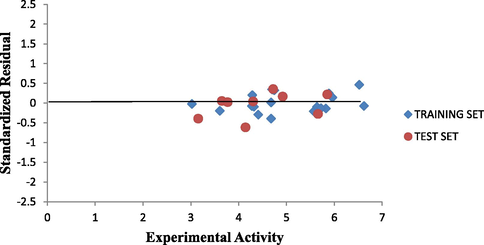
Plot of Standardized residual activity vs experimental activity.
The leverage values for the entire compounds in the dataset were plotted against their standardized residual values leading to discovery of outliers and influential compound in the models. The Williams plot of the standardized residuals versus the leverage value is shown in Fig. 5. From our result it is evident that all the compounds were within the square area ±3 of standardized cross-validated residual produced by the model. Therefore no compound is said to be an outlier. However, only one compound is said to be an influencing compound since its leverage value is greater than the warning leverage (h∗ = 0.79). This was attributed to difference in its molecular structure compared to other compounds in the dataset.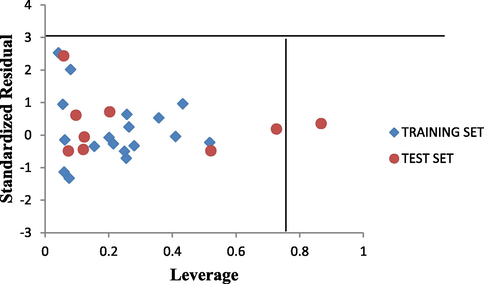
The Williams plot of the standardized residuals vs the leverage value.
3.2 Docking studies
Molecular docking studies were carried out between the targets (DNA gyrase) of M. tuberculosis and 4-Alkoxy-Cinnamic derivatives. The prepared receptor and ligand were shown in Fig. 6. Six (6) ligands inhibitor (compounds 3, 6, 11, 12, 13 and 27) with better activity were selected and docked with the target in order to elucidate the interaction and the binding mode. These ligands were found to bind strongly with the active sites of the target DNA gyrase. Binding affinity values for these compounds ranges from (−6.4 to −10.4 kcal/mol) as reported in Table 8. All these ligands have higher binding score greater than the binding affinity of isoniazid (−5.3 kcal/mol) and enthambutol (−5.8 kcal/mol), the standard anti-tuberculosis drug. The ligand (compound 6) with best activity was selected for visualization purpose utilizing Discovery Studio Fig. 6 Visualizer as shown in Figs. 7 and 8 below. Ligand 6 formed three hydrogen bonds (2.18648, 2.74251, 1.93669, 2.18638A°) with GLN27, HIS280, GLN277 and PRO119 of the target. In addition, it also formed hydrophobic bond with HIS52, LEU105 and MET99 of the target site.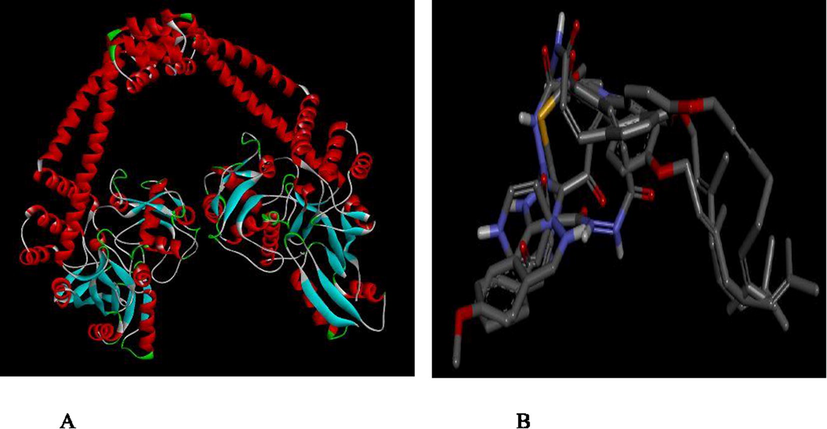
(A) Prepared structure of DNA GYRASE (B) 3D structures of the prepared ligands.
Ligand
Binding Affinity (BA) kcal/mol
Target
Hydrogen bond
Hydrophobic
Amino acid
Bond length (Ao)
3
−7.0
DNA gyrase
ASN27
2.03015
HIS52A, LEU105, LEU48
SER118
2.68232
HIS52
6
−10.4
DNA gyrase
GLN277
2.18648
HIS52, LEU105, MET99
HIS280
2.74251
GLN277
1.93669
PRO119
2.18638
11
−9.3
DNA gyrase
SER118
2.05449
TRP103, GLN277, VAL278
TRP103 GLN101
2.83906
2.28021
12
−8.2
DNA gyrase
TRP10
3.06624
VAL78, ALA167, PRO119
SER104
2.91227
13
−6.4
DNA gyrase
LEU274
2.64383
GLN277, VAL278
SER306
1.9718
27
−7.6
DNA gyrase
SER104
2.31108
HIS52, HIS52
SER118
2.40131
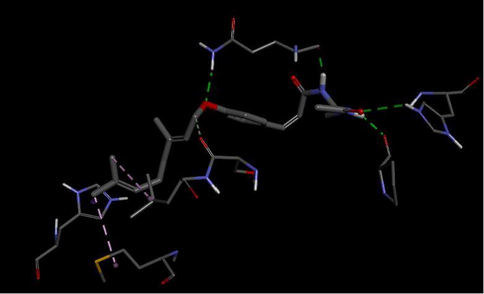
3D interactions between DNA gyrase and Ligand 6.
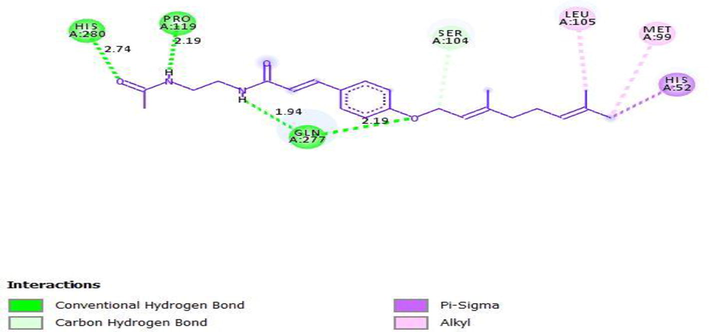
2D interactions between DNA gyrase and Ligand 6.
Hydrogen bond interaction between the ligand 6 and DNA gyrase target of Mycobacterium Tuberculosis is shown in Fig. 9. A total of four hydrogen bonds were formed. The N–H of the amide group of the ligand acts as hydrogen donor and formed two hydrogen bonds with GLN277 and PRO119 of the target. While the C⚌O of the ligand acts as hydrogen acceptor and formed a hydrogen bond with HIS280 of the target. The oxygen atom of the alkoxy group of the ligand acts as hydrogen acceptor and formed hydrogen with GLN277 of the target.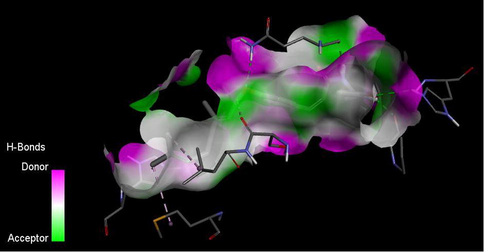
H-bond interaction between the ligand 6 and M. tuberculosis target (DNA gyrase).
4 Conclusions
QSAR and Molecular docking studies results offered enough information to understand the structure–activity relationship and identified the structural features influencing the activity of 4-Alkoxy-Cinnamic derivatives. QSAR model generated was able to predict the activity of 4-Alkoxy-Cinnamic derivatives as a potent anti-tubercular agent and molecular docking studies carry out help to understand and elucidate the interaction between the inhibitor compounds and the target site of M. tuberculosis (DNA gyrase). Results from the model showed that the pMIC of the studied inhibitors against M. tuberculosis was affected by (VPC-6, maxHdscH, TDB9v and RDF50i) descriptors. The robustness, applicability and stability of the QSAR model generated have been established by internal and external validation assessment. Robustness and Stability of the model obtained by these validation tests implies that the model can be used to design new 4-Alkoxy-cinnamic derivatives with improved anti-mycobacterium tuberculosis activity. The studies showed that the ligand 3, 6, 11, 12, 13 and 27 (binding affinities ranges from −6.4 to −10.4 kcal/mol) with better activities (5.8, 6.62, 6.52, 5.96, 5.87 and 5.85 kcal/mol) were better than the commercially sold anti-mycobacterium tuberculosis; enthambutol (−5.8 kcal/mol) and isoniazid (−5.3 kcal/mol) drugs. Moreover, Ligand 6 with the highest activities (6.62 kcal/mol) and binding energy (−10.4 kcal/mol) was found to be more potent than its co-ligands. This study provides a valuable approach for medicinal and pharmaceutical researchers to design and synthesis new anti-tubercular agent.
References
- A novel QSAR model for predicting induction of apoptosis by 4-aryl-4H-chromenes. Bioorg. Med. Chem.. 2006;14:6686-6694.
- [Google Scholar]
- Becke’s three parameter hybrid method using the LYP correlation functional. J. Chem. Phys.. 1993;98:5648-5652.
- [Google Scholar]
- Resistência aos medicamentos anti-tuber-Resistência aos medicamentos anti-tuberculose de cepas de Mycobacterium tuberculosis isoladas de pacientes atendidos em hospital geral de referência para tratamento de AIDS no Rio de Janeiro. J. Bras. Pneumol.. 2004;30:425-432.
- [Google Scholar]
- 3D-QSAR studies of indole derivatives as phosphodiesterase IV inhibitors. Eur. J. Med. Chem.. 2003;38:975-982.
- [Google Scholar]
- Comparative molecular field analysis (CoMFA). 1. Effect of shape on binding of steroids to carrier proteins. J. Am. Chem. Soc.. 1988;110:5959-5967.
- [Google Scholar]
- Synthesis and anti-mycobacterial activity of (E)-N′-(monosubstituted-benzylidene) isonicotinohydrazide derivatives. Eur. J. Med. Chem.. 2008;43:1344-1347.
- [Google Scholar]
- Design, synthesis, and biological evaluation of new cinnamic derivatives as antituberculosis agents. J. Med. Chem.. 2011;54:1449-1461.
- [Google Scholar]
- Natural cinnamic acids, synthetic derivatives and hybrids with antimicrobial activity. Molecules. 2014;19:19292-19349.
- [Google Scholar]
- The key DNA-binding residues in the C-terminal domain of Mycobacterium tuberculosis DNA gyrase A subunit (GyrA) Nucleic Acids Res.. 2006;34:5650-5659.
- [Google Scholar]
- Computer-aided linear modeling employing QSAR for drug discovery. Sci. Res. Essays. 2009;4:1559-1564.
- [Google Scholar]
- Use of computer-assisted methods for the modeling of the retention time of a variety of volatile organic compounds: a PCA-MLR-ANN approach. J. Chem. Inf. Comput. Sci.. 2004;44:1328-1335.
- [Google Scholar]
- Modeling corrosion inhibition of iron in acid medium by genetic function approximation method: A QSAR model. Corros. Sci.. 2011;53:3457-3465.
- [Google Scholar]
- Predicting biological activity of Anticancer Molecules 3-ary l-4-hydroxyquinolin-2-(1H)-one by DFT-QSAR models. Int. J.. 2013;3:32-42.
- [Google Scholar]
- Development of the Colle-Salvetti correlation-energy formula into a functional of the electron density. Phys. Rev. B. 1988;37:785.
- [Google Scholar]
- Personal experience with four kinds of chemical structure drawing software: review on ChemDraw, ChemWindow, ISIS/Draw, and ChemSketch. J. Chem. Inf. Comput. Sci.. 2004;44:1886-1890.
- [Google Scholar]
- Prediction of toxicity using a novel RBF neural network training methodology. J. Mol. Model.. 2006;12:297-305.
- [Google Scholar]
- Hepatotoxicity associated with isoniazid preventive therapy: a 7-year survey from a public health tuberculosis clinic. JAMA. 1999;281:1014-1018.
- [Google Scholar]
- Quantitative structure-activity relationship study of substituted-[1, 2, 4] oxadiazoles as S1P1 agonists. Sci: J. Curr. Chem. Pharm; 2013. p. :3.
- Current pharmaceutical design of antituberculosis drugs: future perspectives. Curr. Pharm. Des.. 2010;16:2656-2665.
- [Google Scholar]
- Fighting tuberculosis: an old disease with new challenges. Med. Res. Rev.. 2005;25:93-131.
- [Google Scholar]
- The importance of being earnest: validation is the absolute essential for successful application and interpretation of QSPR models. Mol. Inform.. 2003;22:69-77.
- [Google Scholar]
- Validation of QSAR models-strategies and importance. Int. J. Drug Des. Discov.. 2011;3:511-519.
- [Google Scholar]
- QSAR analysis on tacrine-related acetylcholinesterase inhibitors. J. Biomed. Sci.. 2014;21
- [Google Scholar]
- Artificial neural networks in classification of NIR spectral data: design of the training set. Chemom. Intell. Lab. Syst.. 1996;33:35-46.
- [Google Scholar]
- PaDEL-descriptor: An open source software to calculate molecular descriptors and fingerprints. J. Comput. Chem.. 2011;32:1466-1474.
- [Google Scholar]


